. 2024 May 24;10(21):eadj1564.
doi: 10.1126/sciadv.adj1564. Epub 2024 May 23.

A synthetic lethal dependency on casein kinase 2 in response to replication-perturbing therapeutics in RB1-deficient cancer cells

Affiliations

A synthetic lethal dependency on casein kinase 2 in response to replication-perturbing therapeutics in RB1-deficient cancer cells

Daria Bulanova et al. Sci Adv. .

Abstract

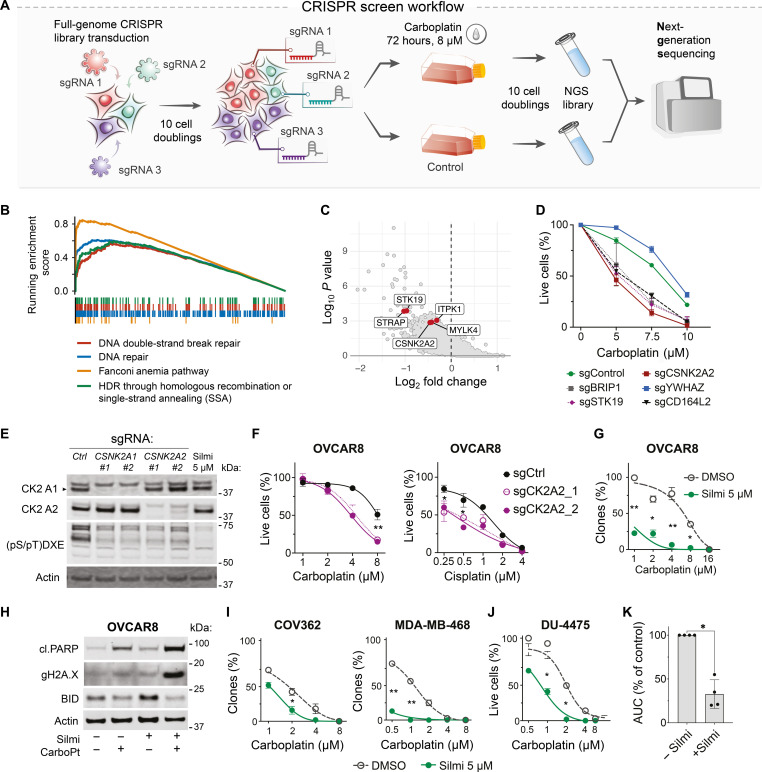
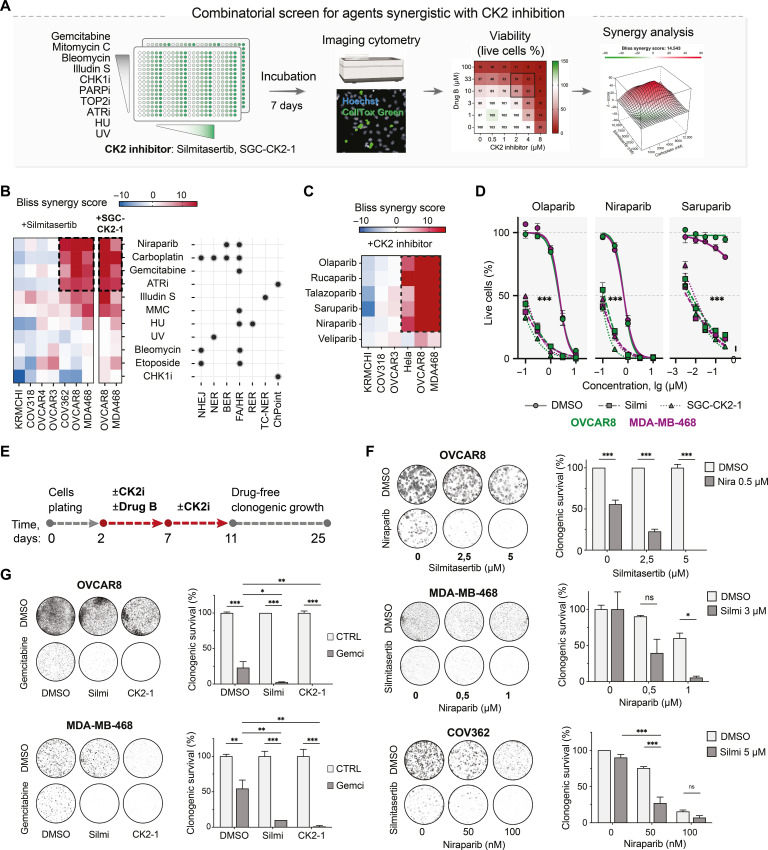
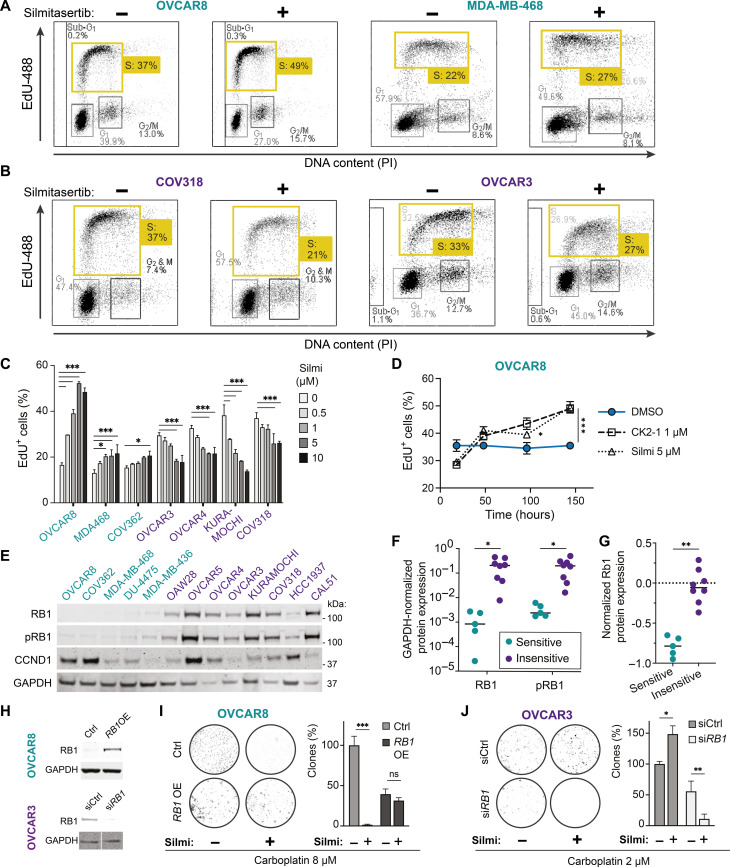
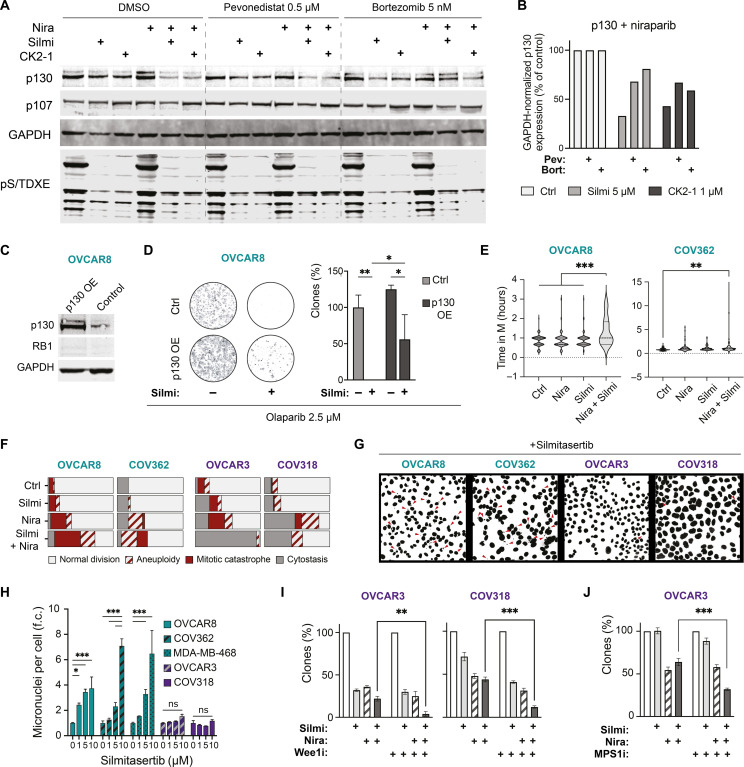
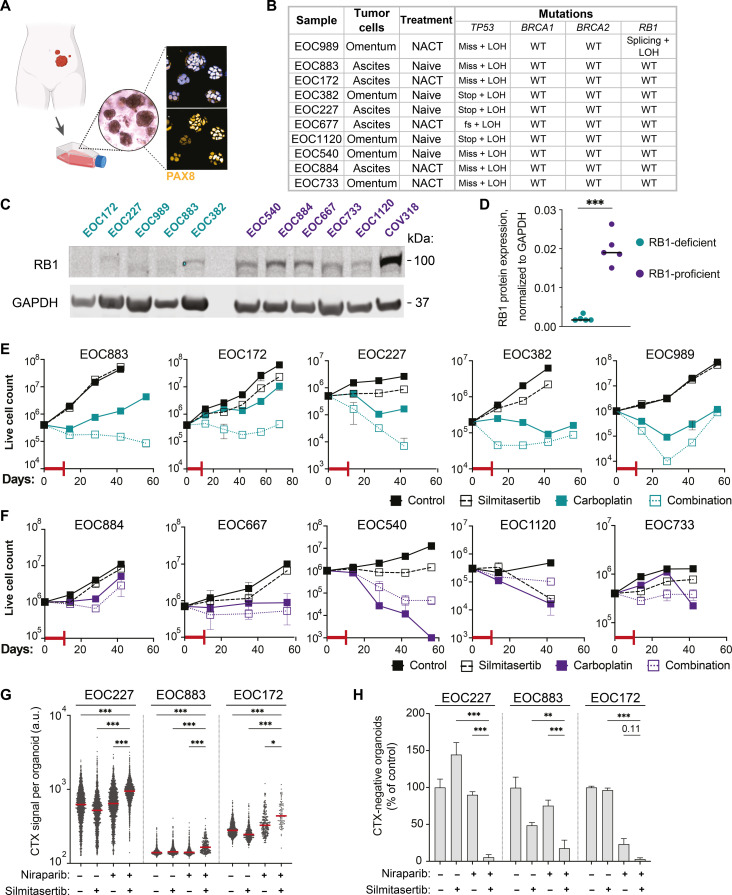
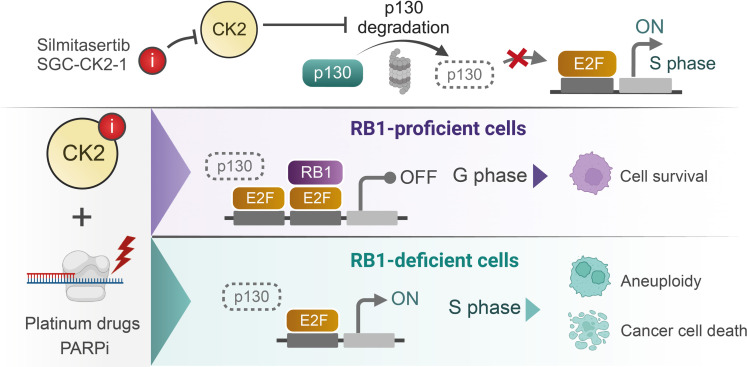
Resistance to therapy commonly develops in patients with high-grade serous ovarian carcinoma (HGSC) and triple-negative breast cancer (TNBC), urging the search for improved therapeutic combinations and their predictive biomarkers. Starting from a CRISPR knockout screen, we identified that loss of RB1 in TNBC or HGSC cells generates a synthetic lethal dependency on casein kinase 2 (CK2) for surviving the treatment with replication-perturbing therapeutics such as carboplatin, gemcitabine, or PARP inhibitors. CK2 inhibition in RB1-deficient cells resulted in the degradation of another RB family cell cycle regulator, p130, which led to S phase accumulation, micronuclei formation, and accelerated PARP inhibition-induced aneuploidy and mitotic cell death. CK2 inhibition was also effective in primary patient-derived cells. It selectively prevented the regrowth of RB1-deficient patient HGSC organoids after treatment with carboplatin or niraparib. As about 25% of HGSCs and 40% of TNBCs have lost RB1 expression, CK2 inhibition is a promising approach to overcome resistance to standard therapeutics in large strata of patients.


Figures

Fig. 1.
Fig. 1.. A CRISPR-Cas9 knockout screen identifies CK2 subunit α′ among carboplatin-sensitizing factors.
(A) Schematic representation of the CRISPR-Cas9 screen experiment. Puromycin-selected cells were propagated for 10 divisions to eliminate the cells with fitness gene knockouts. (B) Gene Ontology analysis with Enrichr (90) reveals significant enrichment in DNA repair factors among carboplatin response-essential genes. (C) Volcano plot, the hit genes encoding for kinases are highlighted. (D) Viability response to carboplatin in OVCAR8 cells with the knockouts of screening hit genes. Image cytometry–based counts of live and dead cells. Hoechst/CellTox green staining, n = 2; data points represent mean ± SD. (E) Immunoblotting for CK2 kinase catalytic subunits and phosphorylation motif in OVCAR8 cells upon CSNK2A1/2 knockout or silmitasertib (5 μM, Silmi) treatment for 4 hours. (F) Viability of OVCAR8 cells with CK2 a′ subunit CRISPR knockout after 7 days of drug exposure. (G) Quantification of the clonogenic survival assay. Treatment: carboplatin ± 5 μM silmitasertib or vehicle (5 days), drug-free regrowth (9 days). Mean ± SD, n = 2, N = 2 for each cell line. (H) Immunoblotting for apoptotic markers in OVCAR8 cells treated for 5 days with 5 μM silmitasertib, 8 μM carboplatin, or their combination. (I) Quantification of the clonogenic survival assay, performed as in (G). (J) Quantification of the survival assay for DU-4475 cells. Treatment: carboplatin ± 5 μM silmitasertib or vehicle (5 days), drug-free regrowth (9 days). Mean ± SD, n = 2, N = 2. Because of suspension growth, DU4475 were counted using Trypan blue exclusion assay and Countess II counter. (K) Difference in the area under the curve (AUC) for carboplatin response curves in OVCAR8, COV362, MDA-MB-468, and DU-4475 in the presence of silmitasertib. *P < 0.05 and **P < 0.01; two-way ANOVA with Tukey posttest for (D), (F), (G), (I), and (J) and Mann-Whitney test for (K). NGS, next-generation sequencing; HDR, homology-directed repair.
Fig. 2.
Fig. 2.. Interactions between silmitasertib and replication-perturbing drugs in HGSC and TNBC cells.
(A) Schematic depiction of the combinatorial drug screening approach. The cell lines (OVCAR8, OVCAR3, OVCAR4, COV362, COV318, and MDA-MB-468) were plated to multiwell plates with single drugs or drug combinations predispensed at a range of doses. After 7 days of incubation, the number of live and dead cells for each treatment was measured by image cytometry using Hoechst and CellTox Green dyes. Viability was calculated as a fraction of the live cells normalized to DMSO-treated controls. (B) Bliss synergy scores heatmaps for drug-drug interactions (mean of two independent experiments for each cell line). NHEJ, nonhomologous end joining; NER, nucleotide excision repair; BER, base excision repair; FA/HR, Fanconi anemia/HR repair pathway; RER, ribonucleotide excision repair; TC-NER, transcription-coupled nucleotide excision repair. The dots mark the published evidence for the contribution of the pathways to the repair of the lesions by the tested drugs. (C) Bliss synergy scores heatmap for PARPi-CK2i interactions in the tested cell lines (mean of two independent experiments for each cell line). (D) PARPi dose response of OVCAR8 and MDA-MB-468 cells in the presence of 5 μM silmitasertib or 1 μM SGC-CK2-1 for 7 days. Image cytometry–based counts of live and dead cells. Hoechst/CellTox green staining, n = 3; data points represent mean ± SD. (E) Schematic timeline of the clonogenic survival test for screen results validation. (F) Clonogenic survival of the indicated cell lines treated with niraparib and silmitasertib as in (E). Mean ± SD (n = 2). (G) Clonogenic survival of OVCAR8 and MDA-MB-468 treated with gemcitabine and CK2 inhibitors silmitasertib or SGC-CK2-1. Bars represent the gemcitabine-surviving fraction of clones normalized to DMSO control or CK2 inhibitor–only condition, respectively. Mean ± SD (n = 2). In (F) and (G), the experiments were performed twice. *P < 0.05, **P < 0.01, and ***P < 0.001, two-way ANOVA with Tukey posttest. UV, ultraviolet; ns, not significant.
Fig. 3.
Fig. 3.. The CK2 inhibition–dependent sensitization to carboplatin or niraparib in HGSC and TNBC cell lines depends on the loss of RB1 expression.
Cell lines were classified as sensitive (cerulean-shaded) or insensitive (violet-shaded) if they presented or did not present sensitization to carboplatin by silmitasertib (Figs. 1 and 2). (A and B) Flow cytometry analysis of the EdU incorporation. The cell lines were pretreated with silmitasertib or vehicle (72 hours), pulse-labeled with EdU (5 μM, 30 min), and immediately fixed and processed using Click-iT assay. (C) Quantification of the EdU incorporation imaging in the cell lines pretreated with silmitasertib for 72 hours. (D) Quantification of the EdU incorporation imaging in OVCAR8 treated with silmitasertib or SGC-CK2-1 for the indicated time. (E) Immunoblotting for RB1, phospho-RB1 (T608), and cyclin D1 expression in the cell lines. (F) Quantification of RB1 and phospho-RB1 immunoblotting in (E). (G) RPPA-based quantification of RB1 protein expression in cell lines from the CCLE study (44). Classification of the cell lines as in (E). (H) Immunoblotting analysis of RB1 expression in OVCAR8 cells transduced with TFORF1844 lentivector (top) and OVCAR3 transfected with 30 nM RB1-targeting siRNA (bottom). (I and J) Clonogenic survival of RB1-overexpressing OVCAR8 and RB1-depleted OVCAR3 cells. The cells were treated with indicated concetrations of carboplatin ± silmitasertib (5 or 2 μM for OVCAR8 or OVCAR3, respectively) or their combination for 48 hours and replated to six-well plates in drug-free media. The number of colonies in carboplatin-treated control transfectants is taken as 100%. For (C), (D), (I), and (J), the bars represent mean ± SD, n = 2, N = 2. *P < 0.05, **P < 0.01, and ***P < 0.001, two-way ANOVA with Tukey posttest. For (F) and (G), *P < 0.05 and **P < 0.01, Mann-Whitney test. PI, propidium iodide; GAPDH, glyceraldehyde phosphate dehydrogenase.
Fig. 4.
Fig. 4.. CK2 inhibition triggers p130 degradation, mitotic cell death, and postmitotic aneuploidy in RB1-deficient HGSC cells.
(A) Immunoblotting for p107 and p130 abundance in OVCAR8 cells. Treatment: 1 μM niraparib ± 5 μM silmitasertib or 1 μM SGC-CK2-1 for 48 hours and DMSO, bortezomib, or pevonedistat for an additional 24 hours. pS/TDXE, CK2 phosphorylation motif. Image-wide nonlinear adjustments of the brightness of the Western blot membrane scan were applied for presentation clarity. (B) Quantification of p130 protein levels in niraparib-treated cells in (A). (C) Immunoblotting for p130 expression in TFORF1500 lentivector-expressing OVCAR8. (D) Clonogenic survival of p130-overexpressing (p130 OE) OVCAR8. Treatment: Olaparib ± 5 μM silmitasertib for 48 hours and then drug-free media for 7 days. The number of colonies in olaparib-treated control transfectants is taken as 100%. (E) Time from prometaphase until cytokinesis for the mitotic division resulting in two daughter cells. Treatment: Niraparib ± 5 μM silmitasertib, 48 hours before the start of the time-lapse imaging (every 15 min for 96 hours in total). Asynchronous cells. (F) Outcomes of mitoses in RB1-deficient (cerulean-shaded) and RB1-proficient (violet-shaded) HGSC cell lines in (E). Cells were considered cytostatic if no mitotic rounding and division were observed during 48 hours. N = 2, 50 to 60 cells per condition. (G) Representative images of Hoechst-stained nuclei of the indicated cell lines. Treatment: Silmitasertib, 120 hours. Red arrowheads indicate micronuclei. (H) Quantification of the imaging experiment in (G) presented as fold-change (f.c.) of the controls. At least 500 nuclei were counted for each condition. N = 2. (I and J) Clonogenic survival of RB1-proficient cell lines treated with silmitasertib and niraparib for 72 hours. Wee1 inhibitor adavosertib (0.3 μM) or MPS1 inhibitor AZ3146 (0.5 μM) was added for the last 18 hours of the drug treatment, followed by drug-free growth for 7 days. N = 2. For (D), (F), and (G), *P < 0.05, **P < 0.01, and ***P < 0.001, two-way ANOVA with Tukey posttest.
Fig. 5.
Fig. 5.. Efficacy of silmitasertib in combination with carboplatin or niraparib in HGSC patient–derived organoids.
(A) Schematics of the establishment of the HGSC organoids (created with BioRender). Immunofluorescent imaging of PAX8, HGSC histologic marker (91), in organoids. (B) Characteristics of the selected set of organoids. NACT, neoadjuvant platinum-based chemotherapy. Mutations: fs, frameshift; stop, stop gain; miss, missense mutation; splicing, splicing isoform mutation; LOH, loss of heterozygosity; WT, wild type. (C) Immunoblotting analysis of RB1 protein expression in the set of organoids. (D) Quantification of the immunoblot in (C). (E and F) Long-term survival of RB1-deficient (cerulean-shaded) and RB1-proficient (violet-shaded) organoids. The organoids were exposed to the drugs alone or in combination for 7 days, followed by additional 4 days in the presence of a vehicle or silmitasertib alone (red T-line, drug treatment, 11 days in total). After the drug treatment, the organoids were passaged at the density of 5 × 10⁵ live cells per 200 μl of the gel for 6 to 8 weeks. N = 2, mean 土 SD. (G) Quantification of the CellTox Green fluorescent signal per organoid. N = 2, n of organoids (30 to 300 per well) varied depending on the treatment. (H) Viability of RB1-deficient organoids in (H), the number of CellTox Green-negative (live) organoids expressed as the % of DMSO control. Plots present mean ± SD. *P < 0.05, **P < 0.01, and ***P < 0.001, Mann-Whitney test for (C) and two-way ANOVA with Tukey posttest for (G) and (H). a.u., arbitrary units.
Fig. 6.
Fig. 6.. A schematic putative mechanism of action of the CK2 inhibitors combined with replication-perturbing therapeutics.
Inhibition of CK2 kinase results in degradation of RB1 paralog p130, which contributes to deregulation of the S phase progression and triggers postmitotic aneuploidy and mitotic cell death in RB1-deficient cancer cells exposed to the carboplatin or PARPis (created with BioRender).

References

    1. Bowtell D. D., Böhm S., Ahmed A. A., Aspuria P.-J., Bast R. C., Beral V., Berek J. S., Birrer M. J., Blagden S., Bookman M. A., Brenton J. D., Chiappinelli K. B., Martins F. C., Coukos G., Drapkin R., Edmondson R., Fotopoulou C., Gabra H., Galon J., Gourley C., Heong V., Huntsman D. G., Iwanicki M., Karlan B. Y., Kaye A., Lengyel E., Levine D. A., Lu K. H., McNeish I. A., Menon U., Narod S. A., Nelson B. H., Nephew K. P., Pharoah P., Powell D. J., Ramos P., Romero I. L., Scott C. L., Sood A. K., Stronach E. A., Balkwill F. R., Rethinking ovarian cancer II: Reducing mortality from high-grade serous ovarian cancer. Nat. Rev. Cancer 15, 668–679 (2015). - PMC - PubMed
    1. Bianchini G., De Angelis C., Licata L., Gianni L., Treatment landscape of triple-negative breast cancer —expanded options, evolving needs. Nat. Rev. Clin. Oncol. 19, 91–113 (2021). - PubMed
    1. Cancer Genome Atlas Network , Comprehensive molecular portraits of human breast tumours. Nature 490, 61–70 (2012). - PMC - PubMed
    1. Tutt A., Robson M., Garber J. E., Domchek S. M., Audeh M. W., Weitzel J. N., Friedlander M., Arun B., Loman N., Schmutzler R. K., Wardley A., Mitchell G., Earl H., Wickens M., Carmichael J., Oral poly(ADP-ribose) polymerase inhibitor olaparib in patients with BRCA1 or BRCA2 mutations and advanced breast cancer: A proof-of-concept trial. Lancet 376, 235–244 (2010). - PubMed
    1. Audeh M. W., Audeh M. W., Carmichael J., Penson R. T., Friedlander M., Powell B., Bell-McGuinn K. M., Scott C., Weitzel J. N., Oaknin A., Loman N., Lu K., Schmutzler R. K., Matulonis U., Wickens M., Tutt A., Oral poly(ADP-ribose) polymerase inhibitor olaparib in patients with BRCA1 or BRCA2 mutations and recurrent ovarian cancer: A proof-of-concept trial. Lancet 376, 245–251 (2010). - PubMed

MeSH terms