. 2024 May 24;384(6698):eadh7688.
doi: 10.1126/science.adh7688. Epub 2024 May 24.

Developmental isoform diversity in the human neocortex informs neuropsychiatric risk mechanisms

Affiliations

Developmental isoform diversity in the human neocortex informs neuropsychiatric risk mechanisms

Ashok Patowary et al. Science. .

Abstract

RNA splicing is highly prevalent in the brain and has strong links to neuropsychiatric disorders; yet, the role of cell type-specific splicing and transcript-isoform diversity during human brain development has not been systematically investigated. In this work, we leveraged single-molecule long-read sequencing to deeply profile the full-length transcriptome of the germinal zone and cortical plate regions of the developing human neocortex at tissue and single-cell resolution. We identified 214,516 distinct isoforms, of which 72.6% were novel (not previously annotated in Gencode version 33), and uncovered a substantial contribution of transcript-isoform diversity-regulated by RNA binding proteins-in defining cellular identity in the developing neocortex. We leveraged this comprehensive isoform-centric gene annotation to reprioritize thousands of rare de novo risk variants and elucidate genetic risk mechanisms for neuropsychiatric disorders.


Conflict of interest statement

Competing interests: M.J.G. receives grant funding from Mitsubishi Tanabe Pharma America that is unrelated to this current project. All other authors declare that they have no competing interests.

Figures

Fig. 1.
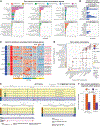
Fig. 1.. The full-length cell type–specific transcriptome of the developing human neocortex at midgestation.
(A) Experimental design for isoform-centric profiling of the developing human brain transcriptome at bulk and single-cell resolution. Briefly, microdissected samples from the progenitor-enriched GZ and neuronally enriched CP were profiled from six separate donors at midgestation. Full-length cDNA libraries were generated from homogenate tissue as well as from dissociated, barcoded single cells with incorporation of UMIs. Single-molecule long-read sequencing (PacBio) was used to quantify transcript-isoforms and integrated with matched short-read scRNA-seq. MZ, marginal zone; SP, subplate; IZ, intermediate zone; SVZ, subventricular zone; VZ, ventricular zone. (B and C) Isoform expression quantifications demonstrated strong biological reproducibility across donors (B) and region-specific clustering through principal components analysis (C). (D) Transcript isoforms identified by Iso-Seq were compared against the Gencode v33 reference. Novel transcripts were further classified by their splice junction matching to annotated Gencode isoforms as described by TALON. ISM, incomplete splice match; NIC, novel in catalog; NNC, novel not in catalog. The “other” category denotes isoforms belonging to antisense, genomic, and intergenic classes. (E) Number of isoforms identified based on classes described in (D). (F) Heatmap shows uniform patterns of relative read-depth coverage across genes, arranged by length. Low coverage is shown in dark blue and high coverage in yellow. (G) Abundance of the isoforms by each class as described in (D). The prefix ISM signal observed at ~105 minimum observed counts (x axis) largely corresponds to a highly expressed isoform of the MAP1B gene. (H and I) Compared with known isoforms, novel transcripts identified in this work were significantly longer (P < 2 × 10⁻¹⁶, Kruskal-Wallis) (H) and contained a significantly greater number of exons (P < 2 × 10⁻¹⁶, Kruskal-Wallis) (I). (J) Proportion of the dominant isoforms for each gene-by-gene expression percentile. For highly expressed genes, the dominant isoform contributed the most to the gene expression. (K) Genes ranked by the number of unique transcript isoforms detected. NDD risk genes (red) (84, 85) had significantly more detected isoforms, controlling for total expression, gene length, and coding length (OR, 1.56; P = 3.6 × 10⁻³, logistic regression).
Fig. 2.
Fig. 2.. Expanded transcriptomic and proteomic complexity.
(A) The NF1 gene locus with 20 previously unidentified brain-expressed isoforms. Tracks from top to bottom include CAGE clusters, 3′seq clusters, ATAC-seq peaks, Gencode isoforms that were not detected in our data, Gencode isoforms detected in our data, and novel isoforms identified from our data. A novel microexon is highlighted. (B) External validation of isoforms by independent datasets: 5′ end validation was performed by presence of peak from CAGE (FANTOM5 and fetal brain cortex) and midgestation cortex ATAC-seq (–41); 3′ end validation was performed by presence of polyA motif or peak from polyAsite database. Percentage of transcript with support at either end is highlighted. (C) The majority of splice junctions identified by Iso-Seq are supported by the external Intropolis splice junction database. (D) Length distribution of the >7000 novel spliced exons uncovered in this study. T, true; F, false. (E) Validation of novel exons using RT-PCR. Expected product size is shown in parentheses along the name of the gene with the exon. Each exon was amplified with the primer sets shown in the schematic. (F) Characterization of novel protein-coding transcripts. Long-read sequencing identified a total of 214,516 transcripts, 149,510 of which were not found in Gencode v33. Of these novel transcripts, 92,422 were predicted to code for protein sequences, and 35,467 predicted ORFs were further confirmed by tandem mass spectrometry (MS/MS) proteomics data. (G) Representative mass spectrum of peptide HGLGTASALDWWPK, which confirms the translation of the identified NF1 microexon. Matched b, y, a, and immonium ions are highlighted. m/z, mass/charge ratio. (H) Number of total transcripts, transcripts with ORFs, transcripts with novel ORFs compared with UniProt human protein sequences, and transcripts with ORFs validated by MS/MS proteomics, plotted per isoform structural category.
Fig. 3.
Fig. 3.. The landscape of isoform switching during human corticogenesis.
(A) Long-read RNA-seq data from GZ and CP samples were contrasted for patterns of DGE, DTE, and DTU. Venn diagram is shown depicting the overlap for genes exhibiting significant DGE, DTE, and DTU (FDR-corrected P < 0.05). (B) A volcano plot depicts isoform switching across the GZ and CP. The x axis depicts the difference in isoform fraction (dIF) for a given transcript in the CP versus GZ. (Inset) Most regionally variable DTU isoforms are not present in Gencode. (C) Functional consequences of isoform-switch events between the GZ and CP are shown. For example, CP–up-regulated isoforms were more significantly likely to have gained rather than lost an exon (2031 versus 1260 isoforms; FDR-corrected P < 10−40). (D) Analysis of DPUI for known transcripts between GZ and CP samples. On average, CP transcripts have higher DPUIs indicative of longer 3′UTRs. (E) Pathway enrichments for genes exhibiting cross-region DTU are notable for dendrite morphogenesis and SWI/SNF complex genes, among others. (F) An example of isoform switching observed within the ASD risk gene SMARCC2. Although total gene expression was not different between the GZ and CP, significant switching was observed among DTU isoforms, with two isoforms exhibiting preferential usage in the GZ (*P < 0.05; ***P < 0.001). (G) Regionally variable genes were enriched for cell type–specific marker genes from scRNA-seq. vRG, ventricular radial glia; oRG, outer radial glia; PgG2M, cycling progenitors (G2/M phase); PgS, cycling progenitors (S phase); IP, intermediate progenitors; ExN, migrating excitatory; ExM, maturing excitatory; ExM-U, maturing excitatory upper enriched; ExDp1, excitatory deep layer 1; ExDp2, excitatory deep layer 2; InMGE, interneuron MGE; InCGE, interneuron CGE; OPC, oligodendrocytes precursor cells; End, endothelial; Per, pericyte; Mic, microglia. (H) Genes containing DTU isoforms were also highly enriched for targets of known brain-enriched RBPs (black bar) and for targets of RBPs profiled in the ENCODE database (gray bar). Targets exhibiting AS, gene expression (GEX), or direct binding (e/CLIP) are indicated. See also fig. S4C.
Fig. 4.
Fig. 4.. Network-based contextualization of isoform usage.
(A) The isoUsage network shows more and stronger enrichments for RBP targets compared with geneExpr and isoExpr. (Top) Density plot of cell type enrichments for the three networks. (Bottom) Density plot of RBP enrichments. (B) The isoUsage network is driven by RBP isoform usage. A dendrogram of the isoUsage network with isoforms (isoUsage and isoExpr) or genes (geneExpr) organized by their presence in isoUsage modules is plotted below. Isoforms of known RBPs are plotted below. (C) Module plots highlighting hub isoforms in isoUsage.M1 and M2. SMARCE1 hub isoforms inform different cellular processes associated with progenitors and neurons. (D) GO for iso.Usage.M1 and M2. (E) Cell type marker enrichment for iso.Usage.M1 and M2. (F) RBP target enrichments for M1 and M2, including targets of the nELAVL RBPs, which include ELAVL1. (G) Transcript models of SMARCE1 hub isoforms. Box highlights exon 3 (M1, turquoise), which encodes part of the IDR, and the shifted reading frame driven by an alternative translational start (M2, blue). M2 SMARCE1isoforms lack either all or a portion of this IDR—in ENST00000647508, exclusion of exon 4 truncates the IDR, whereas in ENST00000643318, a downstream translational start in combination with exon 4 exclusion entirely removes the protein domain. (H) Module plots for iso.Usage.M3 and M8. (I) GO for M3 and M8. (J) Cell type enrichments for M3 and M8. (K) RBP target enrichment for these modules includes targets of RBFOX2, CELF2, and ELAVL2 (an nELAVL), which are hub isoforms in M3 and M8. (L) Transcript models for ELAVL1 hub isoforms. The arrow highlights the primate- and human-conserved sequence missing from these 3′UTRs.
Fig. 5.
Fig. 5.. Cell type–specific isoform diversity in the developing human cortex.
(A) Uniform manifold approximation and projection (UMAP) plot of 4281 cells detected by both 3′ end short-read sequencing and by scIso-Seq. Each dot represents a single cell, colored by its corresponding cluster. UMAP position of the cells is calculated based on isoform expression, whereas cluster labels are as previously defined (3). (B) Heatmap showing differentially expressed isoforms across cell types defined by gene-based clustering. Novel isoforms are shown in red. (C) Distribution of isoforms across cell types shows greater diversity of isoforms in newborn migrating (ExN) and maturing excitatory neurons (ExM) compared with other cell types in midgestation human cortex. (D) Isoforms of PFN2 and RTN4 differentially expressed across cell types along with their predicted functional consequences. Isoform ENST00000239940, predominantly expressed in neurons, is predicted to encode IDR protein domains not found in the progenitor-enriched ENST00000452853 isoform. The novel isoform TALONT000502136 is enriched in neurons, whereas the progenitor-enriched ENST00000317610 isoform is longer and contains multiple reticulon protein domains. (E) Heatmap showing a subset of isoforms with differential usage across cell types (DTU). (F) River plot showing mapping of cells from gene-based (left) to isoform-based (right) clustering. Each line represents a single cell. (G) UMAP of cells clustered based on isoform expression as measured by scIso-Seq. Additional stages of excitatory neuron maturation can be defined using isoform-level data. (H) Heatmap showing differentially expressed isoforms across cell types defined by isoform-based clustering. Novel isoforms are shown in red. (I) Cell lineage trajectory analysis (Monocle3) shows direct neurogenesis through vRG-ExN cells and indirect path through IP cells.
Fig. 6.
Fig. 6.. Isoform-centric contextualization of neurogenetic risk mechanisms.
(A) Enrichment of transcriptomic features, differential expression analyses across cortical regions and cell types, or isoform expression and usage networks with neuropsychiatric disorders. Red lines indicate the FDR-corrected significance thresholds. (B) Cell type enrichments indicate differential isoform expression and utilization in NDD and ASD. (C) Heatmap of isoforms from several NDD and ASD risk genes showing differential usage across the cell types of the developing cortex. Novel isoforms are labeled in red. (D) Number of variants that were reassigned to a more severe consequence after taking into account newly identified isoforms in this study. The size of the dots represents the number of variants in each category. The color of the dots indicates the source of the variants—i.e., DNM from case or control. Colored bars along the axes indicate both the severity of the consequences on a continuous scale and the severity categories on a discrete scale, as defined by VEP. Reassignment to a different severity category may be more impactful than reassignment within the same category. (E) The AKT3 gene locus with representative canonical isoforms and two novel isoforms identified from this study. Red vertical lines indicate the position of case DNMs that affect this locus. The affected regions are highlighted in the lower panels. (Lower right) A DNM located in an intronic region of canonical protein isoforms leads to a missense mutation in a novel protein isoform. (Lower left) A DNM causes the loss of nearby splice acceptor and intron retention only in a novel protein isoform. The retained intron leads to shortened coding sequence and eliminates part of the protein kinase C-terminal domain. (F) Proportion of DNMs predicted to cryptically affect splicing, with or without the annotation of newly identified isoforms from this study.

Update of

References

    1. Lui JH et al., Radial glia require PDGFD-PDGFRb signalling in human but not mouse neocortex. Nature 515, 264–268 (2014). doi: 10.1038/nature13973 - DOI - PMC - PubMed
    1. Walker RL et al., Genetic Control of Expression and Splicing in Developing Human Brain Informs Disease Mechanisms. Cell 179, 750–771.e22 (2019). doi: 10.1016/j.cell.2019.09.021 - DOI - PMC - PubMed
    1. Polioudakis D et al., A Single-Cell Transcriptomic Atlas of Human Neocortical Development during Mid-gestation. Neuron 103, 785–801.e8 (2019). doi: 10.1016/j.neuron.2019.06.011 - DOI - PMC - PubMed
    1. Nowakowski TJ et al., Spatiotemporal gene expression trajectories reveal developmental hierarchies of the human cortex. Science 358, 1318–1323 (2017). doi: 10.1126/science.aap8809 - DOI - PMC - PubMed
    1. Zhong S et al., A single-cell RNA-seq survey of the developmental landscape of the human prefrontal cortex. Nature 555, 524–528 (2018). doi: 10.1038/nature25980 - DOI - PubMed

Publication types

Grants and funding