. 2024 May 24;384(6698):eadi5199.
doi: 10.1126/science.adi5199. Epub 2024 May 24.

Single-cell genomics and regulatory networks for 388 human brains

Prashant S Emani #  1   2 Jason J Liu #  1   2 Declan Clarke #  1   2 Matthew Jensen #  1   2 Jonathan Warrell #  1   2 Chirag Gupta #  3   4 Ran Meng #  1   2 Che Yu Lee #  5 Siwei Xu #  5 Cagatay Dursun #  1   2 Shaoke Lou #  1   2 Yuhang Chen  1   2 Zhiyuan Chu  1 Timur Galeev  1   2 Ahyeon Hwang  5   6 Yunyang Li  2   7 Pengyu Ni  1   2 Xiao Zhou  1   2 PsychENCODE Consortium‡Trygve E Bakken  8 Jaroslav Bendl  9   10   11   12 Lucy Bicks  13 Tanima Chatterjee  1   2 Lijun Cheng  14 Yuyan Cheng  13   15 Yi Dai  5 Ziheng Duan  5 Mary Flaherty  14 John F Fullard  9   10   11   12 Michael Gancz  1   2 Diego Garrido-Martín  16 Sophia Gaynor-Gillett  14   17 Jennifer Grundman  13 Natalie Hawken  13 Ella Henry  1   2 Gabriel E Hoffman  9   10   11   12   18   19 Ao Huang  1 Yunzhe Jiang  1   2 Ting Jin  3   4 Nikolas L Jorstad  8 Riki Kawaguchi  13   20 Saniya Khullar  3   4 Jianyin Liu  13 Junhao Liu  5 Shuang Liu  4 Shaojie Ma  21   22 Michael MargolisSamantha Mazariegos  13 Jill Moore  23 Jennifer R Moran  14 Eric Nguyen  1   2 Nishigandha Phalke  23 Milos Pjanic  9   10   11   12 Henry Pratt  23 Diana Quintero  13 Ananya S Rajagopalan  7 Tiernon R Riesenmy  24 Nicole Shedd  23 Manman Shi  14 Megan Spector  14 Rosemarie Terwilliger  25 Kyle J Travaglini  8 Brie Wamsley  13 Gaoyuan Wang  1   2 Yan Xia  1   2 Shaohua Xiao  13 Andrew C Yang  1   2 Suchen Zheng  1   2 Michael J Gandal  26   27   28   29   30 Donghoon Lee  9   10   11   12 Ed S Lein  8   31   32 Panos Roussos  9   10   11   12   18   19 Nenad Sestan  21 Zhiping Weng  23 Kevin P White  33 Hyejung Won  34 Matthew J Girgenti  25   35   36 Jing Zhang  5 Daifeng Wang  3   4   37 Daniel Geschwind  13   20   27   28   38 Mark Gerstein  1   2   7   24   39 PsychENCODE Consortium
Collaborators, Affiliations

Single-cell genomics and regulatory networks for 388 human brains

Prashant S Emani et al. Science. .

Abstract

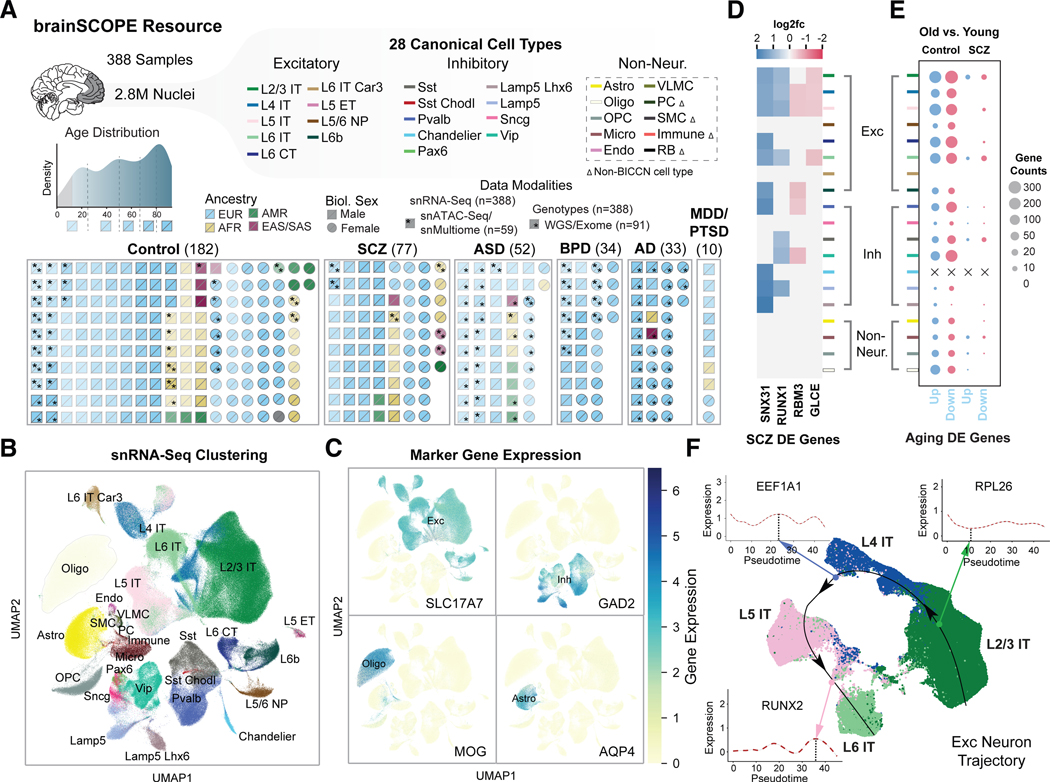
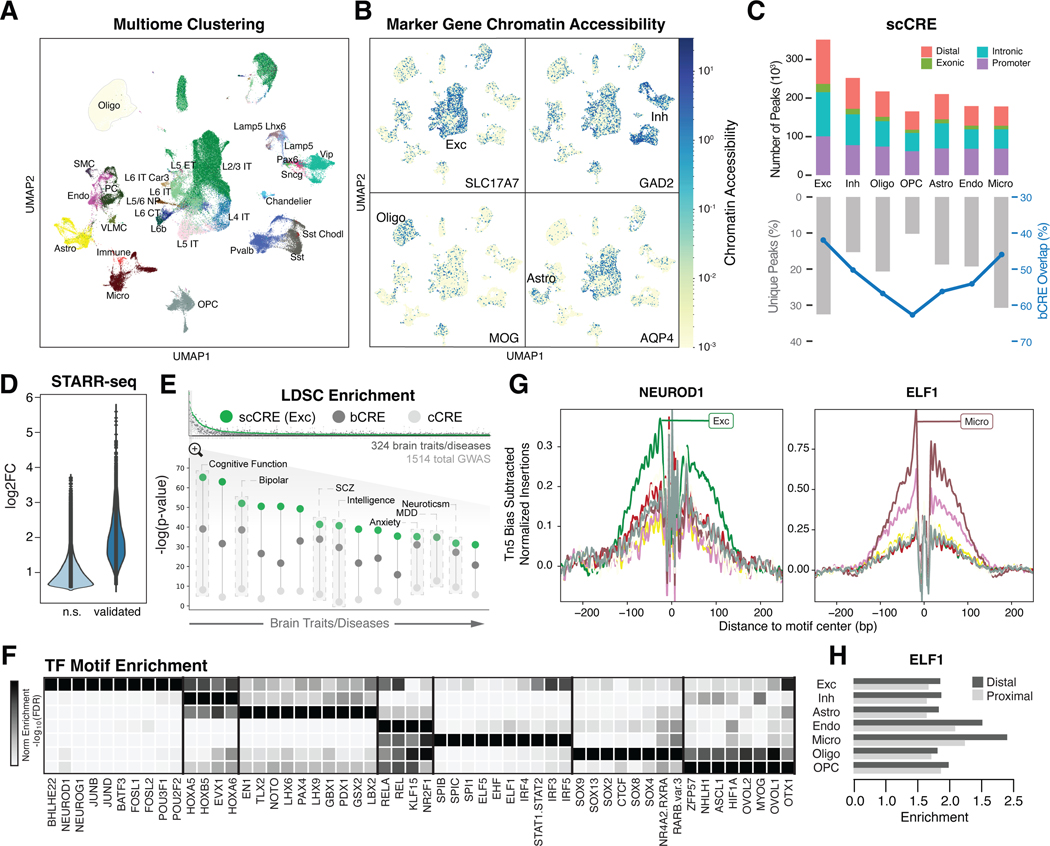
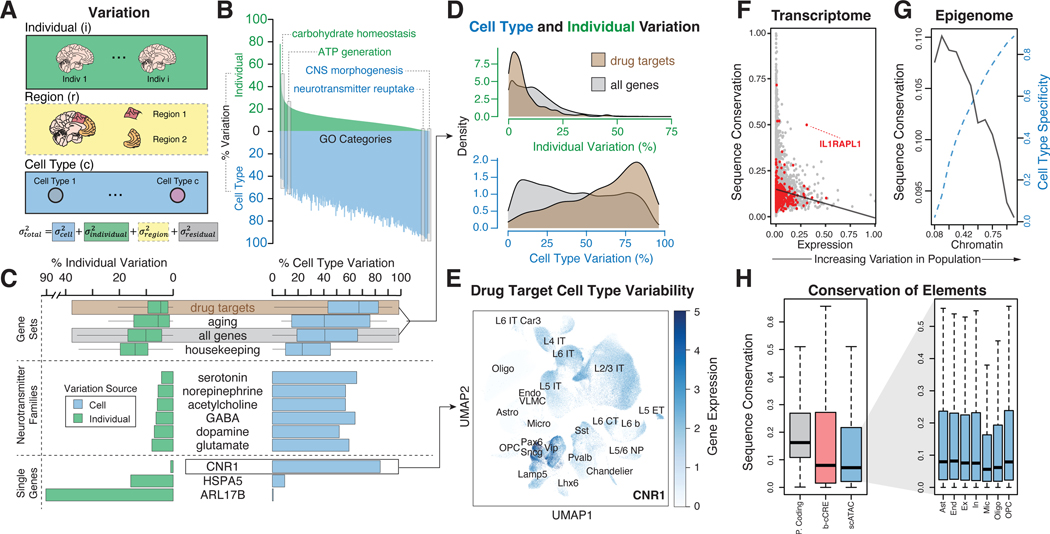
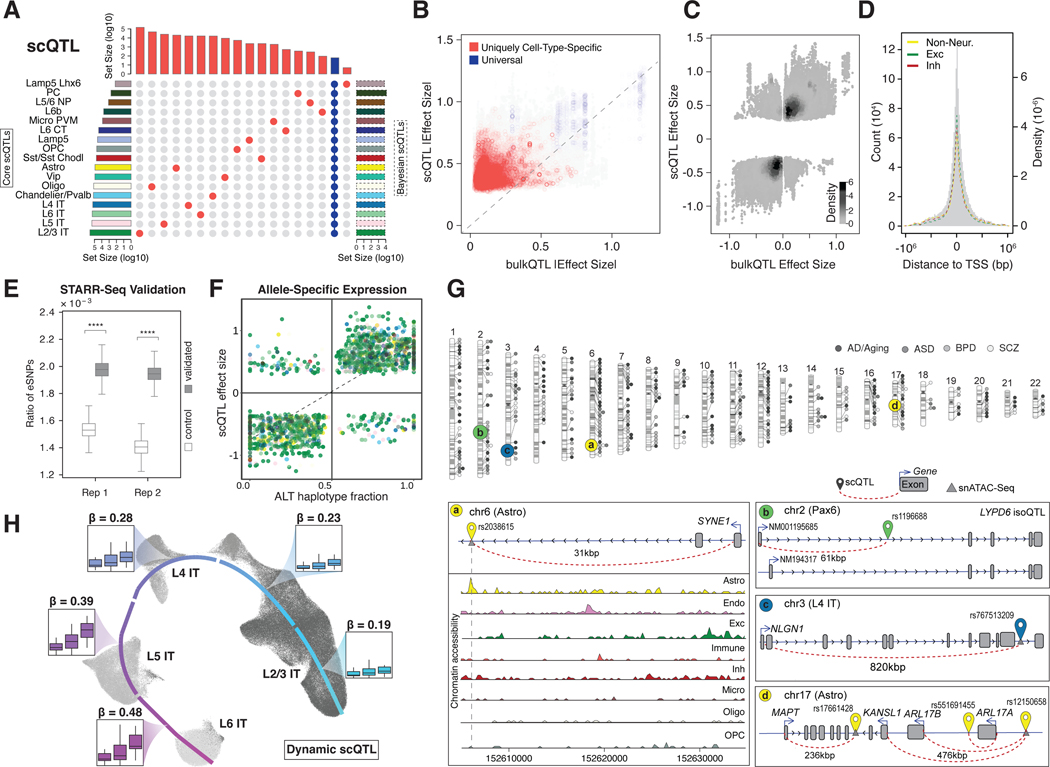
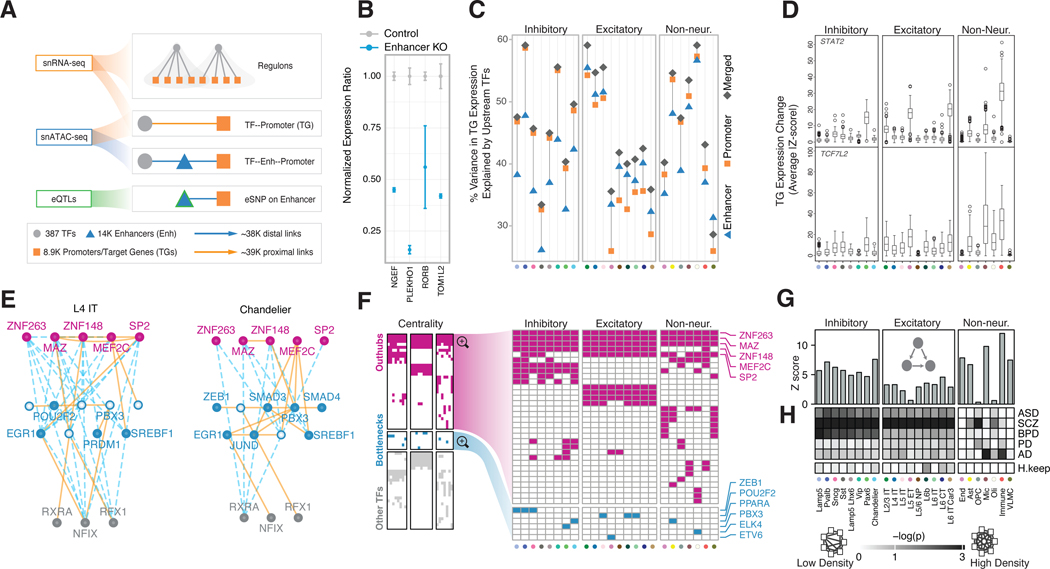
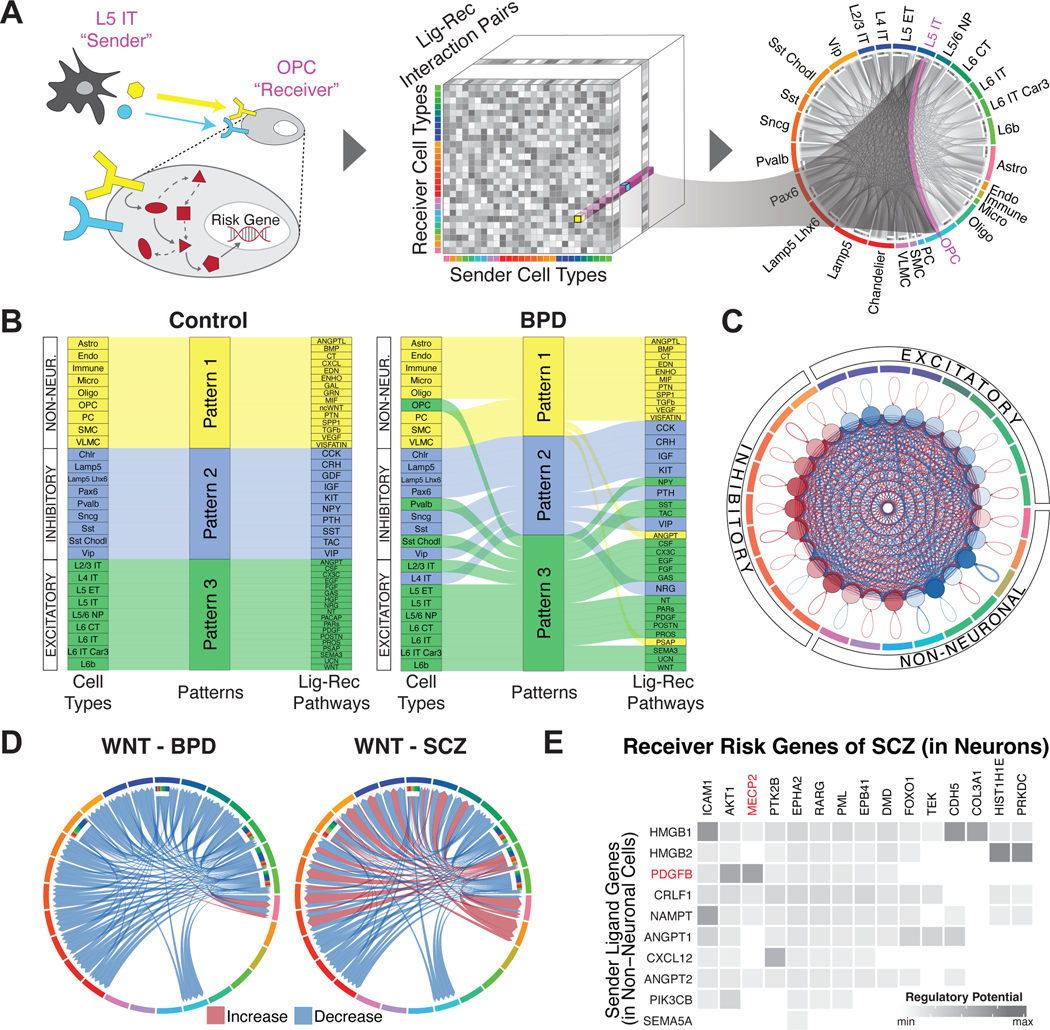
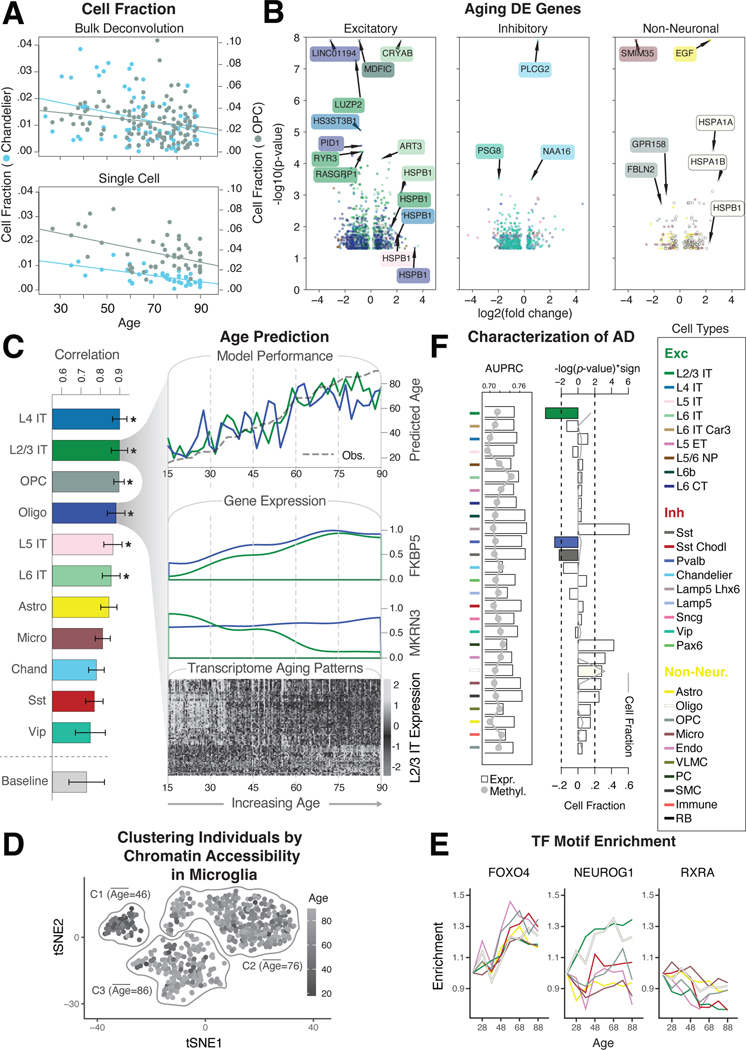
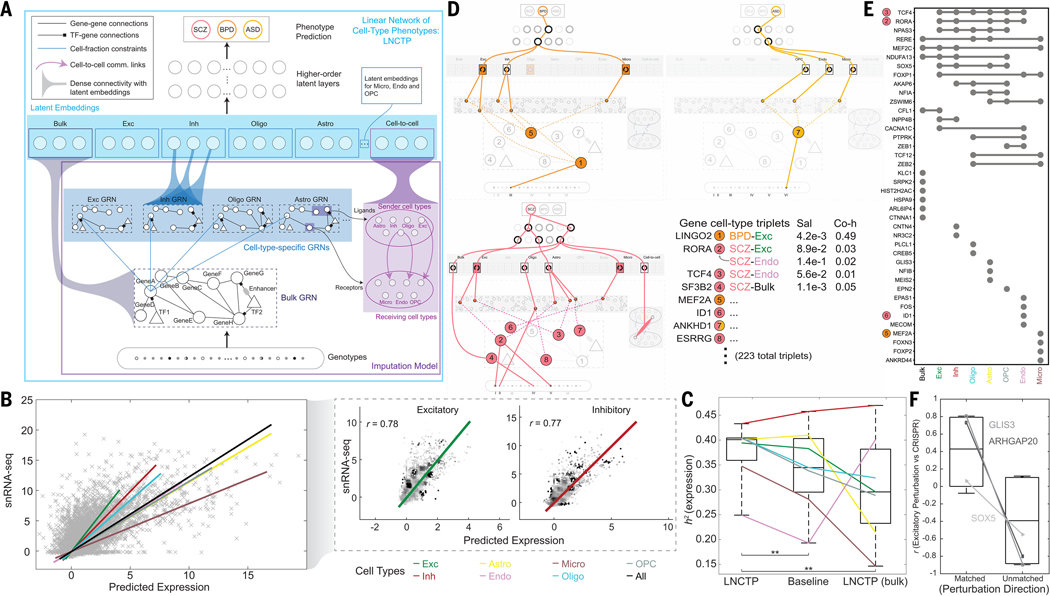
Single-cell genomics is a powerful tool for studying heterogeneous tissues such as the brain. Yet little is understood about how genetic variants influence cell-level gene expression. Addressing this, we uniformly processed single-nuclei, multiomics datasets into a resource comprising >2.8 million nuclei from the prefrontal cortex across 388 individuals. For 28 cell types, we assessed population-level variation in expression and chromatin across gene families and drug targets. We identified >550,000 cell type-specific regulatory elements and >1.4 million single-cell expression quantitative trait loci, which we used to build cell-type regulatory and cell-to-cell communication networks. These networks manifest cellular changes in aging and neuropsychiatric disorders. We further constructed an integrative model accurately imputing single-cell expression and simulating perturbations; the model prioritized ~250 disease-risk genes and drug targets with associated cell types.


Conflict of interest statement

Competing interests

Z. Weng (UMass Chan Medical School) co-founded and serves as a scientific advisor for Rgenta Inc. From April 11, 2022, N.L. Jorstad (Allen Institute for Brain Science) has been an employee of Genentech. K.P.W. (National University of Singapore) is a shareholder in Tempus AI and Provaxus Inc. The other authors declare no competing interests.

Figures

Figure 1.
Figure 1.. Constructing a single-cell genomic resource for 388 individuals.
(A) Overview of the integrative single-cell analysis performed on 388 adult prefrontal cortex samples. (Top) Schematic for 28 cell types grouped by excitatory (Exc), inhibitory (Inh), and non-neuronal cell types (table S3); color labels for each subclass are used consistently throughout all figures (table S4). Dashed box indicates cell types defined with Ma-Sestan marker genes (19), with Δ indicating cell types unique to Ma-Sestan (Bottom) Schematic showing all samples labeled by disease, biological sex, ancestry, age, and available data modalities, including a distribution plot for sample ages (gray indicates pediatric samples excluded from most analyses). (B) UMAP plot for clustering of 28 harmonized cell types from snRNA-seq data derived from 72 samples in the SZBDMulti-seq cohort (using this study as an example of pan-cohort cell typing; see fig. S10 for UMAPs of other studies). (C) UMAP plots highlighting expression of key marker genes in four broad cell types (excitatory: SLC17A7; inhibitory: GAD2; oligodendrocytes: MOG; and astrocytes: AQP4). (D) Differential expression (log2-fold change) of four schizophrenia-related genes across cell types in samples from individuals with schizophrenia (blue for upregulation, red for downregulation). (E) Numbers of DE genes upregulated (blue) and downregulated (red) in older (>70 years) control (left) and schizophrenia (right) individuals per cell type when compared with younger individuals in each group (<70 years). “X” indicates no DE genes were observed for a particular cell type. (F) UMAP plot showing predicted trajectory for excitatory IT neurons in adult control samples from the SZBDMulti-seq cohort. The predicted trajectory proceeds along the cortical layer dimension from L2/3 to L6 in the prefrontal cortex. Inset highlights log-normalized gene expression in cells along the pseudotime axis for three genes.
Figure 2.
Figure 2.. Determining regulatory elements for cell types from snATAC-seq.
(A) UMAP plot for clustering of 28 harmonized cell types from snMultiome data derived from 40 individuals. (B) UMAP plots highlighting chromatin accessibility of key marker genes for four broad cell types (see Fig. 1C). (C) (Top) Counts of open chromatin regions from combined snATAC-seq and snMultiome peaks across cohorts by gene context (promoter, intronic, exonic, or distal). (Bottom) Percentage of unique ATAC peaks found in each cell type. Blue line indicates the percentage of ATAC peaks that overlap with b-cCREs derived from bulk data. (D) Change in enhancer activity among open chromatin regions using STARR-seq assays of predicted enhancers, comparing the log2-fold expression change of validated regions to non-validated regions (n.s.). (E) (Top) LDSC enrichment across GWAS summary statistics for UK BioBank traits and diseases, including brain-related traits (gray bars), cCREs (white circles), b-cCREs (gray circles), and snATAC-seq peaks in excitatory neurons (scCREs, green circles). (Bottom) LDSC enrichment (log-scaled p-values for LDSC analysis as explained in (20)) for select brain traits and disorders. Trait names are listed in table S6. (F) Enrichment (log-scaled FDR) of TF binding motifs among cell-type-specific snATAC-seq peaks. (G) Differential activity of ELF1 in proximal and distal regions across cell types. (H) Cell-type-specific location of TF binding for NEUROD1 (left) and ELF1 (right) across cell types (colors defined in Fig. 1A), based on snATAC-seq footprinting analysis.
Figure 3.
Figure 3.. Measuring transcriptome and epigenome variation across the cohort at the single-cell level.
(A) Schematic for the calculation of overall gene-level variance partition by integrating individual, brain region, and cell-type-specific variation. Variation analysis using different brain regions (denoted with a dashed gray box) was performed on a subset of individuals, shown in fig. S28. (B) Percent expression variation attributed to individuals (green) and cell types (blue) for GO categories, with select GO categories highlighted. (C) Percent inter-individual and cell type variation for specific genes and gene sets, including neurotransmitter families and drug targets. (D) Distribution of individual variation and cell type variation in drug target genes versus all genes. (E) UMAP plot of example drug target, CNR1, demonstrating cell-type-specific expression patterns that contribute to high cell type variability. We also assessed other genes such as serotonin receptor genes in fig. S31C. (F) Comparison of observed expression variation of individual genes with predicted conservation scores (phastCons). Red dots indicate outlier genes. Black line shows a trend of decreasing conservation as expression variation increases. (G) Increased cell-type specificity (dashed blue line) and decreased conservation (black line) observed as the population variability of scCREs increases. (H) (Left) Conservation of protein-coding regions, b-cCREs, and scCREs. (Right) Conservation of scCREs by cell type.
Figure 4.
Figure 4.. Determining cell-type-specific eQTLs from single-cell data.
(A) Partial UpSet plot with identified scQTLs (from the core analysis) that are unique to individual cell types (red) or present across all cell types (blue). Left histogram summarizes the log-scaled total number of core scQTLs per cell type. Right histogram summarizes the log-scaled total number of Bayesian scQTLs per cell type. More complete plots are presented in figs. S36C and S42. (B) Scatter plots comparing absolute eQTL effect sizes between single-cell and bulk RNA datasets, highlighting QTLs shared across >14 cell types (blue) and unique to one cell type (red). (C) Density plot comparing eQTL effect sizes between single-cell and bulk RNA datasets. (D) Histogram with the distribution of scQTLs by distance from eGene transcription start site, with normalized distributions highlighted for the union of scQTLs across excitatory, inhibitory, and non-neuronal cell types. (E) Boxplot showing a significantly higher enrichment of eSNPs in active STARR-seq peaks compared to the control group (p<1.0×10⁻⁴, Mann-Whitney U Test). Two replicates are shown. (F) Scatter plot comparing scQTL effect sizes with allelic ratios of ASE eGenes, or the fraction of ASE gene reads originating from the haplotype with the scQTL alternative allele. ASE genes were identified in 21 MultiomeBrain cohort samples; cell types are represented with the color scheme used in (A). (G) (Top) Chromosome ideogram for the location of eGenes in all cell types related to four brain disorders. (Bottom) Schematics for specific instances of scQTLs for disease-related eGenes. Left schematic shows astrocyte-specific eSNP for SYNE1 along with chromatin accessibility (snATAC-seq) tracks for eight cell types. Top-right schematic shows the isoQTL for LYPD6 in Pax6 inhibitory neurons, leading to altered expression of isoforms with different start codons. Middle and bottom-right schematics show SNP-gene pairs for scQTLs associated with NLGN1 in L4 IT neurons and MAPT in astrocytes, respectively. (H) UMAP plot for predicted trajectory of excitatory neurons in samples from the SZBDMulti-seq cohort. Box plots highlight the expression of EFCAB13, stratified by eSNP genotype in each sample, for cell types in each cortical layer; effect size (𝛃) values for the eSNP increase over pseudotime. Additional information is shown in fig. S53.
Figure 5.
Figure 5.. Building a gene regulatory network for each cell type.
(A) Schematic for the construction of cell-type-specific GRNs based on snRNA-seq, snATAC-seq, and scQTL datasets. (B) Change in expression of four genes after CRISPR-mediated knockout of enhancers identified in cell-type-specific GRNs (blue bars) compared with control samples (gray bars). (C) Percent variance in target gene expression explained by the networks. Orange squares, blue triangles, and gray diamonds indicate variance explained by promoter, enhancer, and merged GRNs, respectively. (D) Changes in expression (average Z-score) of target genes in cell-type-specific regulons among samples with loss-of-function variants that disrupt the TFs TCF7L2 and STAT2. (E) Network graphs depicting a subset of the excitatory (L4 IT) and inhibitory (Chandelier) GRNs that show differential usage of enhancers and promoters. Nodes (TFs) are colored in pink, blue, or gray to represent out-hubs, bottlenecks, and in-hubs, respectively. Nodes without blue fill represent TFs that are absent as bottlenecks in that cell type. Solid orange lines indicate proximal links; distal links are indicated by dashed blue lines. (F) Panel representing the full set of TFs (y-axis) that act as hubs or bottlenecks in different cell types (x-axis). Cells are colored if the TF is found to be a pure hub (magenta) or bottleneck (cyan) in the corresponding cell type. (Note hubs here are out-hubs.) The right panel zooms in to highlight hubs (top) and bottlenecks (bottom). (G) Motif enrichment analysis bar plots showing a stronger enrichment of transcriptional feed-forward loops (illustrated inset) in inhibitory neurons (left) and most non-neuronal cell types (right) compared with excitatory neurons (center). (H) Co-regulatory network changes of disease gene sets across cell types. The white-to-black gradient shows low to high probability (log p-value obtained by random sampling, N=10,000)) of a disease gene set or housekeeping genes (H.keep, y-axis) forming a dense subnetwork in the corresponding cell type (x-axis) (20). Cell types on the x-axis in panels C, D, and F are colored uniquely according to names in panel G.
Figure 6.
Figure 6.. Constructing a cell-to-cell communication network.
(A) Schematic for the construction of cell-to-cell communication networks, based on a matrix of co-expressed ligand-receptor gene pairs in signaling pathways between sender and receiver cell types. Circos plot on the right shows the strength of all identified cell-to-cell interactions, highlighting L5 IT to OPC cell types as an example. Note that this model does not consider the synaptic connectivity between neurons. (B) Sankey plots for differential clustering of incoming interactions in receiver cells across cell types and ligand-receptor signaling pathways for control (left) and bipolar disorder (right) samples. For example, inhibitory Sst and Sst Chodl cell types were assigned to Pattern 2 in controls, along with the SST-SSTR signaling pathway. This makes sense, as these cell types are predominantly characterized by the SST gene. However, in BPD samples, Sst Chodl cells switched from Pattern 2 to 3, along with the SST-SSTR signaling pathway. (C) Circos plot showing differential strength of all cell-to-cell interactions between individuals with schizophrenia and control individuals. Red edges indicate increased interaction strength in schizophrenia samples, while blue edges indicate weaker interaction strength. (D) Circos plots showing changes in cell-to-cell interaction strengths for ligand-receptor genes in the Wnt signaling pathway between individuals with bipolar disorder (left) and schizophrenia (right) compared with control individuals. (E) Predicted likelihoods that ligand genes in non-neuronal cells (y-axis) regulate schizophrenia-associated risk genes (x-axis) in neuronal cell types, with the neurological risk gene MECP2 highlighted in red.
Figure 7.
Figure 7.. Assessing cell-type-specific transcriptomic and epigenetic changes in aging.
(A) Normalized changes in the fraction of OPC (gray) and Chandelier cells (blue) by age, based on bulk RNA-seq deconvolution (top) and single-cell annotation (bottom), with best-fitted lines. (B) Log2-fold changes and p-values from DESeq2 (20) for differentially expressed genes in older vs. younger individuals (±70 years) among excitatory, inhibitory, and non-neuronal cell types. Values with -log(p)>8 are shown as crosses. (C) (Left) Pearson correlation values between model prediction of age and observed age for each cell type and baseline model (covariates). (Top right) Predicted and observed age for oligodendrocytes and L2/3 IT neurons along the age spectrum. (Middle right) Transcriptomic profiles along the age spectrum of two key genes (MKRN3 and FKBP5) related to aging. (Bottom right) Genes demonstrate an increase (light gray) or decrease (dark gray) in expression along the age spectrum. (D) tSNE plot of chromatin peaks showing how chromatin patterns in microglia stratify younger and older individuals into three distinct clusters. (E) Examples of TF binding motifs that display distinct enrichment patterns across cell types and age. (F) (Left) Predictive accuracy (AUPRC) of cell-type-specific expression (bars) and methylation signatures (gray line) towards AD status. (Right) Enrichment of cell fraction changes among individuals with AD. L2/3 IT, Pvalb, and Sst (colored bars) are significantly associated with a decreased cell fraction in AD (log-p value, t-test). Gray line shows the overall median cell fraction of each cell type in AD individuals.
Figure 8.
Figure 8.. Imputing gene expression and prioritizing disease genes across cell types with an integrative model.
(A) LNCTP schematic. Bulk and cell-type gene expression levels were imputed from genotype using a conditional energy-based model incorporating GRNs and cell-to-cell networks. Cell-type-specific nodes with dense connectivity were then incorporated into a deep linear model to predict phenotypes in each sample and prioritize cell types and genes for each trait. (B) (Left) Imputed single-cell expression values from LNCTP compared with observed snRNA-seq expression values, with best-fit lines for all cells and individual cell types. (Right) Correlations among imputed expression values for genes in excitatory and inhibitory neurons with best-fit lines. (C) Comparison of explained variance in gene expression from the LNCTP model with a baseline model using deconvolved, imputed bulk expression data and a model that includes only bulk expression data. Colored lines indicate the performance of individual cell types in each model (**p<0.01, two-tailed paired t-test over gene:cell-type pairs). (D) Schematic for LNCTP model interpretation, showing relationships between prioritized intermediate phenotypes for schizophrenia (SCZ, pink), bipolar disorder (BPD, orange) and ASD (light orange). Gene:cell-type:disease triplets are associated with salience (Sal) and coheritability (Co-h) values (*p<0.05, **p<0.01, two-tailed t-test; data S30). Significant cell type, GRN, and cell-to-cell associations are shown at the latent-embedding layers (p<0.05, two-tailed t-test; data S31–S32). Tree structures connect representative subgraphs (feature combinations) in each model (figs. S80–S81). The schematic also highlights QTL variants linked to the prioritized genes: (I) eQTL (bulk) chr15:60578052, (II) scQTL (Oligo) chr1:216891970, (III) eQTL (bulk) chr9:27902874, (IV) scQTL (Oligo) chr11:66017740, (V) eQTL (bulk) chr15:61553688, and (VI) scQTL (Astro) chr3:158668177. (Note, we shorten the readthrough transcript ANKHD1-EIF4EBP3 to ANKHD1 in ASD.) (E) UpSet plot for SCZ showing overlap between genes with the highest saliency per cell type or bulk expression, including four genes highlighted in panel D (colored circles). (F) Pearson correlations of LNCTP (excitatory neurons in SCZ) and CRISPR perturbation vectors for three example genes, when perturbation directions are matched vs. unmatched, and correlations are calculated across imputed genes (*p<0.05, one-tailed t-test; Fig. S88).

Update of

  • Single-cell genomics and regulatory networks for 388 human brains.
    Emani PS, Liu JJ, Clarke D, Jensen M, Warrell J, Gupta C, Meng R, Lee CY, Xu S, Dursun C, Lou S, Chen Y, Chu Z, Galeev T, Hwang A, Li Y, Ni P, Zhou X; PsychENCODE Consortium; Bakken TE, Bendl J, Bicks L, Chatterjee T, Cheng L, Cheng Y, Dai Y, Duan Z, Flaherty M, Fullard JF, Gancz M, Garrido-Martín D, Gaynor-Gillett S, Grundman J, Hawken N, Henry E, Hoffman GE, Huang A, Jiang Y, Jin T, Jorstad NL, Kawaguchi R, Khullar S, Liu J, Liu J, Liu S, Ma S, Margolis M, Mazariegos S, Moore J, Moran JR, Nguyen E, Phalke N, Pjanic M, Pratt H, Quintero D, Rajagopalan AS, Riesenmy TR, Shedd N, Shi M, Spector M, Terwilliger R, Travaglini KJ, Wamsley B, Wang G, Xia Y, Xiao S, Yang AC, Zheng S, Gandal MJ, Lee D, Lein ES, Roussos P, Sestan N, Weng Z, White KP, Won H, Girgenti MJ, Zhang J, Wang D, Geschwind D, Gerstein M. Emani PS, et al. bioRxiv [Preprint]. 2024 Mar 30:2024.03.18.585576. doi: 10.1101/2024.03.18.585576. bioRxiv. 2024. Update in: Science. 2024 May 24;384(6698):eadi5199. doi: 10.1126/science.adi5199. PMID: 38562822 Free PMC article. Updated. Preprint.

References

    1. Sullivan PF, Geschwind DH, Defining the Genetic, Genomic, Cellular, and Diagnostic Architectures of Psychiatric Disorders. Cell 177, 162–183 (2019). - PMC - PubMed
    1. PsychENCODE Consortium, Revealing the brain’s molecular architecture. Science 362, 1262–1263 (2018). - PubMed
    1. Gandal MJ, Leppa V, Won H, Parikshak NN, Geschwind DH, The road to precision psychiatry: translating genetics into disease mechanisms. Nat. Neurosci. 19, 1397–1407 (2016). - PMC - PubMed
    1. Wang D, Liu S, Warrell J, Won H, Shi X, Navarro FCP, et al. , Comprehensive functional genomic resource and integrative model for the human brain. Science 362, eaat8464 (2018). - PMC - PubMed
    1. GTEx Consortium, The GTEx Consortium atlas of genetic regulatory effects across human tissues. Science 369, 1318–1330 (2020). - PMC - PubMed

Grants and funding