. 2024 May 24;384(6698):eadh1938.
doi: 10.1126/science.adh1938. Epub 2024 May 24.

A data-driven single-cell and spatial transcriptomic map of the human prefrontal cortex

Collaborators, Affiliations

A data-driven single-cell and spatial transcriptomic map of the human prefrontal cortex

Louise A Huuki-Myers et al. Science. .

Abstract

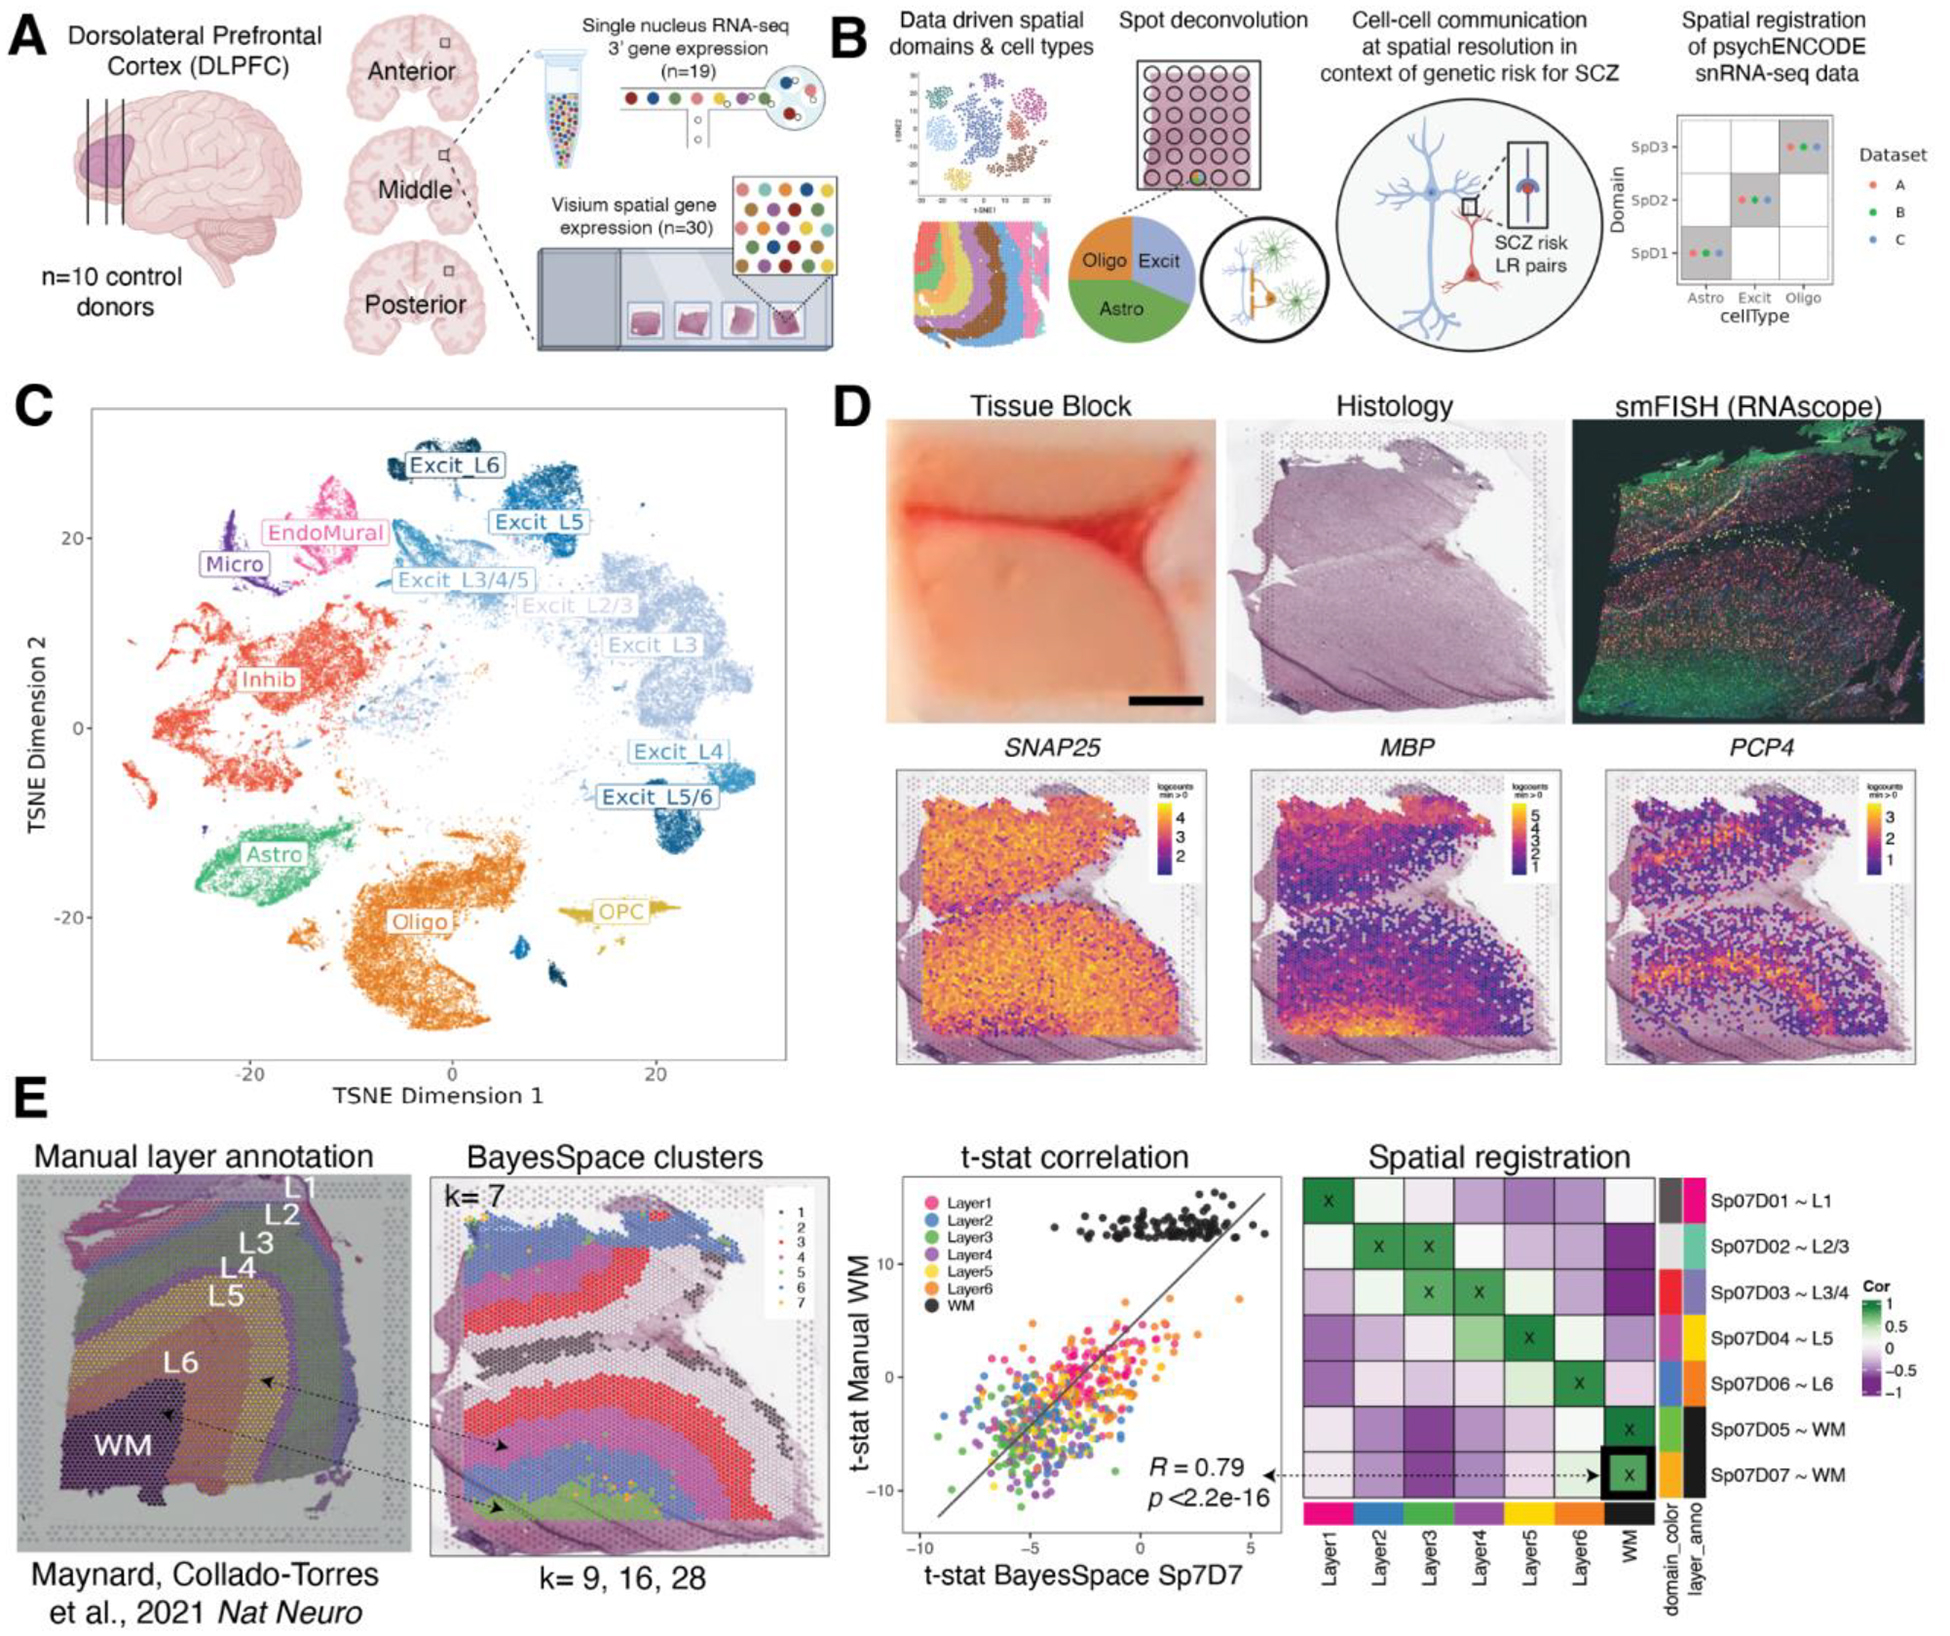
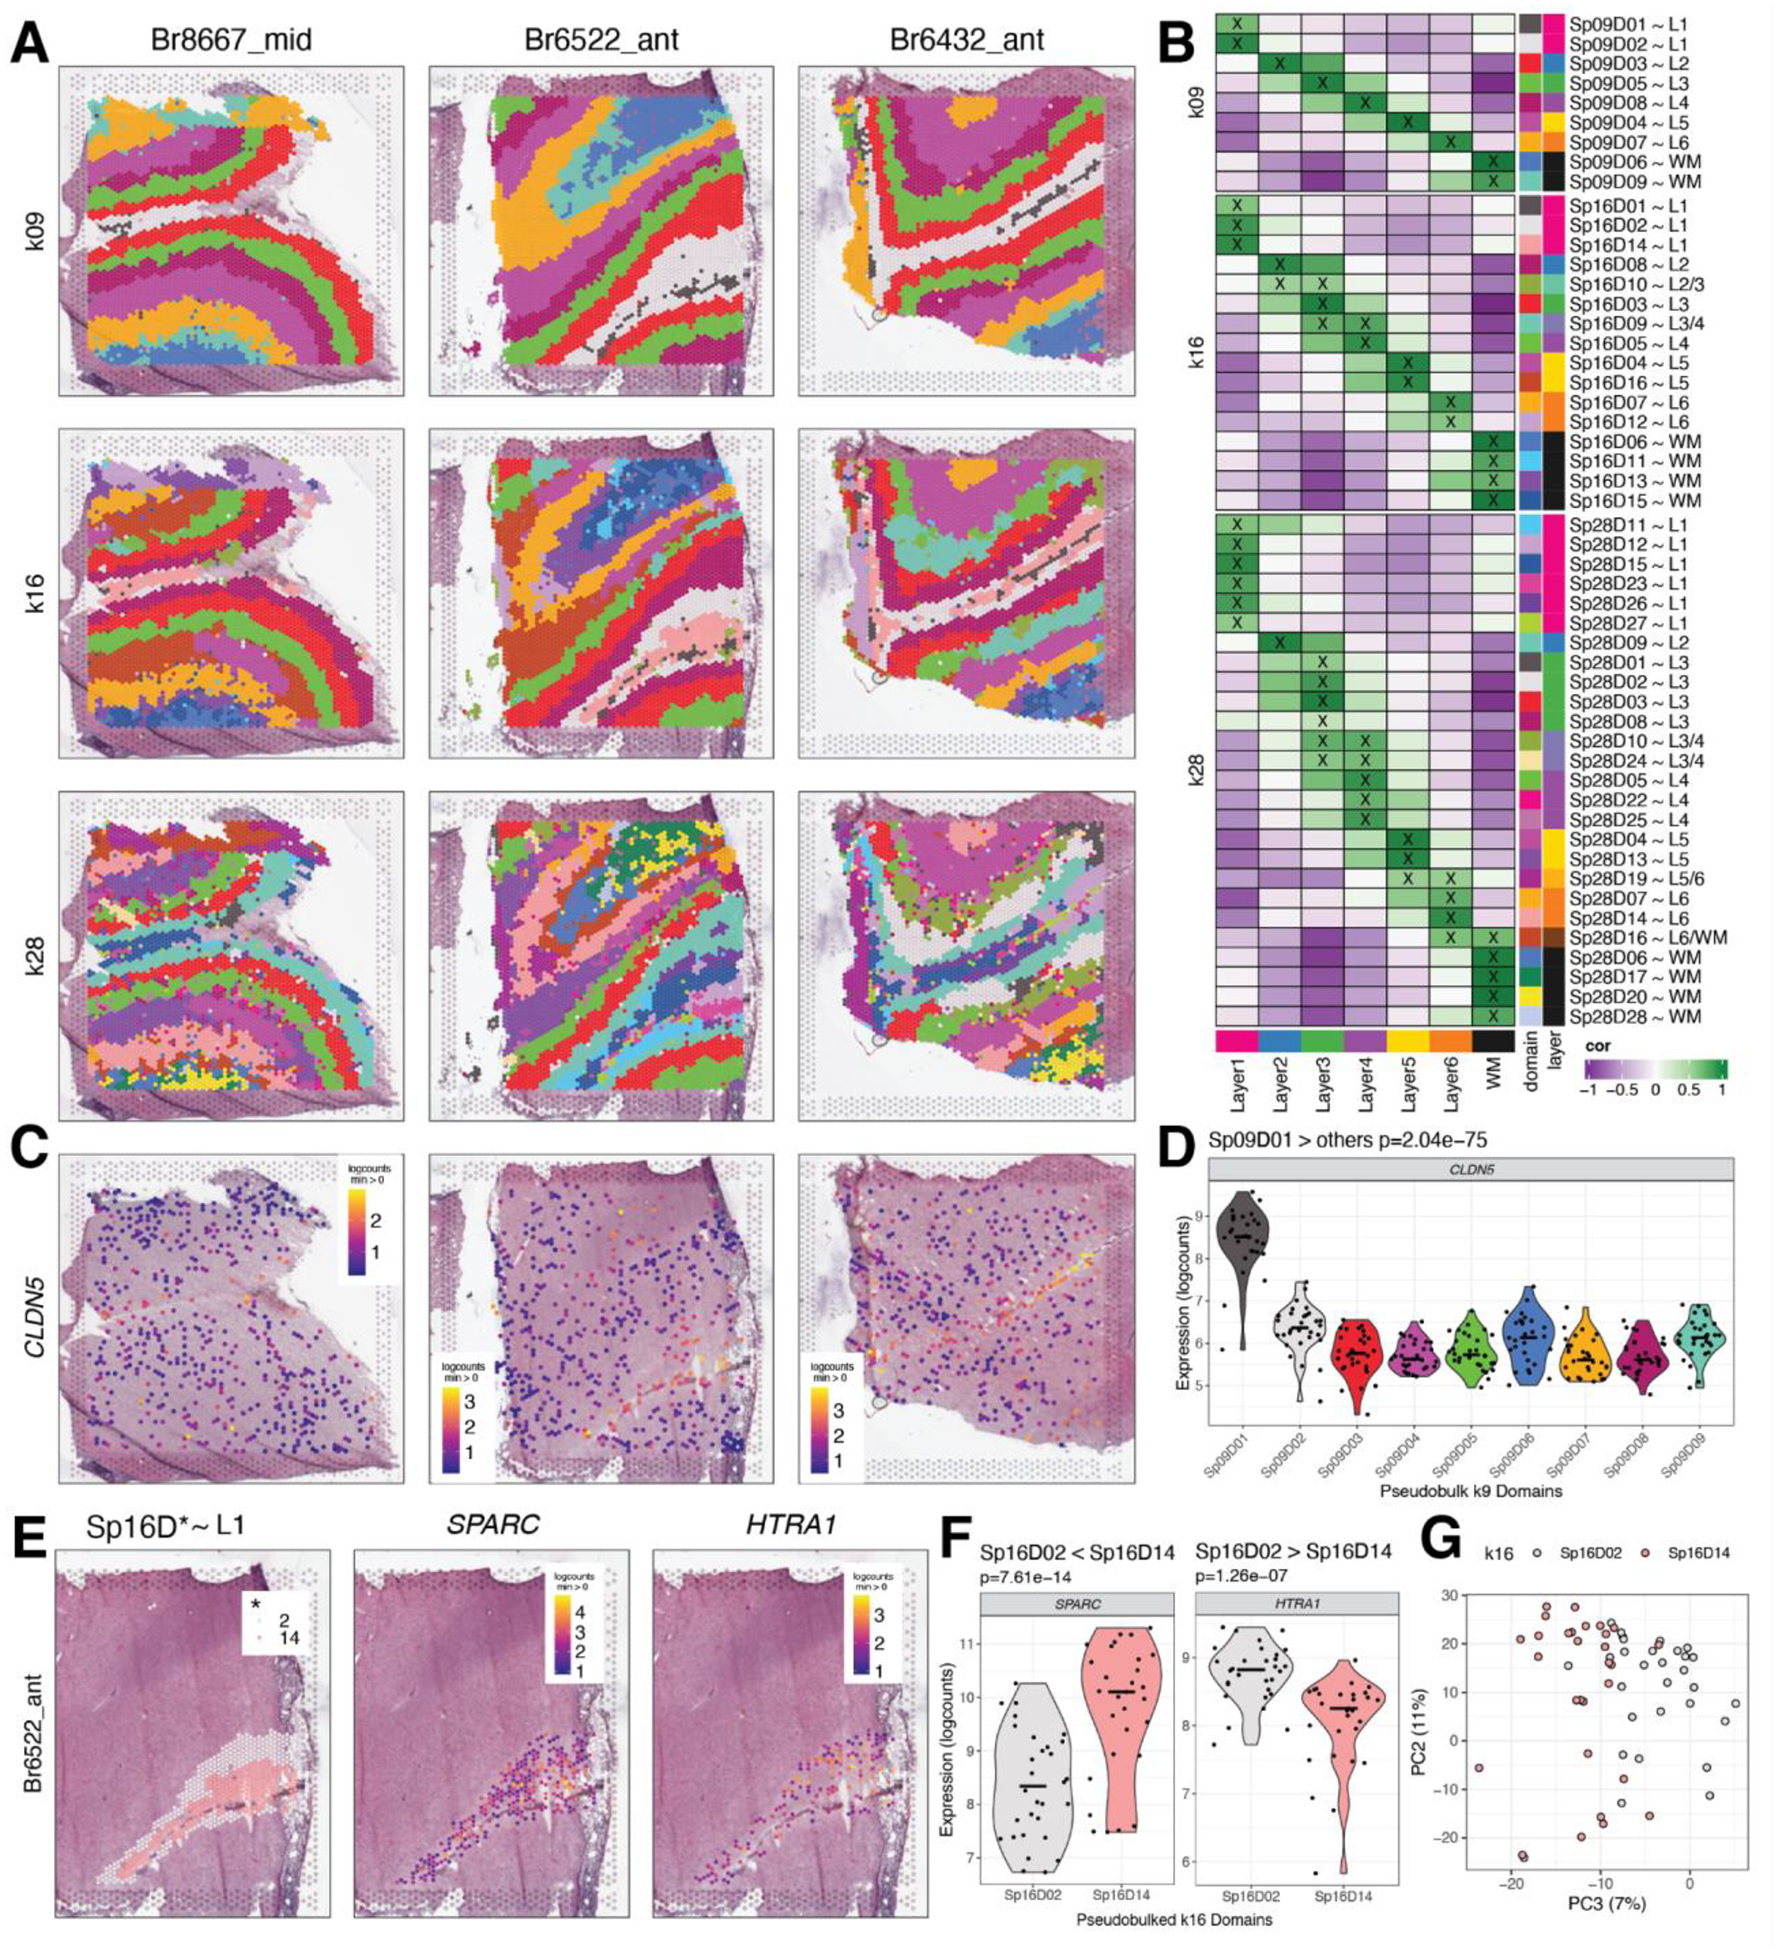
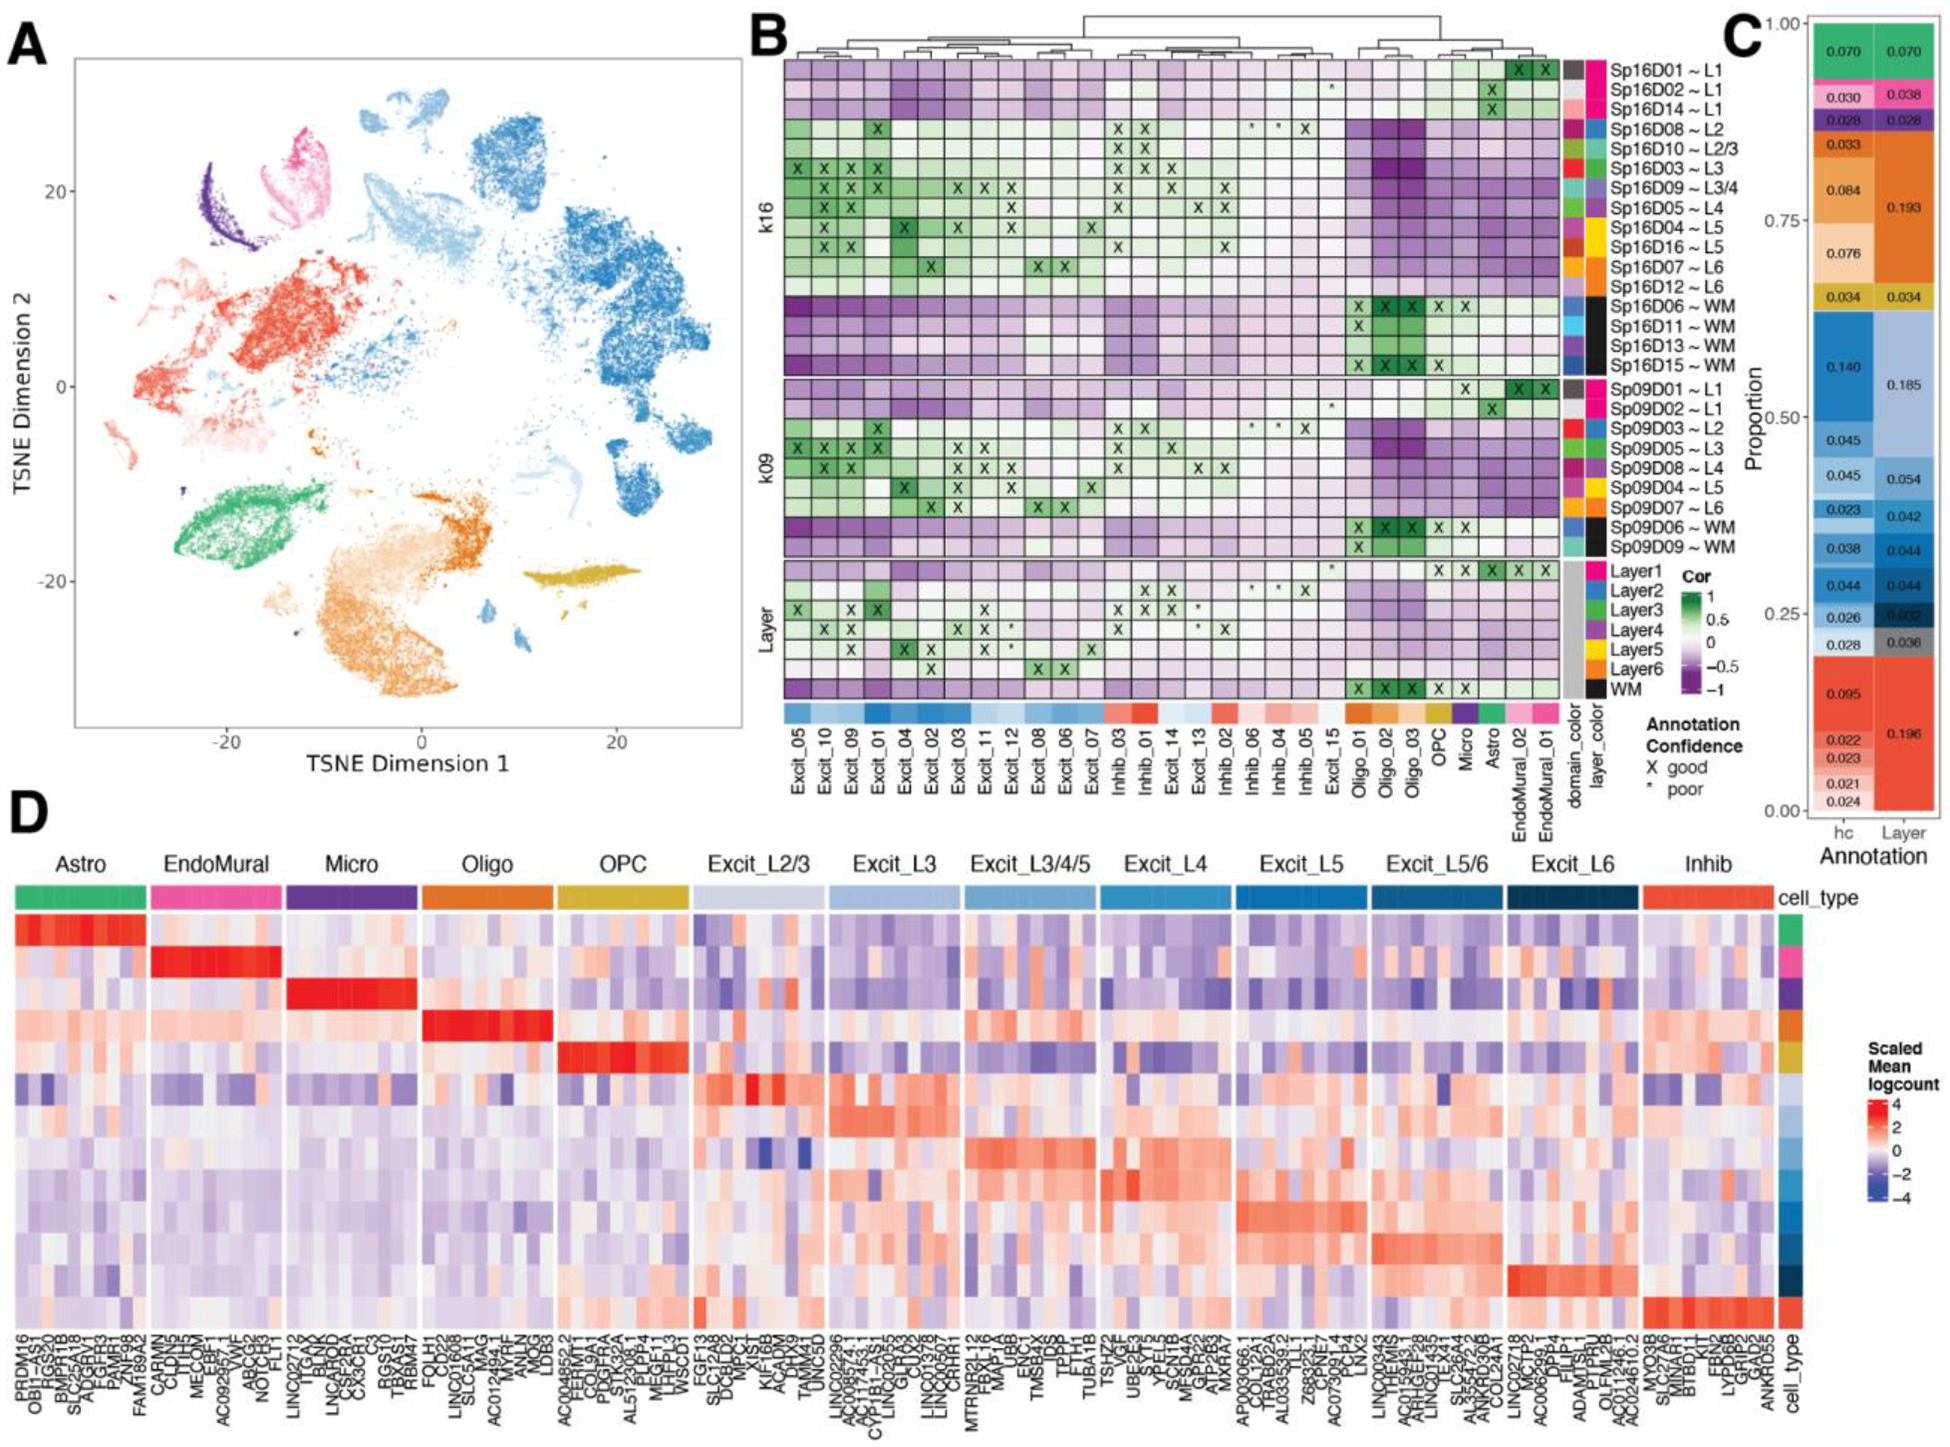
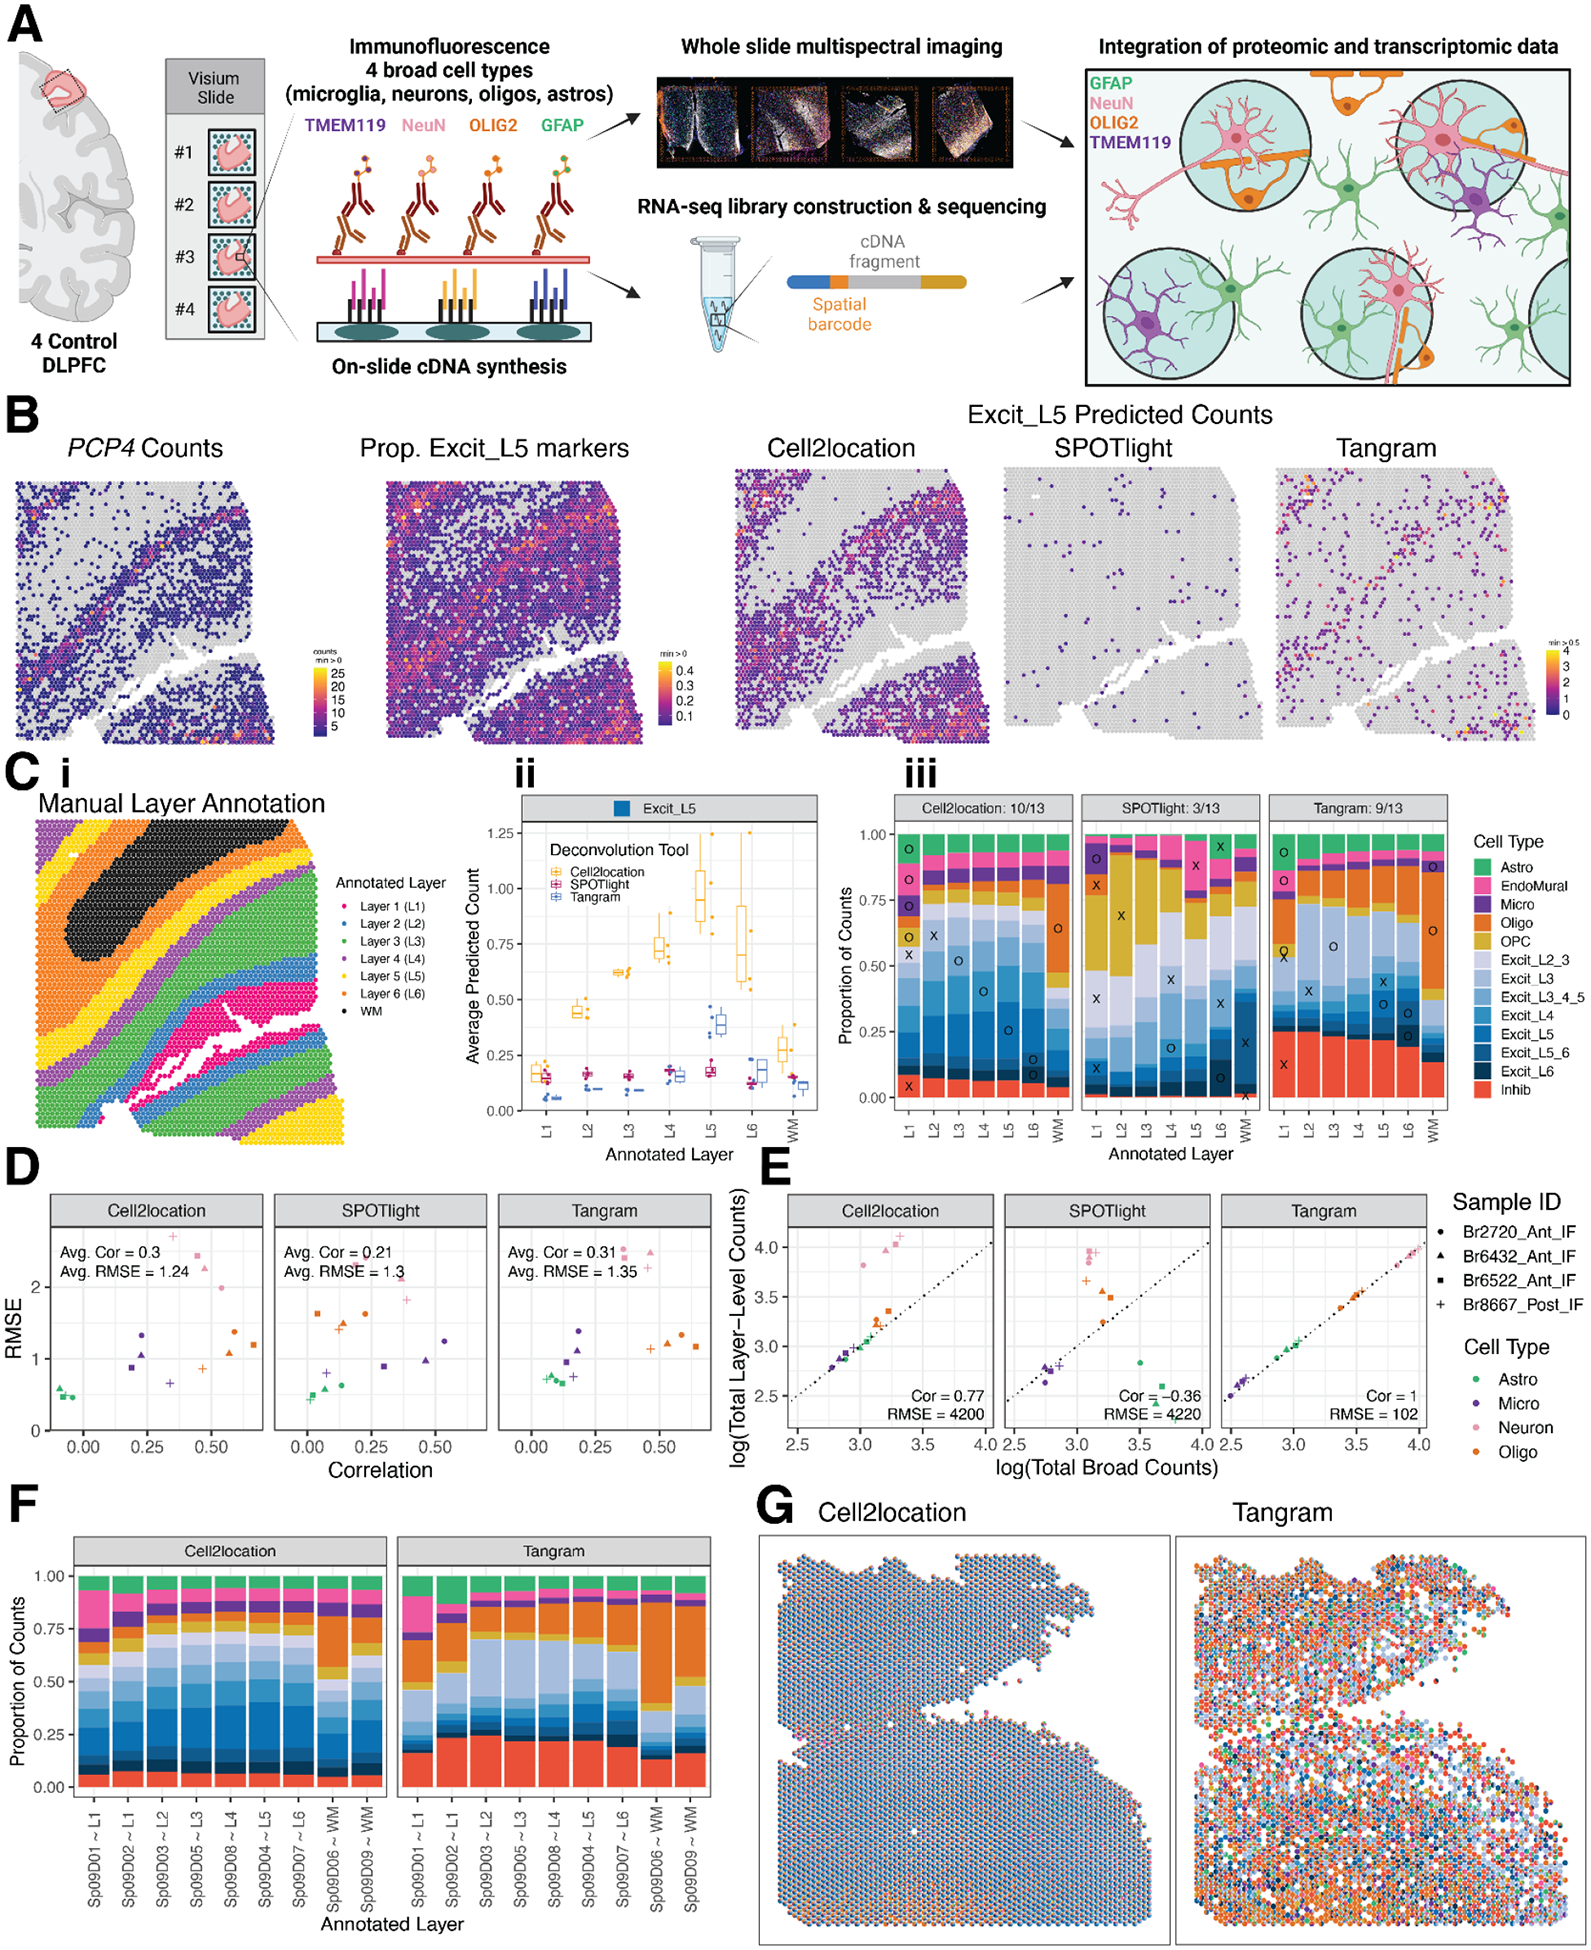
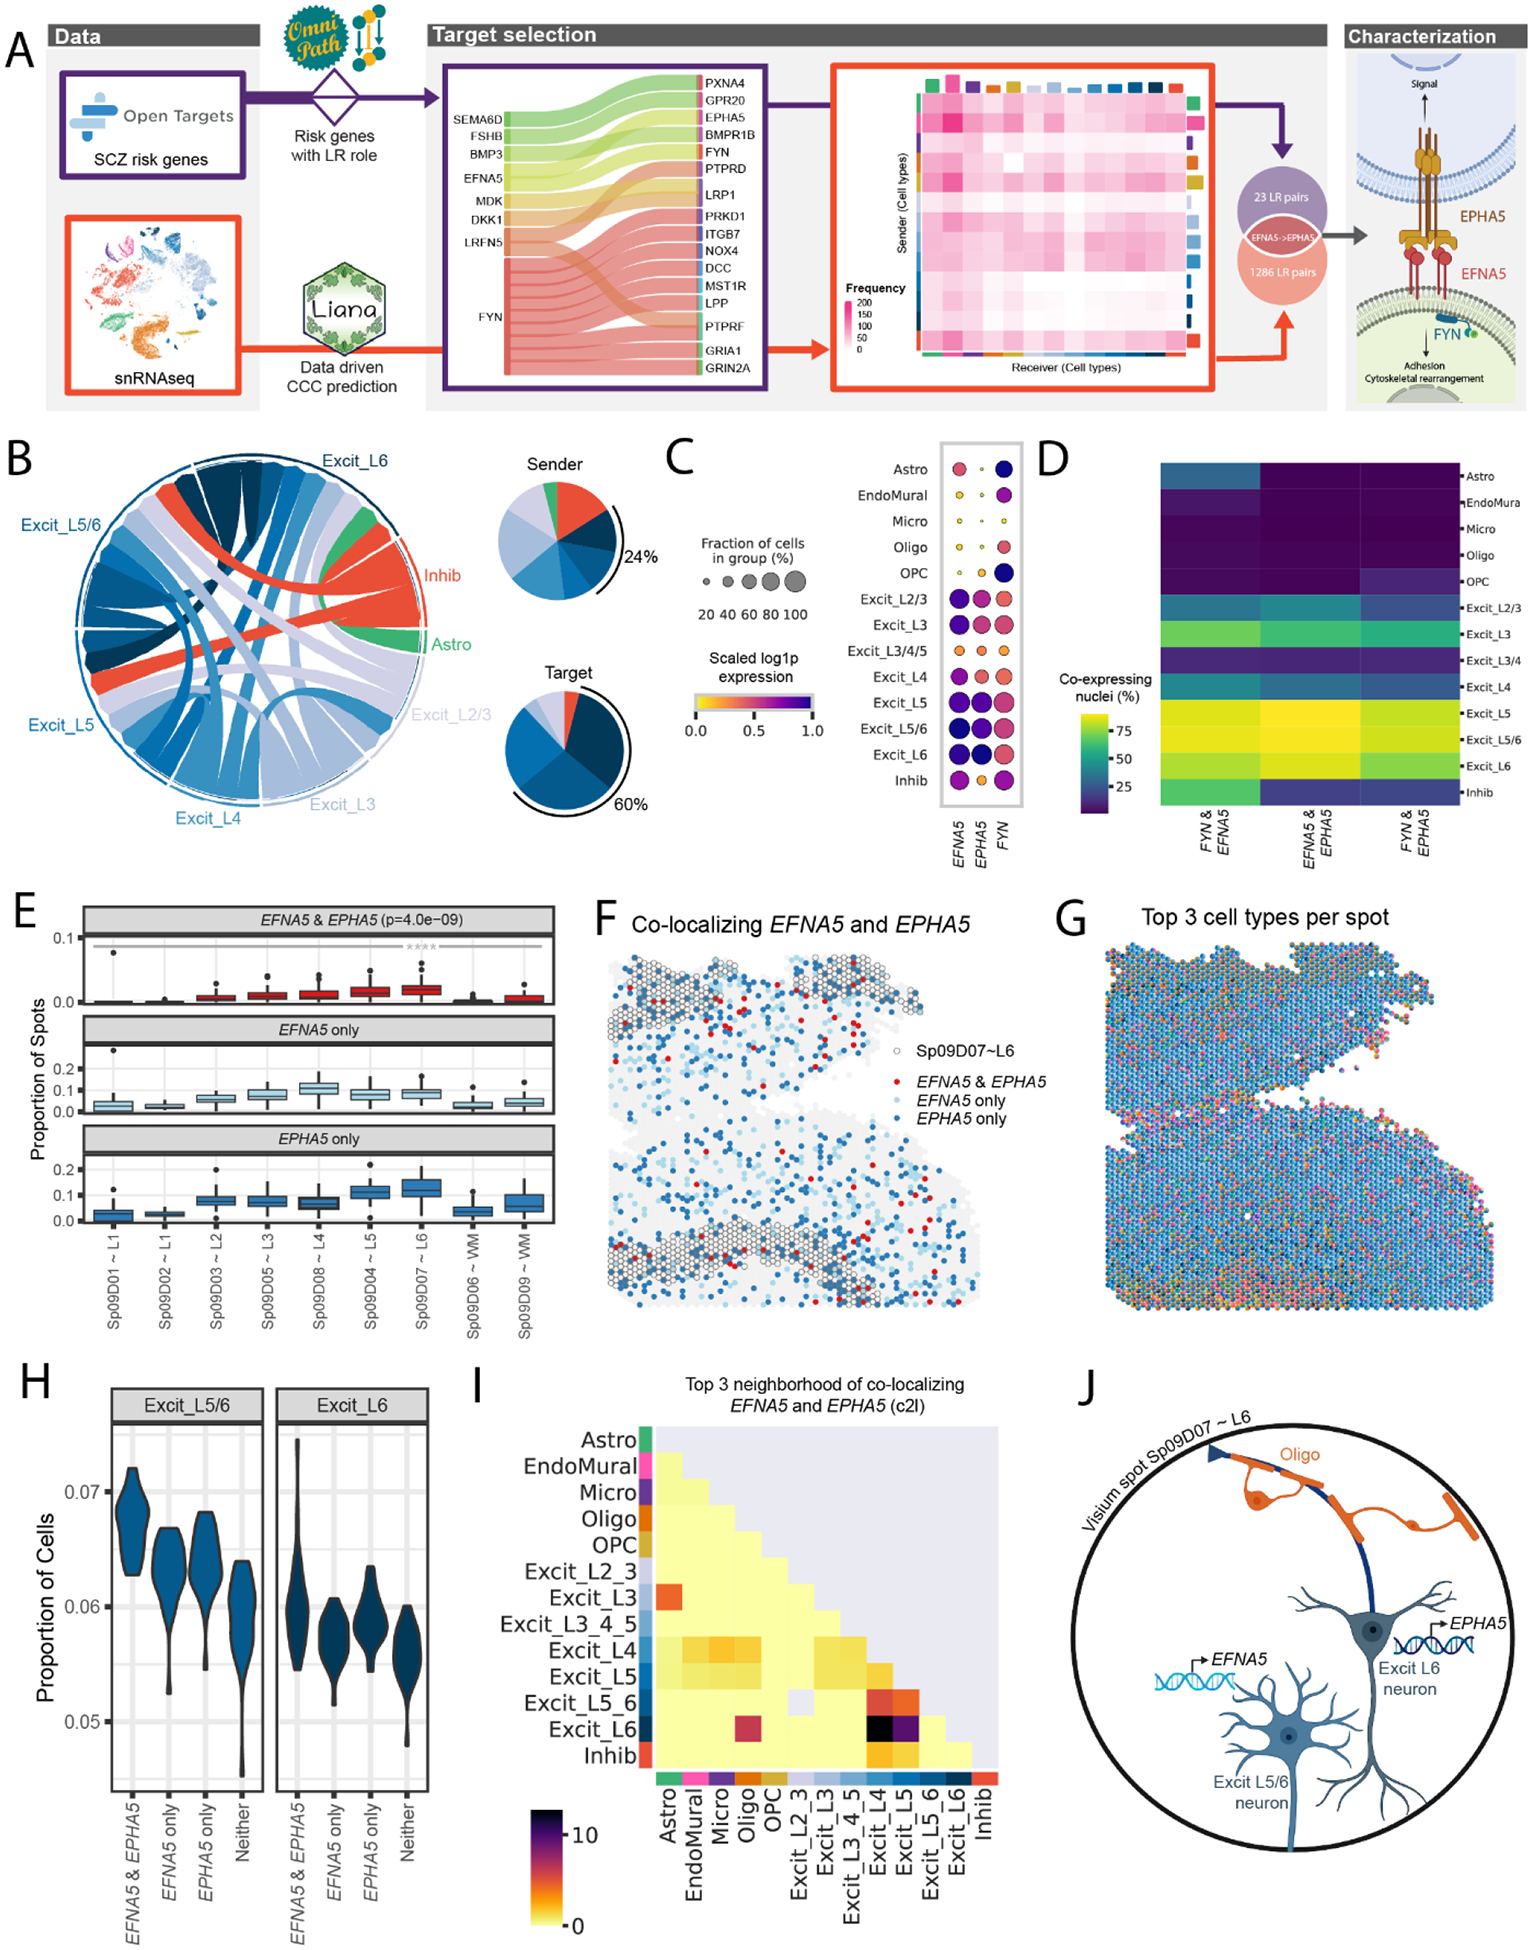
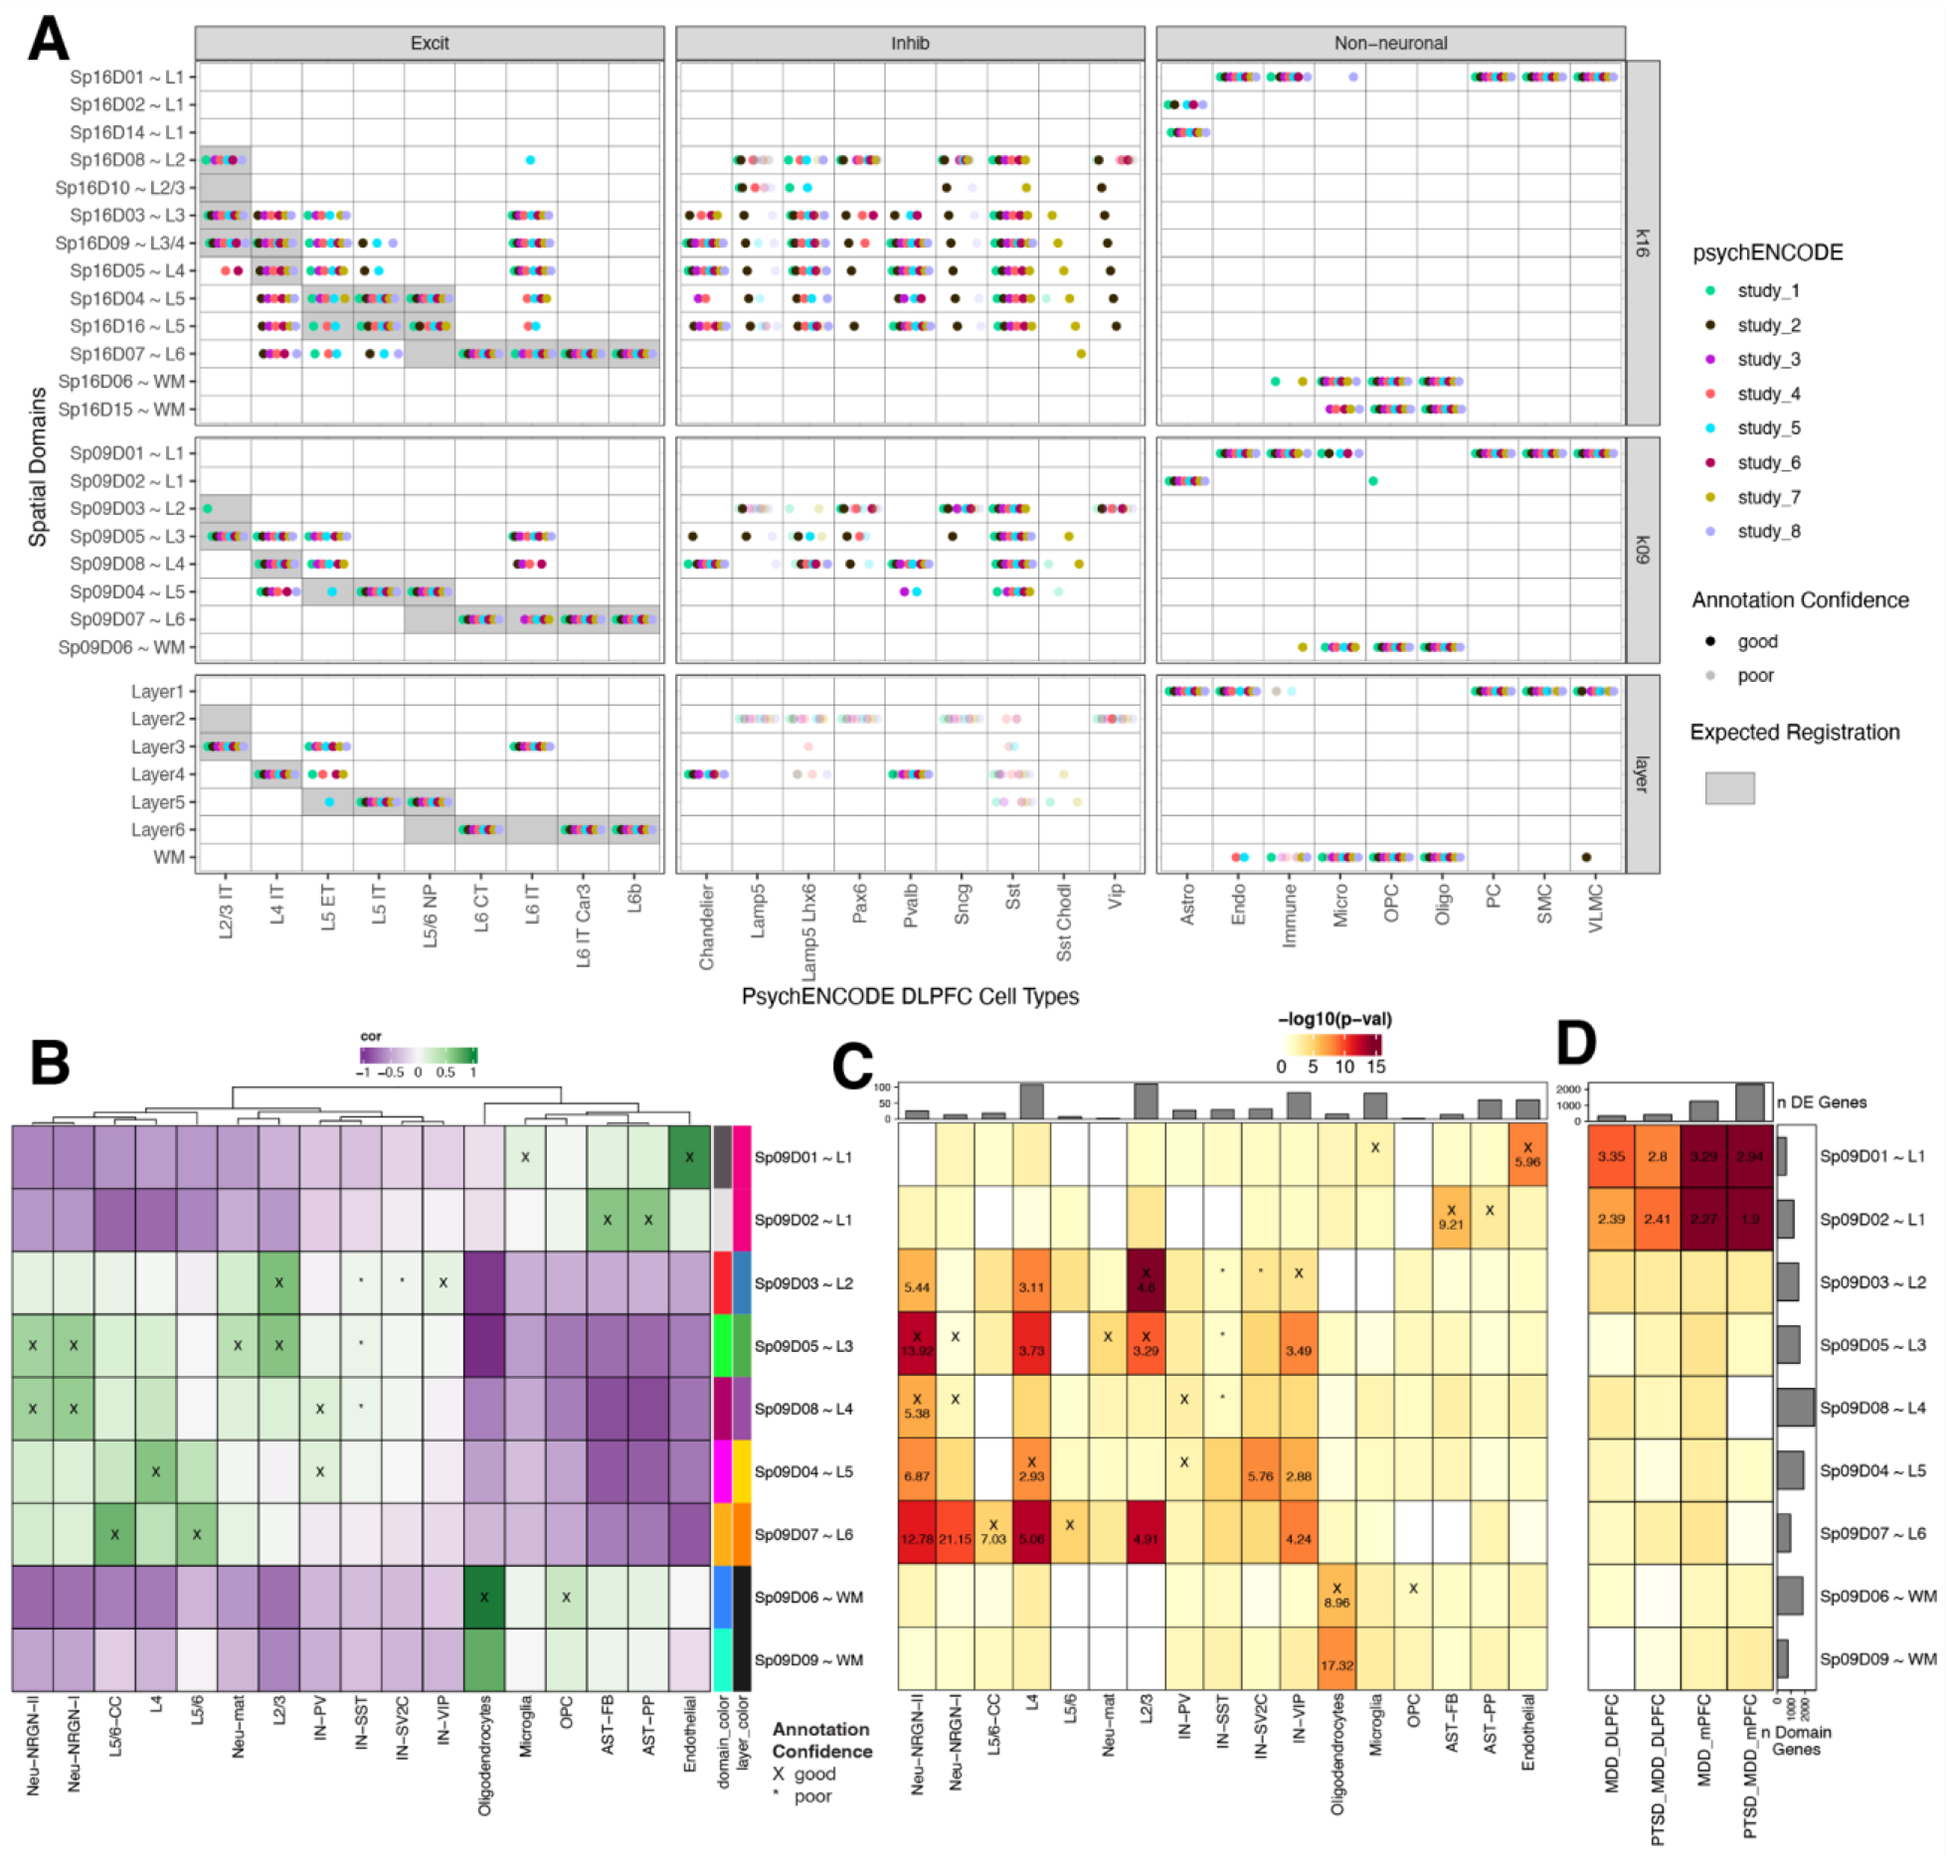
The molecular organization of the human neocortex historically has been studied in the context of its histological layers. However, emerging spatial transcriptomic technologies have enabled unbiased identification of transcriptionally defined spatial domains that move beyond classic cytoarchitecture. We used the Visium spatial gene expression platform to generate a data-driven molecular neuroanatomical atlas across the anterior-posterior axis of the human dorsolateral prefrontal cortex. Integration with paired single-nucleus RNA-sequencing data revealed distinct cell type compositions and cell-cell interactions across spatial domains. Using PsychENCODE and publicly available data, we mapped the enrichment of cell types and genes associated with neuropsychiatric disorders to discrete spatial domains.


Conflict of interest statement

Competing Interests

AB was a consultant for Third Rock Ventures and a shareholder in Alphabet, Inc. Joel E. Kleinman is a consultant on a Data Monitoring Committee for an antipsychotic drug trial for Merck & Co., Inc.

Figures

Figure 1.
Figure 1.. Study design to generate paired single nucleus RNA-sequencing (snRNA-seq) and spatially-resolved transcriptomic data across DLPFC.
(A) DLPFC tissue blocks were dissected across the rostral-caudal axis from 10 adult neurotypical control postmortem human brains, including anterior (Ant), middle (Mid), and posterior (Post) positions (n=3 blocks per donor, n=30 blocks total). The same tissue blocks were used for snRNA-seq (10x Genomics 3’ gene expression assay, n=1–2 blocks per donor, n=19 samples) and spatial transcriptomics (10x Genomics Visium spatial gene expression assay, n=3 blocks per donor, n=30 samples). (B) Paired snRNA-seq and Visium data were used to identify data-driven spatial domains (SpDs) and cell types, perform spot deconvolution, conduct cell-cell communication analyses, and spatially register companion PsychENCODE snRNA-seq DLPFC data. (C) t-distributed stochastic neighbor embedding (t-SNE) summarizing layer resolution cell types identified by snRNA-seq. (D) Tissue block orientation and morphology was confirmed by hematoxylin and eosin (H&E) staining and single molecule fluorescent in situ hybridization (smFISH) with RNAscope (SLC17A7 marking excitatory neurons in pink, MBP marking white matter (WM) in green, RELN marking layer (L)1 in yellow, and NR4A2 marking L6 in orange). Scale bar is 2mm. Spotplots depicting log transformed normalized expression (logcounts) of SNAP25, MBP, and PCP4 in the Visium data confirm the presence of gray matter, WM, and cortical layers, respectively (see also Fig S2–Fig S4). (E) Schematic of unsupervised SpD identification and registration using BayesSpace SpDs at k=7. Enrichment t-statistics computed on BayesSpace SpDs were correlated with manual histological layer annotations from (12) to map SpDs to known histological layers. The heatmap of correlation values summarizes the relationship between BayesSpace SpDs and classic histological layers. Higher confidence annotations (cor > 0.25, merge ratio = 0.1, see Methods: Spatial registration of Spatial Domains) are marked with an “X”.
Figure 2.
Figure 2.. Unsupervised clustering at different resolutions identifying spatial domains (SpDs) and defining molecular anatomy of DLPFC.
(A) BayesSpace clustering at k=9, 16, and 28 (broad, fine, and super-fine resolution, respectively, which we refer to as SpkDd for domain d from SpDs at k resolution) for three representative DLPFC tissue sections (Br8667_mid, Br6522_ant, Br6432_ant). (B) Heatmap of spatial registration with manually annotated histological layers from (12). BayesSpace identifies laminar SpDs at increasing k with the majority of SpkDs correlating with one or more histological layer(s). SpDs were assigned layer annotations following spatial registration to histological layers. Annotations with high confidence (cor > 0.25, merge ratio = 0.1, see Methods: Spatial registration of Spatial Domains) are marked with an “X”, and this histological layer association is denoted for a given SpkDd by adding “~L,” where L is the most strongly correlated histological layer (or WM). See also Fig S11–Fig S18. (C) Spotplots depicting expression of CLDN5 in vasculature domain 1 at k=9 resolution (Sp9D1). (D) Boxplot confirming enrichment of CLDN5 in Sp9D1 compared to other Sp9Ds across 30 tissue sections. (E) Spotplots of representative section Br6522_ant showing identification of molecularly-defined sublayers for histological L1 at k=16 (Sp16D2 and Sp16D14) and enrichment of HTRA1 and SPARC, respectively. (F) Boxplots quantifying enrichment of SPARC and HTRA1 in Sp16D14 and Sp16D2, respectively, across 30 tissue sections. (G) PCA plot showing separation of Sp16D2 and Sp16D14 supporting identification of molecularly distinct SpDs.
Figure 3.
Figure 3.. Spatial registration of fine resolution snRNA-seq clusters defining laminar cell types.
(A) t-distributed stochastic neighbor embedding (t-SNE) plot of 56,447 nuclei across 29 cell type-annotated fine resolution hierarchical clusters (hc; related to Fig S25A). (B) Spatial registration heatmap showing correlation between snRNA-seq hierarchical clusters (hc) and manually annotated histological layers from (12) as well as unsupervised BayesSpace clusters at k=9 and 16 (Sp9Ds and Sp16Ds). Hierarchical clusters for excitatory neurons (Excit) were assigned layer-level annotations following spatial registration to histological layers (cor > 0.25, merge ratio = 0.25, see Methods: snRNA-seq spatial registration). For Sp9Ds and Sp16Ds, annotations with good confidence (cor > 0.25, merge ratio = 0.1) are marked with “X” and poor confidence are marked with “*”. (C) Summary barplot of cell type composition for hc and layer level resolutions (related to Fig S25B & Fig S26) (D) Heatmap of the scaled mean pseudo-bulked logcounts for the top 10 marker genes identified for each cell type at layer-level resolution.
Figure 4.
Figure 4.. Integration of snRNA-seq and Visium data to benchmark spot deconvolution algorithms and define cellular composition across spatial domains.
(A) Schematic of the Visium-SPG protocol. (B) For Br6522_Ant_IF, counts for L5 marker gene PCP4 are compared to the proportion of Excit_L5 marker genes with nonzero expression as well as the counts of Excit_L5 cells as predicted by the 3 evaluated deconvolution algorithms. (C) Example of manually annotated layer assignments for Br6522_Ant_IF (i), which are used to benchmark predicted cell type composition across layers. Using Excit_L5 as an example, predicted Excit_L5 counts for each method are averaged across all spots within each annotated layer for each tissue section (ii). These data are summarized across layers and tissue sections for the 13 cell types using a bar plot (iii). An “X” or “O” is placed on the layer with maximal proportion; an “O” is placed for a “correct” match for the given cell type, and an “X” is placed otherwise. For example, Tangram correctly predicts the maximal proportion of Excit_L5 cells in L5 annotated spots, leading to the placement of an “O” for Excit_L5. The “O”s are tallied for each method to generate a summary score in each facet’s title (for example, 9 of 13 cell types were correctly predicted to the expected layer using Tangram). (D) Predicted counts for a given method, section, and layer-level cell type are collapsed and compared against the corresponding CART predictions by computing the Pearson correlation and RMSE, forming a single point in the scatterplot (Supplemental Methods: Evaluating performance of spot-deconvolution methods). Each of these values is then averaged to generate a single correlation and RMSE value for each method, indicated in the top left inside each plot facet. (E) Section-wide counts for each cell type are compared between broad and layer-level resolutions, collapsed onto the cell-type resolution used by the CART, where values theoretically should precisely match. (F) The predicted proportion of cells in each Sp9D, deconvoluted by Cell2location and Tangram, are averaged across all Visium samples (n=30). (G) Cell composition of each Visium spot for Br8667_mid, deconvoluted by Cell2location and Tangram, revealing differences in cell composition prediction.
Figure 5.
Figure 5.. Schizophrenia (SCZ)-associated ligand-receptor (LR) interactions identified by integrative analysis of snRNA-seq and Visium data.
(A) The LR interaction between membrane-bound ligand ephrin A5 (EFNA5) and ephrin type-A receptor 5 (EPHA5) is a consensus target identified in both data-driven (Table S3) and clinical risk-driven LR (Table S4) analyses. Notably, this interaction also requires an intracellular interaction between EFNA5 and protein tyrosine kinase (FYN), which was also identified among clinical risk targets. (B) Cell-cell communication analysis predicts the sender/receiver cross-talk pattern of EFNA5-EPHA5 between layer-level cell types visualized in a circular plot. Excit_L5/6 and Excit_L6 neurons account for 24% of the cross-talk as senders and 60% as targets compared to other cell types shown in the pie charts. (C-D) Downstream analysis of snRNA-seq data characterizes FYN-EFNA5-EPHA5 signaling pathway, showing these genes are highly enriched (C) and co-expressed (D) in excitatory neuron populations. (E) Across all 30 tissue sections, EFNA5 and EPHA5 are co-expressed in a statistically higher proportion of spots in Sp9D7 (median (interquartile range) = 0.0196 (0.0137), p = 4.0e-09) compared to other Sp9Ds (Sp9D1 = 0 (0), Sp9D2 = 0 (0), Sp9D3 = 0.0052 (0.0078), Sp9D4 = 0.0140 (0.0142), Sp9D5 = 0.0091 (0.0102), Sp9D6 = 0 (0.0016), Sp9D8 = 0.0077 (0.0123), Sp9D8 = 0.0016 (0.0104)). (F) Spotplot of EFNA5 and EPHA5 co-expression in Br8667_mid. (G) Spotplot with spot-level pie charts for Br8667_mid showing the top 3 dominant cell types in each Visium spot predicted by Cell2location (c2l). (H) Visium spots co-expressing EFNA5 and EPHA5 have higher proportions of predicted Excit_L5/6 neurons (p=1.8e-12) and Excit_L6 (p=3.9e-4) compared to non-coexpressing spots, consistent with snRNA-seq specificity analyses (Fig S42). Few other cell types show this relationship (Fig S43). Complementary analyses of EFNA5 and FYN co-expression are shown in Fig S42. (I) Spatial network analysis of all 30 tissue sections, using top 3 dominant c2l cell types in each spot (exemplified in G with Br8667_mid), confirms EFNA5 and EPHA5 co-expression occurs frequently in spots containing Excit_L6 neurons. Complementary analyses using top 6 dominant c2l cell types as well as Tangram predictions are reported in Fig S42. (J) Schematic of a Visium spot depicting EFNA5-EPHA5 interactions between Excit_L5/6 neurons and Excit_L6. The high colocalization score in the spatial network analysis in (I) suggests oligodendrocytes also likely co-exist with Excit_L6 neurons.
Figure 6.
Figure 6.. Spatial enrichment of cell types and genes associated with neurodevelopmental and neuropsychiatric disorders.
(A) Dot plot summarizing spatial registration results for eight PsychENCODE (PEC) snRNA-seq datasets from human DLPFC. snRNA-seq data was uniformly processed through the same pipeline and annotated with common nomenclature based on work from Allen Brain Institute (35, 69). Registration was performed for control donors only (see Fig S44 for full dataset) across manually annotated histological layers from (12) as well as unsupervised BayesSpace clusters at k=9 and k=16 (Sp9Ds and Sp16Ds, respectively). Each dot shows the histological layer(s) or SpD(s) where a dataset’s cell type was annotated during spatial registration. Solid dots show good confidence in the spatial annotation, translucent dots show poor confidence in the annotation. IT, intratelencephalon-projecting; ET, extratelencephalon-projecting; CT, corticothalamic-projecting; NP, near-projecting; VLMC, vascular lepotomeningeal cell; OPC, oligodendrocyte precursor cell; PC, pericyte; SMC, smooth muscle cell. (B) Spatial registration of cell type populations from control samples from (20) against unsupervised BayesSpace clusters at k=9 (Sp9Ds). Higher confidence annotations (cor > 0.25, merge ratio = 0.1, Supplemental Methods: Spatial registration of PsychENCODE and other external snRNA-seq datasets) are marked with an “X”. (C) Enrichment analysis using Fisher’s exact test for Sp9D- enriched statistics versus differentially expressed genes (DEGs, FDR < 0.05) in Autism spectrum disorder (ASD) for each cell type population. The values are the odds ratios (ORs) for the enrichment in significant (FDR < 0.001) blocks of the heatmap, and the color scale indicates −log10(p-value) for the enrichment test. The top bar plot shows the number of DEGs for each cell type. (D) Enrichment analysis using Fisher’s exact test for Sp9D- enriched statistics versus differentially expressed genes (DEGs, FDR < 0.05) in Post Traumatic Stress Disorder (PTSD) and/or Major Depressive Disorder (MDD) in bulk RNA-seq of DLPFC and medial prefrontal cortex (mPFC) (23). Top bar plot shows the number of DEGs for each DE test. Left bar plot shows the number of significantly enriched genes for each Sp9D in both enrichment analyses.

Update of

Similar articles

Cited by

References

    1. Madissoon E, Oliver AJ, Kleshchevnikov V, Wilbrey-Clark A, Polanski K, Richoz N, Ribeiro Orsi A, Mamanova L, Bolt L, Elmentaite R, Pett JP, Huang N, Xu C, He P, Dabrowska M, Pritchard S, Tuck L, Prigmore E, Perera S, Knights A, Meyer KB, A spatially resolved atlas of the human lung characterizes a gland-associated immune niche. Nat. Genet 55, 66–77 (2023). - PMC - PubMed
    1. Ortiz C, Navarro JF, Jurek A, Märtin A, Lundeberg J, Meletis K, Molecular atlas of the adult mouse brain. Sci. Adv 6, eabb3446 (2020). - PMC - PubMed
    1. Asp M, Giacomello S, Larsson L, Wu C, Fürth D, Qian X, Wärdell E, Custodio J, Reimegård J, Salmén F, Österholm C, Ståhl PL, Sundström E, Åkesson E, Bergmann O, Bienko M, Månsson-Broberg A, Nilsson M, Sylvén C, Lundeberg J, A Spatiotemporal Organ-Wide Gene Expression and Cell Atlas of the Developing Human Heart. Cell. 179, 1647–1660.e19 (2019). - PubMed
    1. Hildebrandt F, Andersson A, Saarenpää S, Larsson L, Van Hul N, Kanatani S, Masek J, Ellis E, Barragan A, Mollbrink A, Andersson ER, Lundeberg J, Ankarklev J, Spatial Transcriptomics to define transcriptional patterns of zonation and structural components in the mouse liver. Nat. Commun 12, 7046 (2021). - PMC - PubMed
    1. Di Bella DJ, Habibi E, Stickels RR, Scalia G, Brown J, Yadollahpour P, Yang SM, Abbate C, Biancalani T, Macosko EZ, Chen F, Regev A, Arlotta P, Molecular logic of cellular diversification in the mouse cerebral cortex. Nature. 595, 554–559 (2021). - PMC - PubMed

Publication types

Grants and funding