. 2024 May 24;384(6698):eadh0559.
doi: 10.1126/science.adh0559. Epub 2024 May 24.

Massively parallel characterization of regulatory elements in the developing human cortex

Collaborators, Affiliations

Massively parallel characterization of regulatory elements in the developing human cortex

Chengyu Deng et al. Science. .

Abstract

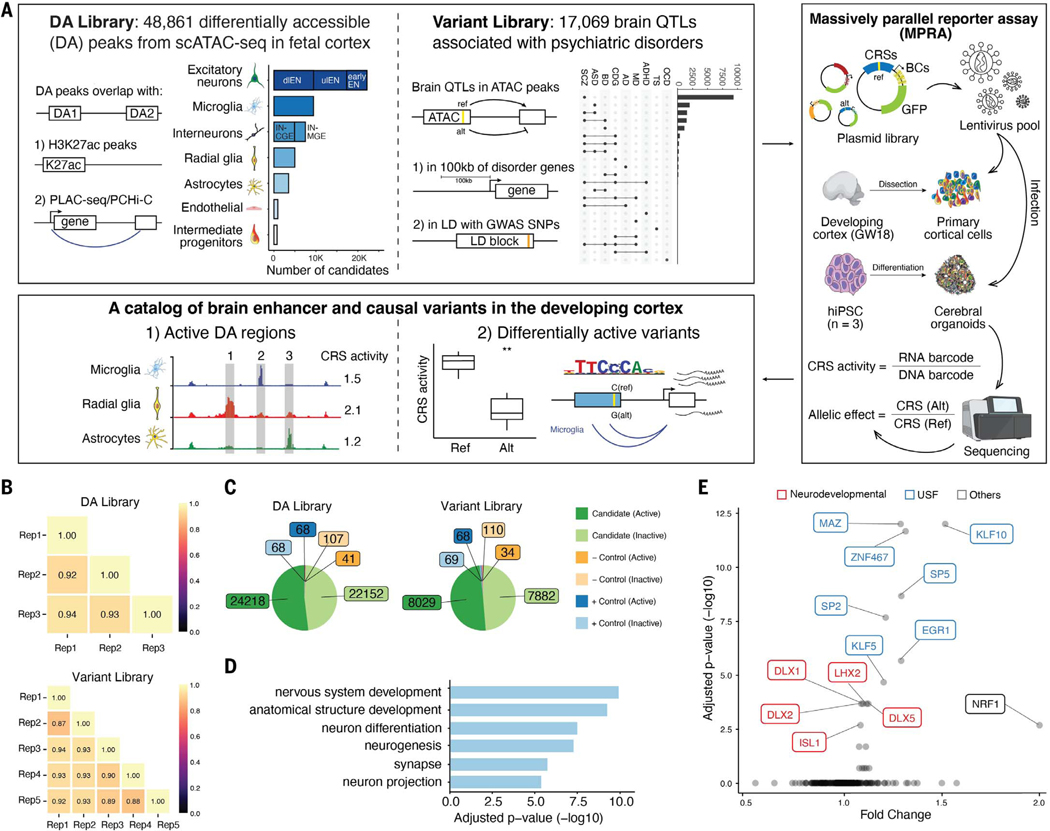
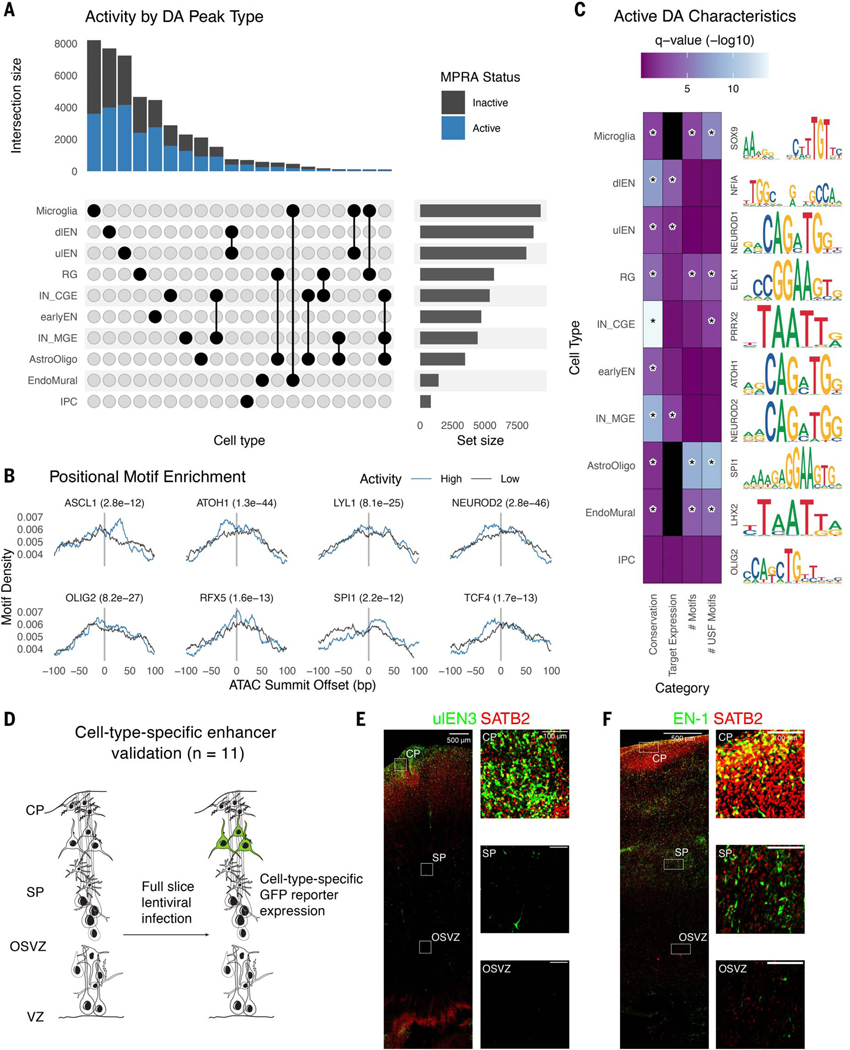
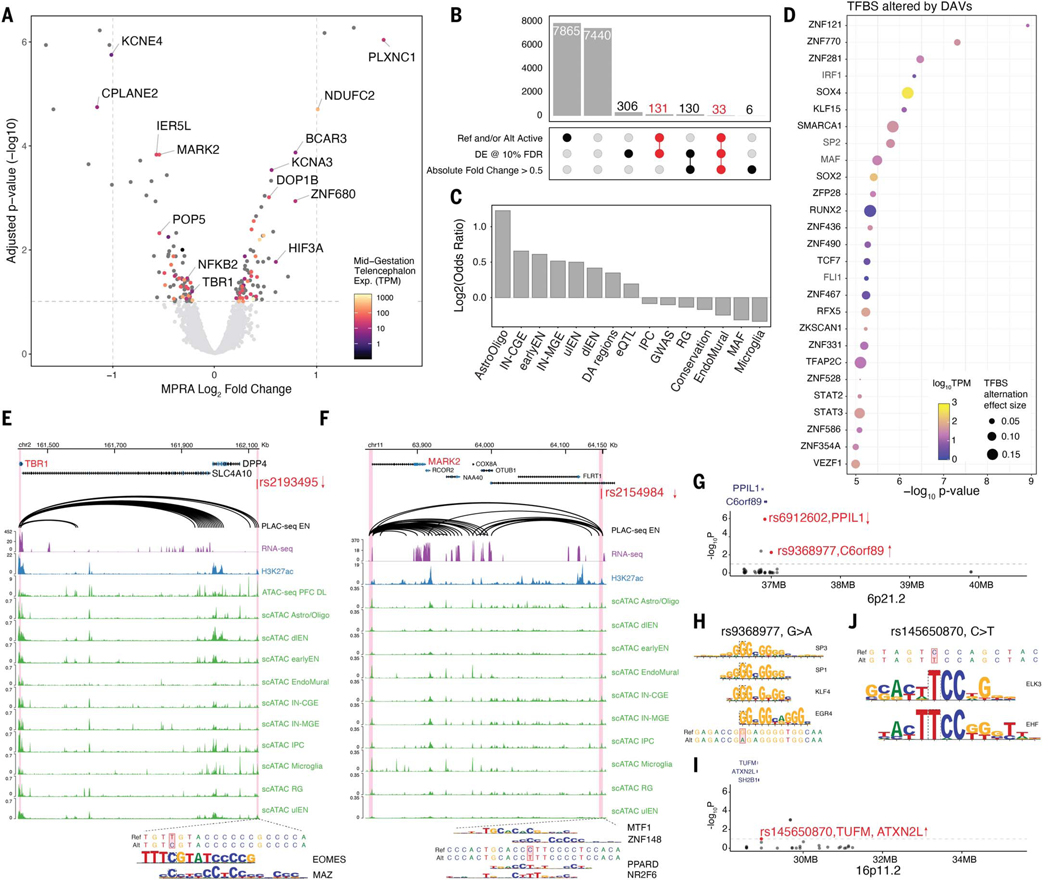
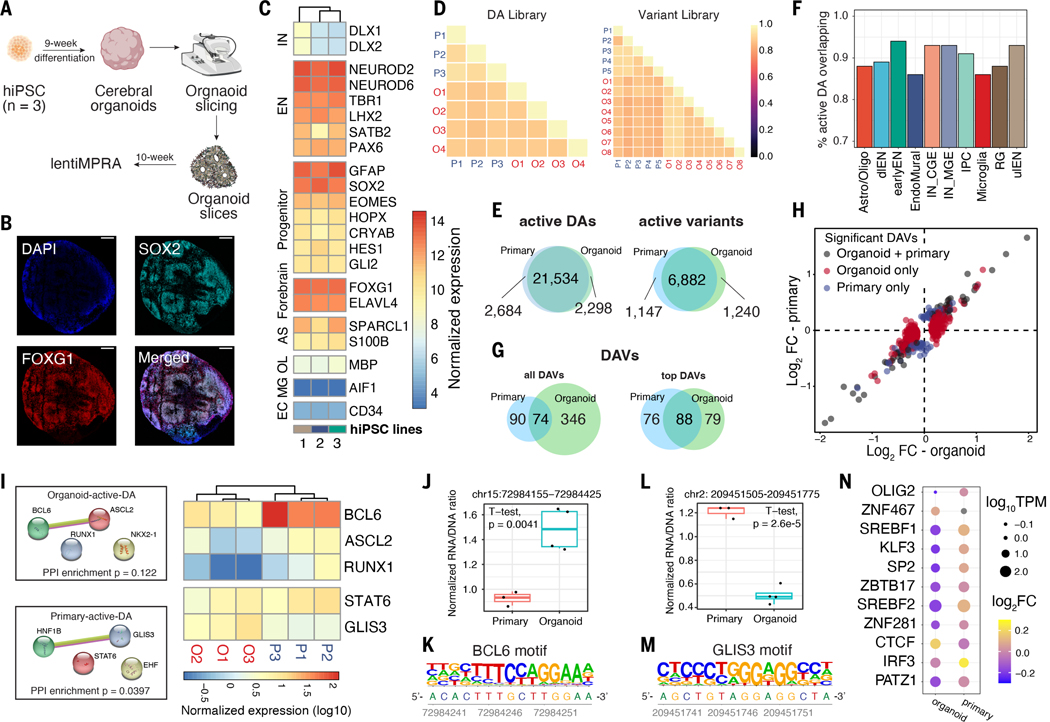
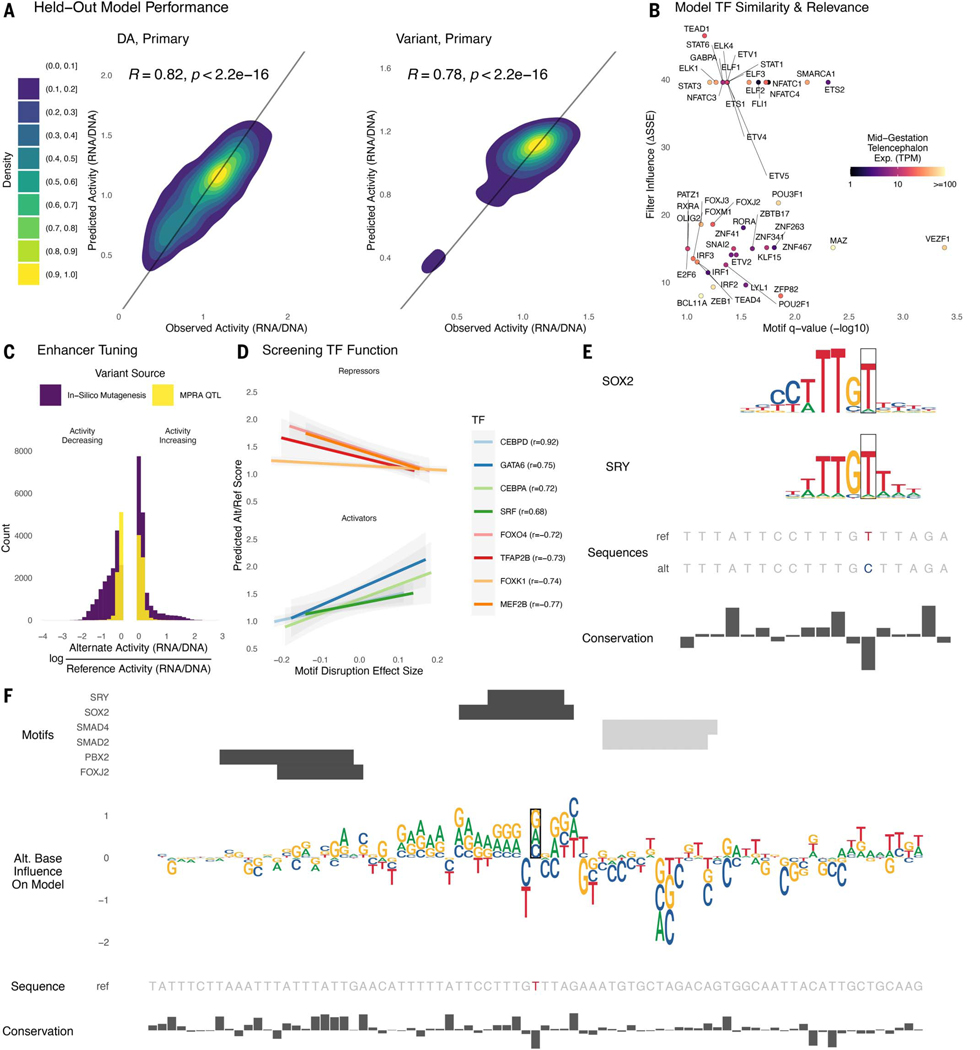
Nucleotide changes in gene regulatory elements are important determinants of neuronal development and diseases. Using massively parallel reporter assays in primary human cells from mid-gestation cortex and cerebral organoids, we interrogated the cis-regulatory activity of 102,767 open chromatin regions, including thousands of sequences with cell type-specific accessibility and variants associated with brain gene regulation. In primary cells, we identified 46,802 active enhancer sequences and 164 variants that alter enhancer activity. Activity was comparable in organoids and primary cells, suggesting that organoids provide an adequate model for the developing cortex. Using deep learning we decoded the sequence basis and upstream regulators of enhancer activity. This work establishes a comprehensive catalog of functional gene regulatory elements and variants in human neuronal development.


Conflict of interest statement

Competing interests: N.A. is the cofounder and on the scientific advisory board of Regel Therapeutics and receives funding from BioMarin Pharmaceutical Incorporated. All other authors declare that they have no competing interests.

Figures

Fig. 1.
Fig. 1.. Design and overall lentiMPRA results.
(A) Experimental overview of the two lentiMPRA libraries. The DA library contains 48,861 DA regions from scATAC-seq in the developing human cortex that overlap either H3K27ac peaks or PLAC-seq/PCHi-C loops. The number of DA candidates for each cell type is illustrated in the bar plot. dlEN, deep layer excitatory neuron; ulEN, upper layer excitatory neuron; IN-CGE, caudal ganglionic eminence–derived interneurons; IN-MGE, medial ganglionic eminence–derived interneurons. The variant library includes 17,069 brain QTLs that are within 100 kb of differentially expressed cross-disorder neurodevelopmental genes or in linkage disequilibrium (LD) with psychiatric disorder GWAS SNPs. The number of variants associated with each disorder is shown in the upset plot (largest 22 intersections shown). SCZ, schizophrenia; ASD, autism spectrum disorder; BD, bipolar disorder; CDG, congenital disorders of glycosylation; AD, Alzheimer’s disease; MD, major depression; ADHD, attention-deficit/hyperactivity disorder; TS, Tourette syndrome; OCD, obsessive-compulsive disorder. Both libraries were cloned into a lentiMPRA vector and packaged into lentivirus and used to infect primary cortical cells dissociated from GW18 tissues and human induced pluripotent cell (hiPSC)-derived cerebral organoids. Following infection, DNA and RNA were extracted and sequenced and an RNA/DNA barcode count ratio was calculated for each candidate regulatory sequence (CRS) allowing the identification of active DA regions and differentially active variants. (B) Correlation of log2(RNA/DNA) between technical replicates in primary cortical cells for the DA and variant library, respectively. (C) Pie charts showing the number of active and inactive sequences for candidates, positive (+) and negative (−) controls in both libraries. (D) Top enriched GO terms from the “biological process”, “ cellular component”, and “molecular function” ontologies for nearest genes of the highest activity sequences (both libraries combined). Closest genes of the lowest activity sequences were used as the background set. The complete list of GO terms is available in fig. S2B. (E) TF motif enrichment analysis for highest activity sequences (both libraries). Red, neurodevelopmental TFs, Blue, USFs.
Fig. 2.
Fig. 2.. Identification and validation of functional differentially accessible regions in the developing cortex.
(A) Upset plot showing the number of DA peaks (active, blue; inactive, gray) for each cell type or combination of cell types. (B) The highest activity DA sequences have positional motif enrichment for neurodevelopmental TFs compared with the lowest activity sequences, exhibiting significantly more motif matches slightly up- or downstream of the ATAC-seq peak summit. (C) Active DA sequences have significantly higher means across several attributes compared with inactive DA sequences (color scale is as follows: Wilcoxon test false discovery rate (FDR) adjusted P-values, black indicates no data) including evolutionary conservation (phyloP), expression of PLAC-seq linked target genes in matched cell types, total number of strong motif matches (q-value < 0.01), and total number of strong USF motif matches. A representative motif enriched in active DA peaks for each cell type is shown on the right. Statistically significant comparisons (q-value < 0.05) are indicated by a star. (D) Experimental strategy for validating cell type specificity of active DA sequences. (E and F) Developing human cortex slice cultures transduced with a GFP lentivirus reporter driven by a ulEN-specific enhancer (chr5:89274678–89274948, hg38) (E) and a pan-excitatory neuron specific enhancer (chr2:165141999–165142269, hg38) (F). Expression of GFP (green) and SATB2 (red) was visualized through immunohistochemistry staining and insets show colocalization of GFP+ along with SATB2+ cells in different layers.
Fig. 3.
Fig. 3.. Identification of differentially active variants associated with psychiatric disorders.
(A) Volcano plot showing log2 fold change and −log10 FDR adjusted P-value for variants that have enhancer activity from at least one allele. Significant variants (FDR < 0.1) were annotated with the PLAC-seq predicted target gene name and color-coded based on target gene expression in mid-gestation telencephalon. Two vertical dashed lines indicate the absolute log2FC of 1. The horizontal dashed line indicates FDR at 10%. (B) Upset plot showing the number of variants (bar) passing combinations of different thresholds (dots and lines below bar). The number of DAVs was highlighted in red. (C) Enrichment log2 odds ratio of DAVs overlapping different features, including combined or separate cell type–specific DA regions, adult brain eQTL, GWAS of various psychiatric disorders and low-frequency variants with minor allele frequency (MAF) less than 0.01. (D) TFBSs predicted to be altered by DAVs using motifbreakR. Dot color represents TF expression in primary cortical cells, size represents predicted magnitude of binding affinity alternation. TFs were ranked by TFBS alternation significance (motifbreakR −log10 P-value, y-axis). (E and F) Genomic browser tracks showing examples of causal regulatory variants and their predicted target genes. The top track shows PLAC-seq chromatin loops in EN (27), the second track shows bulk RNA-seq in primary cortical cells, the third track shows bulk H3K27ac ChIP-seq (26), followed by a track of bulk ATAC-seq in deep-layer cortex (26). The bottom ten tracks show scATAC-seq in the human cortex (11). DAV rs2193495 (E), located in a dlEN-specific accessible region, potentially down-regulates TBR1 expression due to the introduction of EOMES and MAZ binding sites. DAV rs2154984 (F) is predicted to regulate MARK2 expression and disrupt MTF1 and ZNF148 and introduce PPARD and NR2F6 binding sites. (G) Manhattan plot of SCZ-associated chromosome band 6p21.2 showing the 38 variants tested. The y-axis shows −log10 of adjusted P-value from MPRA. DAVs are highlighted in red and annotated with their predicted target gene. Arrows indicate the direction of allele effect observed in MPRA. (H) DAV rs9368977 located in 6p21.2 is predicted to disrupt binding of SP3, SP1, KLF4, and EGR4. (I) Manhattan plot of ASD-associated chromosome band 16p11.2 showing the 25 variants tested. The y-axis shows -log10 of adjusted P-value from MPRA. DAVs are highlighted in red and annotated with predicted target genes. The arrow indicates the direction of allele effect observed in MPRA. (J) TFBS altered in rs145650870. The alternative allele favors the binding of EHF and ELK3.
Fig. 4.
Fig. 4.. Comparison of lentiMPRA results in cerebral organoids and primary cortical cells.
(A) Schematic of the experimental workflow. (B) Microscopic images of 10-week-old organoid slices immunostained for SOX2 (Cyan), FOXG1 (Red), and DAPI. Scale bar, 200 μm. (C) Normalized transcript count of marker genes in organoids derived from 3 hiPSC lines (1 = 21792A, 2 = 1323_4, 3 = 20961B). (D) Correlation of log2(RNA/DNA) between replicates in organoids and primary cortical cells for DA library (left) and variant library (right). (E) Venn diagrams showing the overlap between organoids and primary cells. (Left) overlap of active DA regions; (right) overlap of active variants. (F) The proportion of active DAs in organoids that are also active in primary cells. (G) Overlap of DAVs. “Top DAVs” were identified using shuffled sequences to define active and applying a cutoff for absolute log2FC of 0.3. (H) lentiMPRA log2FC in organoid (x-axis) and primary cells (y-axis). The scatter plot includes variants identified as DAVs in both organoids and primary cells (gray), variants detected as DAVs only in organoids (red), and variants detected as DAV only in primary cells (blue). (I) (Left) Protein-protein interactions (PPI) of enriched TFBS motifs in active DAs specific to organoids or primary cells. PPI network generated using STRING (77) database. (Right) heatmap showing the normalized transcript count of enriched TFs from bulk RNA-seq data. TFs not expressed (TPM < 1) in all replicates were removed from the heatmap. (J and K) A DAV (chr15:72984155–72984425, hg38) that contains a BCL6 motif showed increased activity in organoids versus primary cells (J) and its reference sequence contains a BCL6 motif (K). (L and M) A DA region (chr2: 209451505–209451775, hg38) with GLIS3 binding motif showing increased MPRA activity in primary cells versus organoids (L) and the location of the GLIS3 motif in its reference sequence shown below (M). (N) TFBSs altered by DAVs that show an opposite direction of allelic effect between organoids and primary cells. Dot sizes represent normalized TF expression; color represents log2FC.
Fig. 5.
Fig. 5.. Sequence determinants of lentiMPRA activity can be modeled with deep learning.
For each library, we trained a deep learning model to predict lentiMPRA activity in primary cells from sequence alone. (A) Sequences on chromosome 4 were held out from model training and used to evaluate model performance. Predicted and measured activity have high Pearson correlation for the DA library (left) and variant library (right). (B) The model learned motifs of neurodevelopmental TFs and used them for accurate predictions. Predictive importance of convolutional filters (change in sum of squared errors when fixing filter output to zero) is plotted against significance of matches to HOCOMOCO motifs (TOMTOM q-value < 0.1) for TFs expressed in developing telencephalon (mean CPM > 1). (C) Applying ISM to the variant library, we found that the activity of most enhancers can be tuned up and down through introduction of alternative alleles. The largest activity-increasing and activity-decreasing alleles for each sequence (purple) tend to have bigger effects than the lentiMPRA measured effects for QTLs (yellow). (D) We combined ISM with motifbreakR TFBS disruption scores to screen TFs for repressor versus activator function in neurodevelopment, using the most activity-changing alternative allele for each sequence in the variant library. TFs where predicted activity is anti-correlated with motif score tend to repress expression (top) and those with a positive correlation tend to be known activators (bottom). This relationship can be used to decode whether the model has learned an activator versus repressor role for TFs that function in both ways. (E) The reference T allele of eQTL rs2883420 (lentiMPRA RNA/DNA 0.8) matches motifs of repressors SRY and SOX2, whereas the alternate C allele disrupts a high information content position in both motifs, resulting in a large activity increase (lentiMPRA RNA/DNA = 0.97, predicted RNA/DNA = 0.96). (F) ISM predicts that the other two possible alleles at rs2883420 also increase activity (middle, sequence logo indicates magnitude and direction: up = increasing, down = decreasing). Alternative alleles at adjacent nucleotides overlapping TF motifs (top, positive strand = black, negative strand = gray) have even larger predicted effects on activity. Region shown is chr10:86,851,230–86,851,500 (hg38).

Update of

Similar articles

Cited by

References

    1. Kessler RC et al., Lifetime prevalence and age-of-onset distributions of mental disorders in the World Health Organization’s World Mental Health Survey Initiative. World Psychiatry 6, 168–176 (2007). pmid: 18188442 - PMC - PubMed
    1. Sullivan PF, Geschwind DH, Defining the Genetic, Genomic, Cellular, and Diagnostic Architectures of Psychiatric Disorders. Cell 177, 162–183 (2019). doi: 10.1016/j.cell.2019.01.015; pmid: 30901538 - DOI - PMC - PubMed
    1. Bakken TE et al., A comprehensive transcriptional map of primate brain development. Nature 535, 367–375 (2016). doi: 10.1038/nature18637; pmid: 27409810 - DOI - PMC - PubMed
    1. Iossifov I et al., The contribution of de novo coding mutations to autism spectrum disorder. Nature 515, 216–221 (2014). doi: 10.1038/nature13908; pmid: 25363768 - DOI - PMC - PubMed
    1. Satterstrom FK et al., iPSYCH-Broad Consortium, Large-Scale Exome Sequencing Study Implicates Both Developmental and Functional Changes in the Neurobiology of Autism. Cell 180, 568–584.e23 (2020). doi: 10.1016/j.cell.2019.12.036; pmid: 31981491 - DOI - PMC - PubMed

Grants and funding

LinkOut - more resources