. 2024 May 24;384(6698):eadh3707.
doi: 10.1126/science.adh3707. Epub 2024 May 24.

Systems biology dissection of PTSD and MDD across brain regions, cell types, and blood

Nikolaos P Daskalakis  1   2   3 Artemis Iatrou #  1   2   3 Chris Chatzinakos #  1   3   4   5 Aarti Jajoo #  1   2   3 Clara Snijders #  1   2   3 Dennis Wylie #  6 Christopher P DiPietro #  1   3 Ioulia Tsatsani #  1   2   3   7 Chia-Yen Chen #  8 Cameron D Pernia #  1   2   3 Marina Soliva-Estruch #  1   2   3   7 Dhivya Arasappan #  6 Rahul A Bharadwaj #  9 Leonardo Collado-Torres #  9 Stefan Wuchty #  10   11 Victor E Alvarez #  12   13   14 Eric B Dammer #  15 Amy Deep-Soboslay #  9 Duc M Duong #  15 Nick Eagles #  9 Bertrand R Huber #  12   14 Louise Huuki #  9 Vincent L Holstein #  1   2   3 Mark W Logue #  16   17   18   19 Justina F Lugenbühl #  1   2   3   7 Adam X Maihofer #  20   21   22 Mark W Miller #  16   17 Caroline M Nievergelt #  20   21   22 Geo Pertea #  9 Deanna Ross #  23 Mohammad S E Sendi #  1   2   3 Benjamin B Sun #  8 Ran Tao #  9 James Tooke #  9 Erika J Wolf #  16   17 Zane Zeier #  24 PTSD Working Group of Psychiatric Genomics Consortium**Sabina Berretta  1   2   3 Frances A Champagne  23 Thomas Hyde  9   25   26 Nicholas T Seyfried  15 Joo Heon Shin  9   26 Daniel R Weinberger  9   25   26   27   28 Charles B Nemeroff #  23   29 Joel E Kleinman #  9   25 Kerry J Ressler #  1   2 PTSD Working Group of Psychiatric Genomics Consortium
Collaborators, Affiliations

Systems biology dissection of PTSD and MDD across brain regions, cell types, and blood

Nikolaos P Daskalakis et al. Science. .

Abstract

The molecular pathology of stress-related disorders remains elusive. Our brain multiregion, multiomic study of posttraumatic stress disorder (PTSD) and major depressive disorder (MDD) included the central nucleus of the amygdala, hippocampal dentate gyrus, and medial prefrontal cortex (mPFC). Genes and exons within the mPFC carried most disease signals replicated across two independent cohorts. Pathways pointed to immune function, neuronal and synaptic regulation, and stress hormones. Multiomic factor and gene network analyses provided the underlying genomic structure. Single nucleus RNA sequencing in dorsolateral PFC revealed dysregulated (stress-related) signals in neuronal and non-neuronal cell types. Analyses of brain-blood intersections in >50,000 UK Biobank participants were conducted along with fine-mapping of the results of PTSD and MDD genome-wide association studies to distinguish risk from disease processes. Our data suggest shared and distinct molecular pathology in both disorders and propose potential therapeutic targets and biomarkers.


Conflict of interest statement

Within the past 2 years: N.P.D. is on the scientific advisory boards for BioVie Inc., Circular Genomics, Inc. and Feel Therapeutics, Inc. And for unrelated work; D.R.W. is on the advisory boards of Pasithea Therapeutics and Sage Therapeutics for unrelated work; D.D. is a cofounder of ARC Proteomics, and cofounder and paid consultant of Emtherapro Inc.; C-Y.C. is an employee of Biogen Inc.; M.S.E.S. receives consulting fees for unrelated work from Niji Corp for unrelated workl B.B.S. is an employee and stockholder of Biogen Inc.; K.J.R. has received consulting income from Alkermes and sponsored research support from Brainsway and Takeda, and is on the scientific advisory boards for Janssen, Verily, and Resilience Therapeutics for unrelated work. All other authors declare no competing interests.

Figures

Fig. 1.
Fig. 1.. Overall study design.
We generated a large multi-omic postmortem database of PTSD (n=77) and MDD (n=77), compared to NCs (n=77) over two discovery cohorts (Disc.1 and Disc.2). Three brain regions (mPFC, DG, CeA) were assessed for bulk RNA expression (of genes, exons, exon-exon junctions, and transcripts), DNA methylation (CpGs and regions) and protein expression (proteins and peptides). Primary analyses included differential transcriptomic, methylomic, proteomic disease-specific interrogation, followed by pathway, multi-omic factor, and gene co-expression network analyses and identification of top genes. Sub-analyses were performed within traits (i.e., biological sex, childhood trauma, suicide completion), across traits (PTSD-or-MDD vs. NC) and between traits (PTSD vs. MDD) to assess contributing factors, disease-specificity, and overlap. For replication, we (1) generated a new dataset of 73 samples (Rep.1), re-analyzed data from prior studies (Rep.2) consisting of 41 additional samples, and (2) conducted meta-analysis of these two independent cohorts (nmeta-analysis = 114). In parallel, we (1) acquired two snRNA-seq datasets (Sc.1, n=47, Sc.2, n=71) from dlPFC to explore disease-associated cell-type-specific transcriptomic signatures by conducting meta-analysis across batches (nmeta-analysis = 118), (2) assessed the plasma protein-based biomarker potential in >50,000 subjects of the UKBB, and (3) fine-mapped the PTSD and MDD risk loci using GWAS datasets and investigated the overlap of GWAS-based risk genes and pathways with disease process genes. The extensive generated data enabled us to identify genes significantly involved in both disorders.
Fig. 2.
Fig. 2.. Transcriptomic, methylomic, and proteomic analyses of PTSD in three brain regions.
(A-C) Plots of the meta-analysis of 231 subjects in mPFC, DG and CeA. (A, C) Volcano plots of differentially regulated transcriptomic (A) and proteomic features (C). Colored dots denote nominally significant genes (P < 0.05), with the darker ones passing an FDR 5% level. Five features with the lowest P in each direction and the replicated ones are named. (B) Manhattan plots of the CpGs interrogated for differential methylation (x-axis; genomic location, y-axis; −log10P). DMPs passing FDR-adjusted P < 0.05 are denoted in purple. CpGs that belong to a DMR (>2 CpGs, Šidák P < 0.05) are red, and within those the CpGs with FDR-adjusted P < 0.05 are green. (D) Scatterplot denoting the number of distinct genes corresponding to FDR-significant features (size coded) per feature-type per brain region. The percentage of FDR-adjusted features over the N of features is labeled next to the respective point. (E) Boxplot of ρ corresponding to correlations of DGE effect sizes (log2FC or beta) in discovery meta-analysis (“Disc”) and Rep.1 cohort analysis (“Rep”) across brain regions. Three significance thresholds were used: “genome-wide” (no threshold), considering all features, “nom Disc”, considering only nominally significant (P < 0.05) features in Disc, and “nom Disc+Rep”, considering overlapping nominally significant features in Disc and Rep. (F) Lollipop plots of the number of replicated features per omic with their respective gene/protein annotations and direction of effect (upward black arrowheads: increased; downward black arrowheads: decreased). (G) Left panel: Multi-region boxplots depicting the range of ρ corresponding to correlations of DGE effect sizes between PTSD differential analyses of each brain region for each feature. Middle panel: Boxplots depicting the range of ρ between PTSD differential analyses results with results from sub-analyses including sex-specificity, childhood trauma and suicide completion, across brain regions. Right panel: Boxplots of ρ between PTSD differential analyses results with results from MDD primary analysis, and PTSD-or-MDD and PTSD vs. MDD sub-analyses. In D-G, colors denote different omic features and shape different brain regions. In E and G, horizontal dotted lines denote minimal (ρ<0.1), moderate (0.3<ρ<0.6) and high (ρ>0.6) correlation.
Fig. 3.
Fig. 3.. Transcriptomic, methylomic, and proteomic analyses of MDD in three brain regions.
See legend of Fig. 2 for detailed description. (A, C) Volcano plots of differentially regulated transcriptomic (A) and proteomic features (C). (B) Manhattan plots of CpGs with genomic loci on the x axis and −log10P on the y-axis. red: Sidak P significant DMRs, purple: FDR-significant DMPs, green: DMPs within DMRs. (C) Volcano plots of proteomic feature DE. (D) Scatterplot denoting the number of distinct genes corresponding to FDR-significant features (size coded) per feature-type per brain region, with the respective percentage labeled. (E) Boxplot of correlation coefficient ρ of DGE effect sizes (log2FC or beta) in discovery meta-analysis (“Disc”) and Rep.1 cohort analysis (“Rep”) across brain regions anf three significance thresholds. (F) Lollipop plots of the number of replicated features per omic with their respective gene/protein annotations and direction of effect (upward arrowheads: increased; downward arrowheads: decreased). (G) Left panel: Boxplots of correlation coefficient ρ of DGE effect sizes between MDD analyses of each brain region for each feature. Middle panel: Boxplots depicting the range of ρ between MDD primary analyses with sub-analyses across brain regions. Right panel: Boxplots of ρ between MDD differential analyses results with results from PTSD primary analysis, and PTSD-or-MDD and PTSD vs. MDD sub-analyses. In D-G, colors denote different omic features and shape different brain regions. In E and G, horizontal dotted lines denote minimal (ρ<0.1), moderate (0.3<ρ<0.6) and high (ρ>0.6) correlation.
Fig. 4.
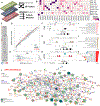
Fig. 4.. Gene, protein, and methylation set enrichment analysis across brain regions and disorders.
(A) Heatmap depicting −log10 rank of transcriptomic-, proteomic- and methylomic-based pathways in each brain region across disorders (18 analyses). Within each analysis, pathway rank is calculated based on FDR-adjusted P. The 5 most significant pathways per analysis are shown here. GO categories include biological processes (BP), cellular components (CC) and molecular functions (MF). Upward arrows: positive NES, downward arrows: negative NES, circles: methylation-related entries (direction unknown). The full name of third pathway from the top is “Adaptive immune response based on somatic recombination of immune receptors built from immunoglobulin superfamily domains”. (B-D) Boxplots depicting the range of ρ values corresponding to correlations between omics (B), regions (C) or traits (D). (E-F) Bubble plot CP enrichment in the DEGs (blue-green outline) and DEPs (red outline) in PTSD (E) and MDD (F). A pathway can belong to multiple categories. Points are sized based on −log10 (FDR-adjusted P). Shape fill denotes z-scores. The most significant pathways are labeled. In E, an * is used to facilitate the annotation of STAT3 pathway and # for HMGB1 signaling. (G) Heatmap of URs enriched in DEGs per brain region in both traits. Significant URs (FDR-adjusted P < 0.05) were ranked based on z-scores and the first 50 URs for each disorder were selected. The exogenous chemicals and drugs categories were excluded from plotting. Grey color: non-existent data. UR categories are shown on top. PTSD DG did not have URs. Abbreviations of non-gene terms: LPS, lipopolysaccharide; E2, beta-estradiol; Ig, immunoglobulin. (H) Heatmap of the TF binding enrichment (−log10 FET P). Not all modalities showed significant enrichments; # and *: FDR-adjusted P < 0.05.
Fig. 5.
Fig. 5.. Multi-omic integration.
(A) Nine (3×3) views provided by transcriptomic (T-), methylomic (M-), and proteomic (P-) profiles of each brain region were integrated into thirty latent factors using MOFA. We used the same input to additionally create co-expression modules for each omic across brain region using WGCNA. (B) Heatmap of variance explained in each of the nine views by each MOFA factor. (C) Coefficients (ρ) of correlation of MOFA factors scores with age at death. (D) Scatterplot of MOFA factor 13 scores (y-axis) with age at death (x-axis). LOESS-smoothed trendlines are fitted within diagnosis group. (E) Box-and-whisker plots of MOFA factor 14 scores by diagnostic group: data are represented as median ± 1.5 interquartile range (IQR). Individual factor 14 scores are indicated by vertical line markers. In D-E, gray color is used for NCs, blue-green for MDD, and red for PTSD. (F-H) For 3 transcriptomic and/or proteomic features per brain region, the enrichment of the respective differentially expressed (DE) features from the PTSD and MDD analyses as well as of the top PTSD and MDD genes (top genes) is depicted (F: CeA, G: DG, H: mPFC). The x-axis represents the enrichment significance (−log10 P), the size of the point denotes the number of features enriched and the shape the gene set under interrogation in each analysis (DE: circle, top genes: triangle). (I-K) The 10 most significant GO terms (color-coded) associated with the CeA-pink (I), DG-tan (J) and mPFC-red (K) modules. (L) PPI network of the mPFC-red module. The nodes are filled in green if the protein is a PTSD and/or MDD top gene, and the shape of the node indicates whether it is a hub gene (diamond). DEX genes are annotated in purple. Ten GO terms are shown as partially filled donuts around each node according to (K).
Fig. 6.
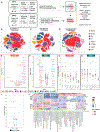
Fig. 6.. snRNA-seq study of PTSD, MDD and NCs in dlPFC.
(A) Analytic strategy for snRNA-seq datasets. (B-C) Sc.1 comprised of two batches: Batch 1 with ~363k (B) and Batch 2 with ~137k nuclei (C). Representative tSNE plots of the 8 broad cell-types. (D) tSNE plot of ~126k nuclei from the two integrated batches of Sc.2 (male and female batches included) annotated to match the identity of the clustering from S.c1. (E-F) Volcano plots of the DGE in PTSD (E) and MDD (F) across seven cell-types (color coded). The dots are colored to denote nominally significant genes (P < 0.05) in the respective cell-types and the darker colored dots genes with FDR-adjusted P < 0.05. Up to 5 most significant (FDR-adjusted P) cell-type-specific DEGs er direction are labelled, along with GC-responsive (*) and PTSD-MDD shared DEGs (#). The number of DEGs passing 5% FDR level per cell-type is shown below. (G-H) Correlation of the DGE between cell-types in PTSD (G) and MDD (H). Data are represented as median ± 1.5 IQR, while the individual points denote the correlation for each cell-type. (I) Correlation of the cell-type-specific DGE between PTSD and MDD. Data are represented as median ± 1.5 IQR, while the individual points denote the correlation for each cell-type. The black dot annotates the correlation of PTSD and MDD in the bulk mPFC tissue. (J) Heatmap demonstrating the 5 most significantly enriched GO pathways in each cell-type per disorder. The terms have been clustered based on their NES. The color gradient denotes negative to positive enrichment and the asterisk-annotated pathways have an FDR-adjusted P < 0.05. In G and I, horizontal dotted lines denote minimal (ρ<0.1), moderate (0.3<ρ<0.6) and high (ρ>0.6) correlation.
Fig. 7.
Fig. 7.. Identification of GWAS-based risk genes and pathways for PTSD and MDD.
(A, B) Venn diagram of xSMR/xWAS-based risk genes overlap matched with FDR-significant (FDR-adjusted P < 0.05) disease process genes and with top genes for PTSD (A) and MDD (B). (C, D) Venn diagram of xWAS-based risk pathways overlap matched with FDR-significant disease pathways and top pathways for PTSD (C) and MDD (D). (E) Heatmap of mediation effects of PTSD or MDD risk genes in the association of GWAS SNPs with diagnosis (Dx) through gene expression alterations. SNP-gene pairs qualified by brain TSMR analyses of PTSD and MDD GWAS. The first two columns contain the cytogenetic band and the rsID of the qualified GWAS SNP. The mediating gene along with the tissue can be seen in the third column. The −log10 P of the Average Causal Mediation Effects (ACME) is provided as a measure of the significance of mediation. (F) Heatmap depicting each cell-type-disease association with PTSD and MDD. Numbers indicate FDR-adjusted P of the cell-type-disease associations. Heatmap color denotes the proportion (%) of significantly associated cells (FDR-adjusted P < 0.1) with the trait. *: FDR-adjusted P < 0.05. (G, H) Upset plots of scTSMR-based risk genes for PTSD (G) and MDD (H) at the level of cell-types in the dlPFC.
Fig. 8.
Fig. 8.. Integration of results.
Top genes were ranked based on accumulating statistical evidence across analyses in tiers (table S12A). Chromosomal location of top genes with the highest amount evidence is visualized. Six genes are localized on chromosome 12, followed by 3 genes on chromosome 6. Red squares depict PTSD top genes while a purple outline reflects membership in PTSD top pathways. Blue-green squares depict MDD top genes, while a purple outline reflects membership in MDD top pathways. Purple squares denote replication in PTSD analysis, while purple circles reflect replication in MDD analysis. Red squares reflect PTSD blood DEPs, red circles reflect MDD blood DEPs. Purple triangles depict association with childhood trauma analysis in the brain analyses, while red triangles reflect association with childhood trauma in the blood analyses. Purple diamonds indicate genes that are module hubs, while yellow diamonds outline reflect GC-regulation (DEX) in iPSC-derived neurons (26). Double squares and circles represent single-cell (sc) findings for PTSD and MDD, respectively; neuronal (Neu) vs non-neuronal (NonNeu) distinction is made by the yellow fill (Neu: not filled, NonNeu: filled). Finally, in relation to genetic analyses, blue shapes represent TSMR and TWAS, and blue shapes with gray fill reflect MSMR and MWAS. The double blue circle with gray fill represents significance in a scTSMR analysis of a non-neuronal cell-type.

References

    1. Smoller JW, The Genetics of Stress-Related Disorders: PTSD, Depression, and Anxiety Disorders. Neuropsychopharmacology 41, 297–319 (2016). - PMC - PubMed
    1. Wray NR et al., Genome-wide association analyses identify 44 risk variants and refine the genetic architecture of major depression. Nat Genet 50, 668–681 (2018). - PMC - PubMed
    1. Howard DM et al., Genome-wide meta-analysis of depression identifies 102 independent variants and highlights the importance of the prefrontal brain regions. Nat Neurosci 22, 343–352 (2019). - PMC - PubMed
    1. Cai N et al., Minimal phenotyping yields genome-wide association signals of low specificity for major depression. Nat Genet 52, 437–447 (2020). - PMC - PubMed
    1. Levey DF et al., Bi-ancestral depression GWAS in the Million Veteran Program and meta-analysis in >1.2 million individuals highlight new therapeutic directions. Nat Neurosci 24, 954–963 (2021). - PMC - PubMed

Publication types