. 2024 Jun 18;5(6):101582.
doi: 10.1016/j.xcrm.2024.101582. Epub 2024 May 22.

Single-cell multiomics profiling reveals heterogeneous transcriptional programs and microenvironment in DSRCTs

Affiliations

Single-cell multiomics profiling reveals heterogeneous transcriptional programs and microenvironment in DSRCTs

Clémence Henon et al. Cell Rep Med. .

Abstract

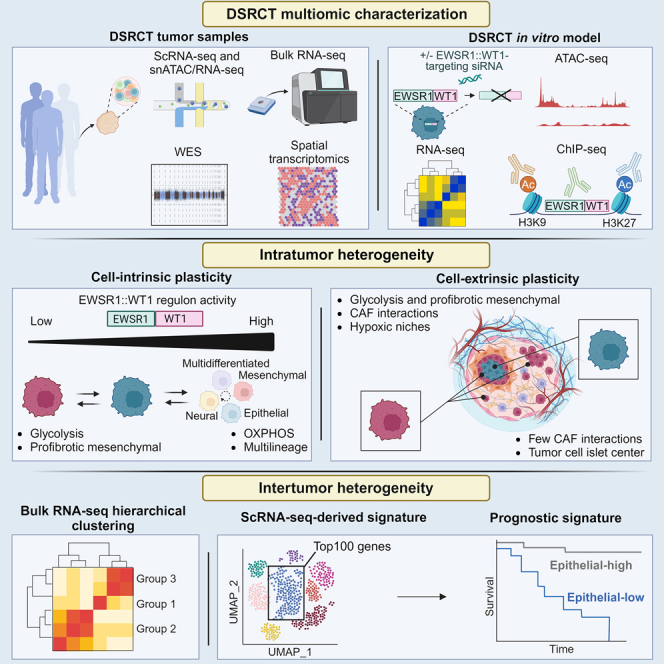
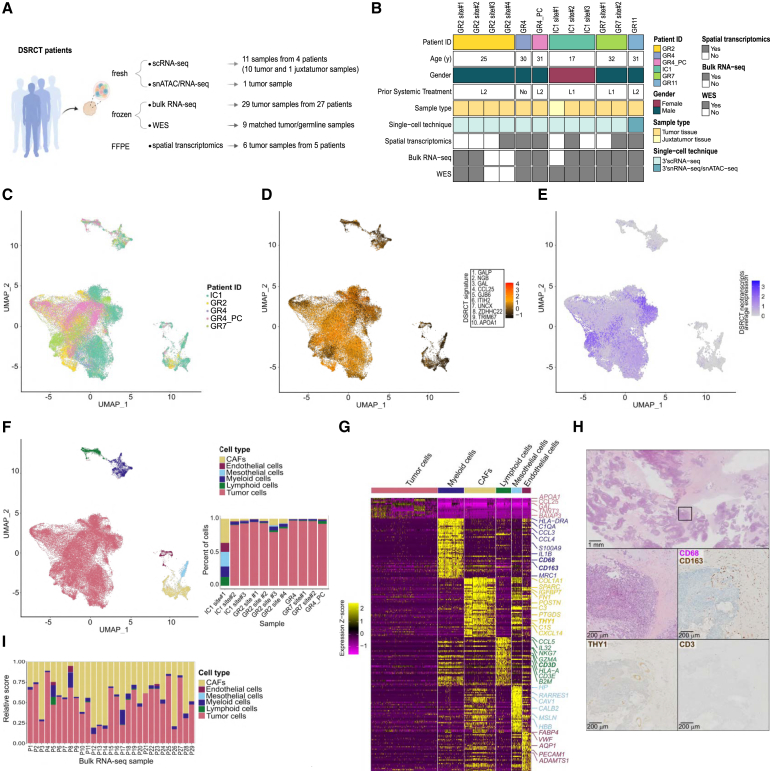
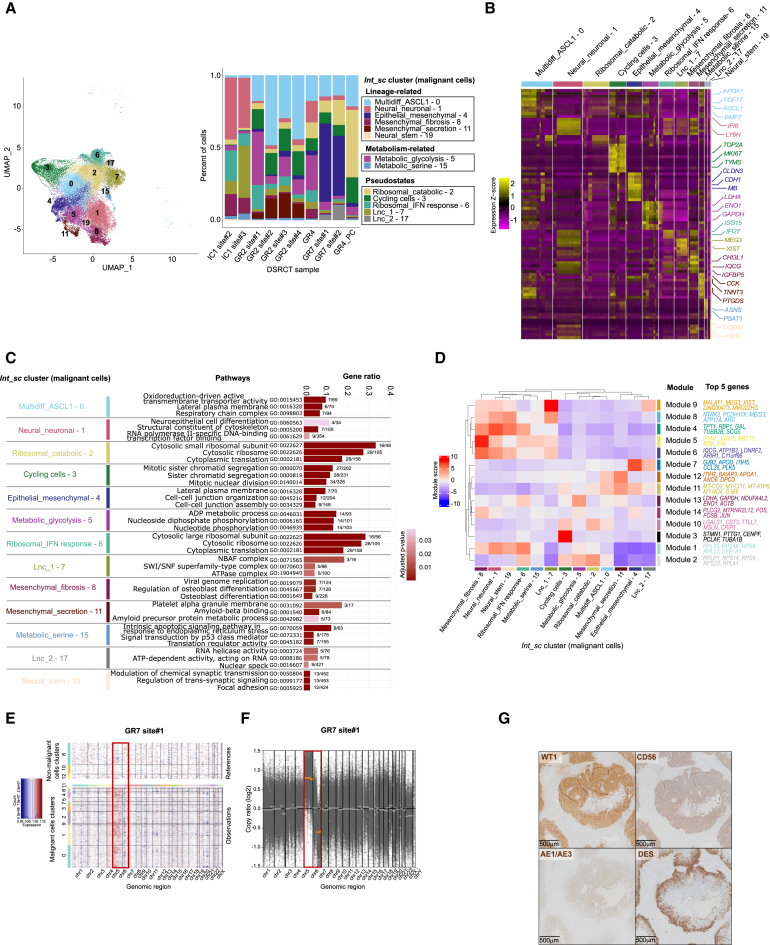
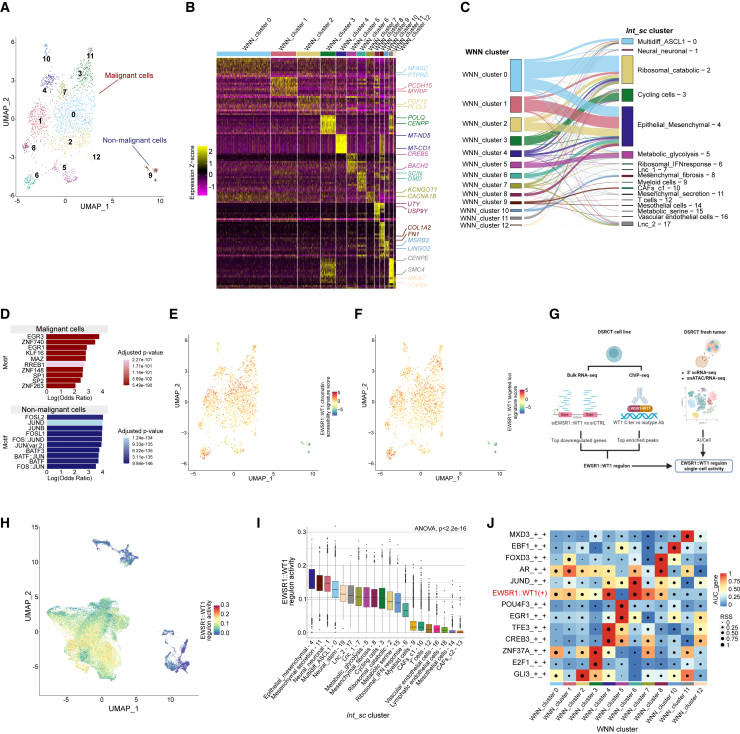
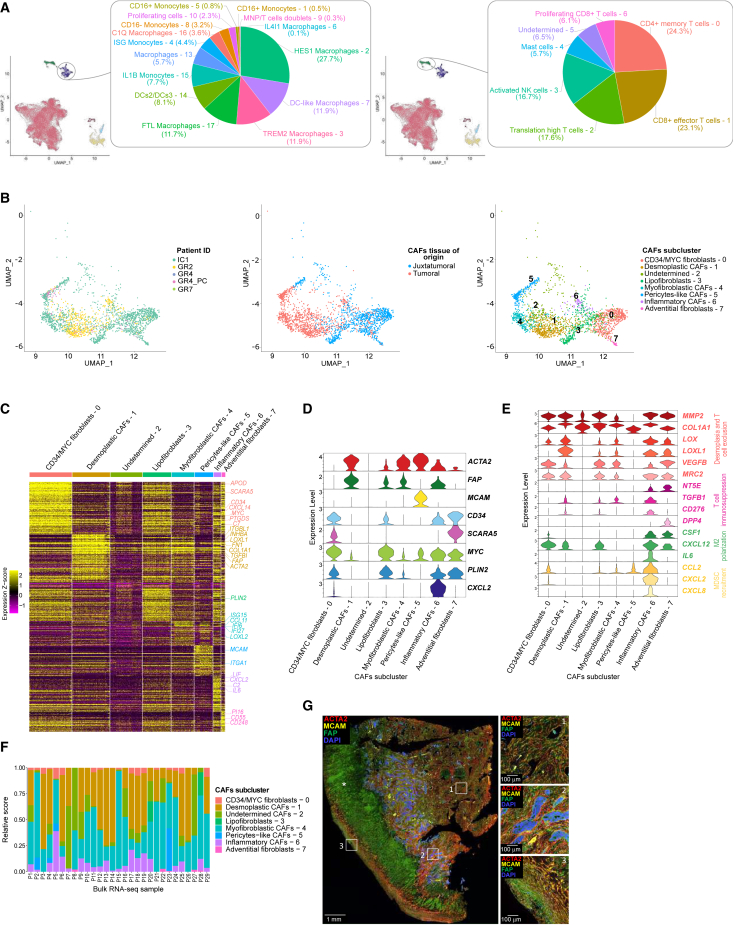
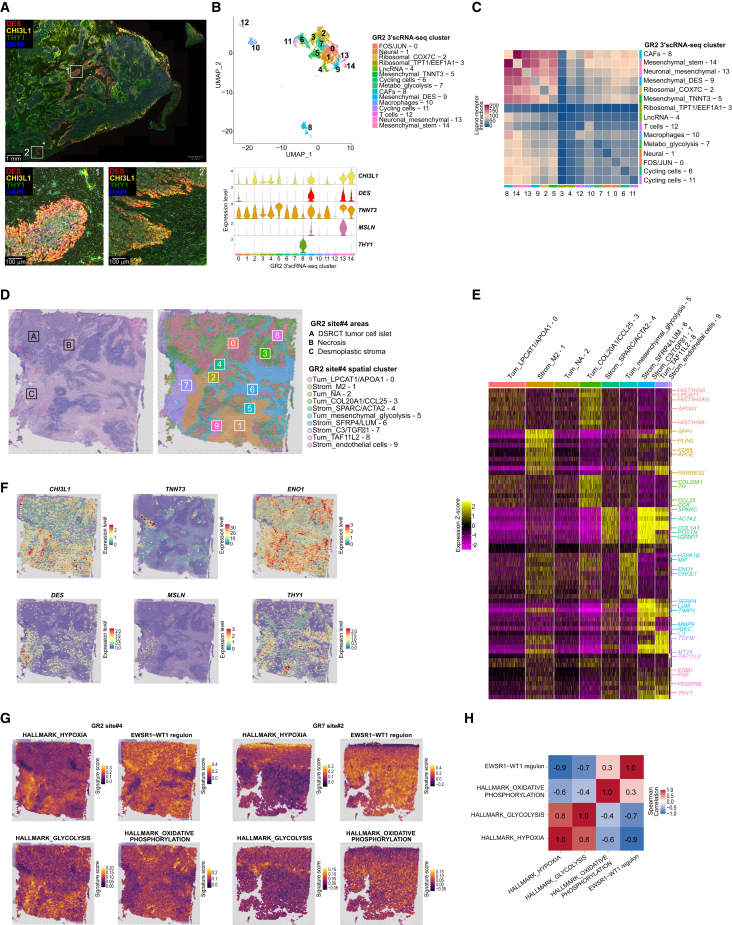
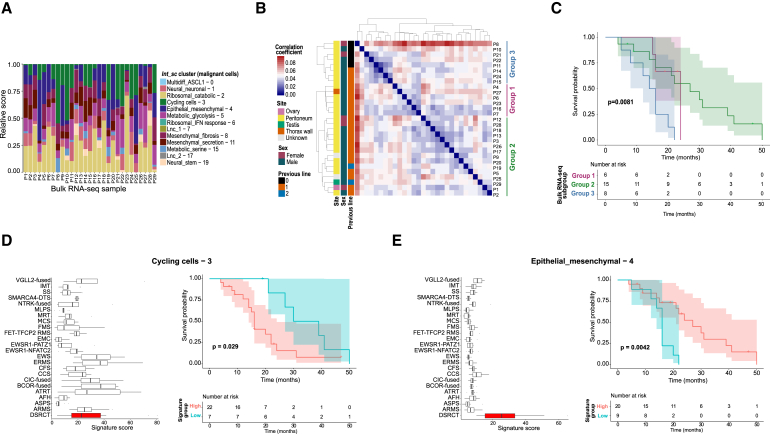
Desmoplastic small round cell tumor (DSRCT) is a rare, aggressive sarcoma driven by the EWSR1::WT1 chimeric transcription factor. Despite this unique oncogenic driver, DSRCT displays a polyphenotypic differentiation of unknown causality. Using single-cell multi-omics on 12 samples from five patients, we find that DSRCT tumor cells cluster into consistent subpopulations with partially overlapping lineage- and metabolism-related transcriptional programs. In vitro modeling shows that high EWSR1::WT1 DNA-binding activity associates with most lineage-related states, in contrast to glycolytic and profibrotic states. Single-cell chromatin accessibility analysis suggests that EWSR1::WT1 binding site variability may drive distinct lineage-related transcriptional programs, supporting some level of cell-intrinsic plasticity. Spatial transcriptomics reveals that glycolytic and profibrotic states specifically localize within hypoxic niches at the periphery of tumor cell islets, suggesting an additional role of tumor cell-extrinsic microenvironmental cues. We finally identify a single-cell transcriptomics-derived epithelial signature associated with improved patient survival, highlighting the clinical relevance of our findings.

Keywords: EWSR1::WT1; cancer-associated fibroblasts; desmoplastic small round cell tumor; microenvironment; molecular and cellular heterogeneity; plasticity; sarcoma; single-cell RNA-sequencing; spatial transcriptomics; transcription factor.


Conflict of interest statement

Declaration of interests The authors declare no competing interests.

Figures

None
Graphical abstract
Figure 1
Figure 1
ScRNA-seq recapitulates DSRCT cellular composition (A) DSRCT bulk and single-cell multiomic profiling. (B) Patient and sample characteristics. L1: one prior treatment line; L2: two prior treatment lines. (C) Uniform Manifold Approximation and Projection (UMAP) showing Int_sc dataset sample-of-origin. (D) UMAP showing DSRCT signature score. (E) UMAP showing DSRCT neotranscripts expression. (F) UMAP (left panel) and barplot (right panel) highlighting DSRCT cell subpopulations. (G) Heatmap showing expression Z-score of the top 50 DEGs of Int_sc cell types. (H) H&E and IHC stainings for THY1, CD68/CD163, and CD3. The scale bar is displayed in the bottom left corner of each panel, representing 1 mm in the top panel and 200 µm in the four lower panels. (I) DSRCT bulk RNA-seq cell subpopulation deconvolution.
Figure 2
Figure 2
DSRCT malignant cells show multilineage differentiation and metabolic states heterogeneity (A) UMAP (left panel) and barplot (right panel) highlighting DSRCT malignant cell clusters in individual datasets. (B) Heatmap showing expression Z score of the top 50 DEGs of each DSRCT malignant cell cluster. (C) Top three GO pathways in DSRCT malignant cell clusters. Top 3 GO pathways based on gene ratio, after selection of the top 5 significantly enriched (p value <0.05) GO terms. (D) Hierarchical clustering of HotSpot coexpressed gene modules. The top five genes driving module activity are shown. (E) Single-cell level copy number variations (CNV) inference. Representative results of GR7 site#1. (F) Bulk WES-derived CNV analysis on GR7 site#1. (G) Representative IHC stainings for WT1, AE1/AE3, DES, and CD56 on a DSRCT sample. The scale bar representing 500 μm is displayed on the bottom left corner of each panel.
Figure 3
Figure 3
EWSR1::WT1 activity and epigenetic reprogramming are one determinant of DSRCT heterogeneity (A) UMAP of GR11 sample snMultiome WNN clustering. (B) Heatmap showing expression Z score of the top 10 DEGs across WNN snMultiome clusters. (C) Label transfer of Int_sc clusters on WNN snMultiome dataset. (D) Barplot showing the top 10 enriched motifs in malignant versus non-malignant cells. (E) UMAP showing EWSR1::WT1 chromatin accessibility signature score on snMultiome assay. (F) UMAP showing EWSR1::WT1 targeted loci signature score on snMultiome assay. (G) Graphical representation of single-cell EWSR1::WT1 regulon activity inference. (H) UMAP showing EWSR1::WT1 regulon activity in Int_sc dataset. (I) Boxplot representing EWSR1::WT1 regulon activity per Int_sc cluster. (J) Heatmap-dotplot showing gene AUCs for the most specific regulons defined by regulon specific score (RSS), as well as EWSR1::WT1, AR, and EGR1 regulons.
Figure 4
Figure 4
DSRCT microenvironment displays immunosuppressive features and distinct CAF subpopulations (A) Int_sc infiltrating myeloid (left panel) and lymphoid (right panel) subpopulation proportions represented by pie charts. (B) UMAP plots displaying CAFs according to patient ID (left panel), tissue of origin (middle panel), and subclustering (right panel). (C) Heatmap highlighting expression Z score of the top 50 DEGs of CAFs subcluster. (D) Violin plot showing expression profile of CAF subclusters for canonical markers. (E) Violin plots displaying expression profile of CAF subclusters for immunosuppressive markers. (F) DSRCT bulk RNA-seq CAF subpopulations deconvolution. (G) Immunofluorescence triplex showing ACTA2 (red), MCAM (yellow), FAP (green), and DAPI staining on a DSRCT FFPE sample in distinct stromal areas. The #1 annotation designates desmoplastic stromal areas, #2 shows tumor cell islets periphery, and #3 indicates the tumor pseudocapsule. The ∗ sign shows tumor necrosis. The scale bar is displayed on the bottom left corner of each panel, representing 1 mm on the left panel and 100 μm on the three right panels.
Figure 5
Figure 5
DSRCT heterogeneity is linked to tumor spatial organization (A) Immunofluorescent staining highlighting mesenchymal DSRCT tumor cells (DES+ and/or CHI3L1+), and CAFs (THY1+) on GR2 sample. (B) UMAP showing GR2 3′ scRNA-seq clustering (upper panel), and violin plot (bottom panel) showing the expression of (1) tumor cell mesenchymal markers CHI3L1, DES, TNNT3, and MSLN; and (2) the CAF-specific marker THY1. (C) Ligand-receptor interactions (CellPhoneDB) between cell clusters in the GR2 sample, representative of all specimens. (D) GR2 site#4 sample annotated H&E-stained slide used for Visium assay, and spatial representation of spots’ clusters. (E) Heatmap highlighting expression Z score of the top 10 DEG across spots’ clusters from GR2 site#4 Visium assay. (F) Spatial representation of CHI3L1, TNNT3, ENO1, DES, MSLN and THY1 expression levels in GR2 site#4 sample using the Visium assay. (G) Spatial gene signatures scores for HALLMARK_HYPOXIA, GLYCOLYSIS, OXPHOS, and EWSR1::WT1 regulon in GR2 site#4 and GR7 site#2 samples. (H) Median Spearman correlation coefficients between gene signatures and EWSR1::WT1 regulon across Visium assays (n = 6).
Figure 6
Figure 6
DSRCT shows interpatient heterogeneity and scRNA-seq-derived gene signatures define DSRCT patients’ prognostic groups (A) DSRCT bulk RNA-seq Int_sc clusters deconvolution. (B) DSRCT bulk RNA-seq samples hierarchical clustering highlighting three distinct subgroups. (C) Kaplan-Meier overall survival plot according to DSRCT bulk RNA-seq hierarchical clustering subgroups. p values are calculated using the log rank test. (D and E) Specificity and prognostic significance of the Cycling cells – 3 (D) and epithelial-mesenchymal) – 4 (E) signature scores. The signature specificity is assessed by comparing its value in a DSRCT bulk RNA-seq dataset versus other sarcoma subtypes. The Kaplan-Meier plot shows the overall survival according to High or Low 3′ scRNA-seq derived signatures’ scores. P values are calculated using the log rank test.

References

    1. Cidre-Aranaz F., Watson S., Amatruda J.F., Nakamura T., Delattre O., de Alava E., Dirksen U., Grünewald T.G.P. Small round cell sarcomas. Nat. Rev. Dis. Prim. 2022;8:66. doi: 10.1038/s41572-022-00393-3. - DOI - PubMed
    1. Gerald W.L., Ladanyi M., de Alava E., Cuatrecasas M., Kushner B.H., LaQuaglia M.P., Rosai J. Clinical, pathologic, and molecular spectrum of tumors associated with t(11;22)(p13;q12): desmoplastic small round-cell tumor and its variants. J. Clin. Oncol. 1998;16:3028–3036. doi: 10.1200/JCO.1998.16.9.3028. - DOI - PubMed
    1. Wong H.H., Hatcher H.M., Benson C., Al-Muderis O., Horan G., Fisher C., Earl H.M., Judson I. Desmoplastic small round cell tumour: characteristics and prognostic factors of 41 patients and review of the literature. Clin. Sarcoma Res. 2013;3:14. doi: 10.1186/2045-3329-3-14. - DOI - PMC - PubMed
    1. Lettieri C.K., Garcia-Filion P., Hingorani P. Incidence and Outcomes of Desmoplastic Small Round Cell Tumor: Results from the Surveillance, Epidemiology, and End Results Database. J. Cancer Epidemiol. 2014;2014 doi: 10.1155/2014/680126. - DOI - PMC - PubMed
    1. Thomas R., Rajeswaran G., Thway K., Benson C., Shahabuddin K., Moskovic E. Desmoplastic small round cell tumour: the radiological, pathological and clinical features. Insights Imaging. 2013;4:111–118. doi: 10.1007/s13244-012-0212-x. - DOI - PMC - PubMed