. 2024 Jun 6;187(12):3072-3089.e20.
doi: 10.1016/j.cell.2024.04.039. Epub 2024 May 22.

Patterning and folding of intestinal villi by active mesenchymal dewetting

Affiliations

Patterning and folding of intestinal villi by active mesenchymal dewetting

Tyler R Huycke et al. Cell. .

Abstract

Tissue folds are structural motifs critical to organ function. In the intestine, bending of a flat epithelium into a periodic pattern of folds gives rise to villi, finger-like protrusions that enable nutrient absorption. However, the molecular and mechanical processes driving villus morphogenesis remain unclear. Here, we identify an active mechanical mechanism that simultaneously patterns and folds the intestinal epithelium to initiate villus formation. At the cellular level, we find that PDGFRA+ subepithelial mesenchymal cells generate myosin II-dependent forces sufficient to produce patterned curvature in neighboring tissue interfaces. This symmetry-breaking process requires altered cell and extracellular matrix interactions that are enabled by matrix metalloproteinase-mediated tissue fluidization. Computational models, together with in vitro and in vivo experiments, revealed that these cellular features manifest at the tissue level as differences in interfacial tensions that promote mesenchymal aggregation and interface bending through a process analogous to the active dewetting of a thin liquid film.

Keywords: Cahn-Hilliard; active fluids; biophysics; cell adhesion; development; extracellular matrix; morphogenesis; patterning; phase separation; self-organization.


Conflict of interest statement

Declaration of interests Z.J.G. and C.S.M. hold patents related to the MULTI-seq barcoding method.

Figures
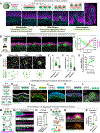
Figure 1.
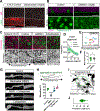
Figure 1.. PDGFRAHigh cell aggregation is sufficient to drive interfacial folding and initiate villi
(A) Optical sections showcasing developmental stages of intestinal villus morphogenesis in PDGFRAH2BGFP mice. Dashed box emphasizes symmetry breaking and emergence of patterned interfacial folding – the main focus of this study. Dashed yellow line indicates epithelial-mesenchymal interface. (B) Snapshots from a timelapse video of an E14 PdgfraH2BGFP; ShhCreER; R26RtdTomato intestinal explant. Yellow line indicates epithelial-mesenchymal interface. (C) PDGFRAHigh aggregate perimeter/area ratio and interfacial curvature from timelapse videos as in (B). Error bars are mean ± SD. n=5 aggregates measured from two explant videos. (D) Example of tracked cells, color coded by identities during aggregation (red shades=PDGFRALow, non-aggregating cells; green shades=PDGFRAHigh, aggregating cells). Bottom panels are isolated cell tracks from top panels. (E) Mean speed of tracked nuclei from timelapse videos. Each point represents the average speed calculated for a single nucleus across a 20-hour timeframe, collected from n=3 E14.5 intestine explants. (F) Displacement of tracked nuclei from timelapse videos as in (E). (G) PDGFRAH2BGFP fluorescence intensity plotted over time, collected from n=15 cells for each phenotype (PDGFRALow or PDGFRAHigh) from three intestinal explants. (H-L) Optical sections from recombined tissues, color coded by origin of epithelia for (H) tdTomato-labeled adult mouse enteroid epithelium, (I) tdTomato-labeled adult mouse colonoid epithelium, (J) GFP-labeled human intestinal organoid (HIO)-derived endoderm, (K) nuclear RFP-labeled MDCK cells, and (L) no epithelium (negative CDH1 stain). Dashed lines demarcate folded epithelial-mesenchymal interfaces at sites of mesenchymal aggregation. Recombined tissues in panels K and L were incubated in the presence of 1 μM SAG. Representative of at least 9 tissue recombinants per condition. (M) Strategy for generating synthetic aggregates. (N) Orthogonal views of synthetic aggregates cultured on polyacrylamide gels for 16 hours. (O) Quantification of gel curvature in (N). (P) Strategy for generating ectopic synthetic aggregates. (Q) Orthogonal optical section through an explant with an ectopic aggregate adjacent to an endogenous aggregate. (R) Radius of curvature in epithelia overlying synthetic/ectopic aggregates versus adjacent natural/control aggregates. Scale bars = 50 μm; **p<0.01, ****p<0.0001
Figure 2.
Figure 2.. PDGFRAHigh cells upregulate expression of ECM remodeling, adhesion, and contractile programs
(A) Uniform Manifold Approximation and Projection (UMAP) of the subepithelial intestinal mesenchyme subset of scRNA-seq data from combined stages E13.5, E14.5, E15.5, E16.5, and E18.5. (B) Density plots of PDGFRAHigh (FACS-enriched) and PDGFRALow populations across developmental stages. (C) Cell clustering of the PDGFRA+ subepithelial subset. (D) UMAPs of gene modules contributing to cell-cell and cell-matrix adhesion identified by the Reactome Database and plotted as a Reactome Pathway Activity score calculated by AUCell and the Adhesion Score defined by cell adhesion interacting genes (see Method Details). (E) DotPlot comparing expression for selected genes related to noted cellular and molecular functions between PDGFRA-High 1 and PDGFRA-low 1 clusters.
Figure 3.
Figure 3.. Mesenchymal non-muscle myosin activity and integrin-mediated adhesion are required for aggregate compaction and villus initiation
(A) Immunofluorescence (IF) in cryosections of E15.5 mouse small intestines. Yellow circles mark mesenchymal aggregate locations in equivalent composite and single-channel images. Yellow arrow denotes expected pMLC expression in smooth muscle. (B) UMAPs showing RNA expression for protein products labeled by IF in (A). PDGFRAHigh population labeled in Figure 2. (C) Optical sections (at midline) from whole-mount IF of E15.5 proximal jejunum from a control or conditional myosin knockout. Representative of n=9 double mutants. (D) Number of villi per 100 μm intestinal length. Each point represents an equivalent proximal region quantified in an individual intestine. (E) Epithelial curvature in tissue folds, measured across n=4 controls and mutants. (F) Villus length, measured across n=4 controls and mutants. (G) Optical sections from whole-mount IF of cross-sectional or top-down (en face) views of the subepithelial mesenchyme of intestinal explants. Images are representative of n6 samples per condition. (H) Cell motility (mean speed of tracked-nuclei) at aggregation onset measured from videos of explants. Each point represents a cell, measured from n=3 tissues per condition. (I) UMAPs of subepithelial mesenchymal integrin expression. (J) Optical sections from whole-mount IF of explants treated with TC-I 15. (K) Aggregate aspect ratio from explants in (J). Each point represents a distinct aggregate measured across n=5 treated or untreated explants. (L) Epithelial curvature measured above aggregates from (J) and (K). Scale bars = 50 μm; Error bars are mean ± SD, ***p<0.001, ****p<0.0001
Figure 4.
Figure 4.. Biophysical properties of PDGFRAHigh and PDGFRALow tissue enable mesenchymal dewetting
(A) Spatial characterization of cell and ECM morphology in the proximal versus distal E14.5 small intestine. Images are from whole-mount tissues with optical sections focused specifically on the subepithelial mesenchymal layer. Cell motility tracks are from region-specific 16-hour timelapse videos. (B) Cell motility measured in proximal and distal PDGFRAHigh cells from timelapse videos as in (A). (C) Relative tension measured by the length of tissue recoil immediately following laser ablation. Images were acquired en face of the subepithelial layer. Double-headed white arrow indicates the proximal-distal axis. Each point represents a single ablation experiment in a separate gut. (D) Example of PDGFRAHigh neighbor exchange from timelapse video snapshots of an E14.5 intestine. Each color represents a distinct cell. (E) Optical sections of homotypic and heterotypic mesenchymal microtissue spheroid coalescence. (F) Aggregate coalescence measured from timelapse videos, from n=7 PDGFRAHigh-High, n=8 PDGFRALow-Low, and n=8 PDGFRAHigh-Low spheroids. (G) Quantification of aggregate-aggregate contact angles from experiment in (E) 320 minutes following fusion initiation. (H) Homotypic or heterotypic cell doublets in agarose microwells. (I) Orthogonal views of single cells spreading on collagen-coated glass, noted by dotted white line. (J) Quantification of cell-cell contact angles in (H). (K) Quantification of cell-ECM contact angles in (I). (L) Images of tissues under micropipette aspiration. (M) Tissue deformation measured as length aspirated into the pipette after 8 minutes at constant pressure. Each point represents a separate measurement performed on a separate intestinal fragment. Scale bars = 50 μm in all panels but (H,I) = 10 μm. Data are represented as mean ± SD, ***p<0.001; ****p<0.0001
Figure 5.
Figure 5.. MMP activity fluidizes the subepithelial mesenchyme
(A) In situ zymography for MMP activity at E14.5. Dashed white line denotes the tissue interface; epi. = epithelium; mes. = mesenchyme. Images represent n=4 intestines per condition. (B) Optical sections and en face images of intestinal explants grown from E13.5 for 2 days. Images are representative of n=9 intestines per treatment. (C) IF of optical sections (top) and single-channel maximum intensity projections (10 μm) of subepithelial mesenchyme (bottom) in freshly isolated or explanted tissues grown from E13.5 for 2 days. (D) Fibronectin (ECM) alignment relative to the intestinal proximal-distal axis (0°) from experiment in (C). Averages from n=9 measurements from regions of interest in the proximal jejunum from n=3 explants per treatment (3 measurements per explant). (E) Cell tracks from 16 hour timelapse videos of E14 explants treated with GM6001. Compare to control tracks in proximal and distal tissues in Figure 4A. (F) Mean speeds of cells in explants from (B). (G) Whole-mount images of intestinal explants after 48 hours in culture. Right panels are dashed regions magnified. (H) Quantification of aggregation wavefront as a percentage of total small intestinal length from experiment in (G). Each point represents a single intestine measured. (I) Optical section of subepithelial mesenchyme shown en face at onset of aggregation with cytoplasmic RFP-labeled PDGFRA+ cells. Outlined region highlights contacting cell protrusions. (J) Cell protrusion length measured in subepithelial PDGFRAHigh cells. Each point represents the maximum protrusion length from a given cell in fixed tissues, measured from nucleus center to protrusion tip. Scale bars = 50 μm, except for (G) = 1 mm. Data are represented as mean ± SD. ***p<0.001; ****p<0.0001
Figure 6.
Figure 6.. Computational modeling predicts outcomes of cell aggregation and interfacial morphogenesis through mesenchymal dewetting
(A) Phase diagram of mesenchymal aggregation. Κ represents the effective cohesion values for each tissue layer. (B) Wild-type Cahn-Hilliard simulation. (C) Simulation and experiment demonstrating effect of initial PDGFRAHigh volume. Images are representative of n=6 tissues per condition. See detailed explanation in Method Details. (D) Cross-sectional aggregate area at the midplane/maxima. Each point represents a single aggregate, measured from 4 tissues per condition. (E) Aggregate spacing quantified by nearest-neighbor detection, measured from 4 tissues per condition. (F) Simulation and experiment demonstrating effect of a mispatterned PDGFRAHigh domain. Deep ectopic clusters noted by white arrows and dashed lines to indicate sphericity. (G) Simulation of lowered PDGFRAHigh-PDGFRAHigh cohesion and experiment of TC-I 15-treated tissues grown from E13.5 for 3 days. (H) Timelapse video snapshots. Dashed circles mark distinct aggregates. Red arrowheads mark aggregate gap events. (I) Simulation of lowered PDGFRAHigh-PDGFRAHigh cohesion. Blue arrows highlight gap events. (J) Aggregate aspect ratio measured in silico and in vivo. Bars represent control and experimental data from Figure 3J. Lines represent inverse Gaussian fits to the cell-based simulations of respective cohesion energies. (K) Simulation and experiment demonstrating aggregate coarsening at long time scales. (L) Aggregate geometry during coalescence. n=12 coalescing clusters and n=6 non-coalescing clusters. (M) Simulation and experiment of aggregate phase separation from initially mixed population of PDGFRAHigh (light green) and PDGFRALow (dark green) tissue. Experimental data represent n=11 mixed spheroids. (N) Normalized pairwise cluster distances; n=647 data, n=116 SPV model, with Gaussian distribution fit on the normalized distances. Coefficient of variation for data = 0.289 and model = 0.299. Scale bars = 50 μm, Data are represented as mean ± SD, ***p<0.001

Update of

References

    1. Tallinen T, Chung JY, Rousseau F, Girard N, Lefèvre J, and Mahadevan L (2016). On the growth and form of cortical convolutions. Nat. Phys. 12, 588–593. 10.1038/nphys3632. - DOI
    1. Shyer AE, Tallinen T, Nerurkar NL, Wei Z, Gil ES, Kaplan DL, Tabin CJ, and Mahadevan L (2013). Villification : How the Gut Gets Its Villi. Science 342, 212–218. 10.1126/science.1238842. - DOI - PMC - PubMed
    1. Garikipati K (2017). Journal of the Mechanics and Physics of Solids Perspectives on the mathematics of biological patterning and morphogenesis. J. Mech. Phys. Solids 99, 192–210. 10.1016/j.jmps.2016.11.013. - DOI
    1. Harris AK, Stopak D, and Warner P (1984). Generation of spatially periodic patterns by a mechanical instability : a mechanical alternative to the Turing model. J Embryol Exp Morphol 20, 1–20. - PubMed
    1. Hannezo E, and Heisenberg C-P (2019). Mechanochemical Feedback Loops in Development and Disease. Cell 178, 12–25. 10.1016/j.cell.2019.05.052. - DOI - PubMed

MeSH terms

Substances

LinkOut - more resources