. 2024 Jun 13;67(11):9124-9149.
doi: 10.1021/acs.jmedchem.4c00268. Epub 2024 May 23.

In Silico Assisted Identification, Synthesis, and In Vitro Pharmacological Characterization of Potent and Selective Blockers of the Epilepsy-Associated KCNT1 Channel

Affiliations

In Silico Assisted Identification, Synthesis, and In Vitro Pharmacological Characterization of Potent and Selective Blockers of the Epilepsy-Associated KCNT1 Channel

Nunzio Iraci et al. J Med Chem. .

Abstract

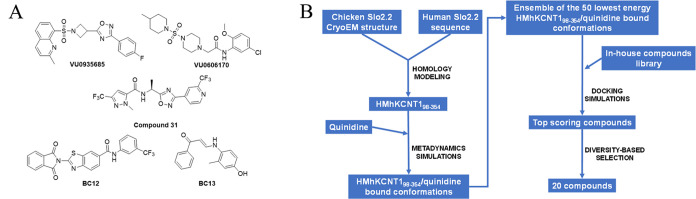
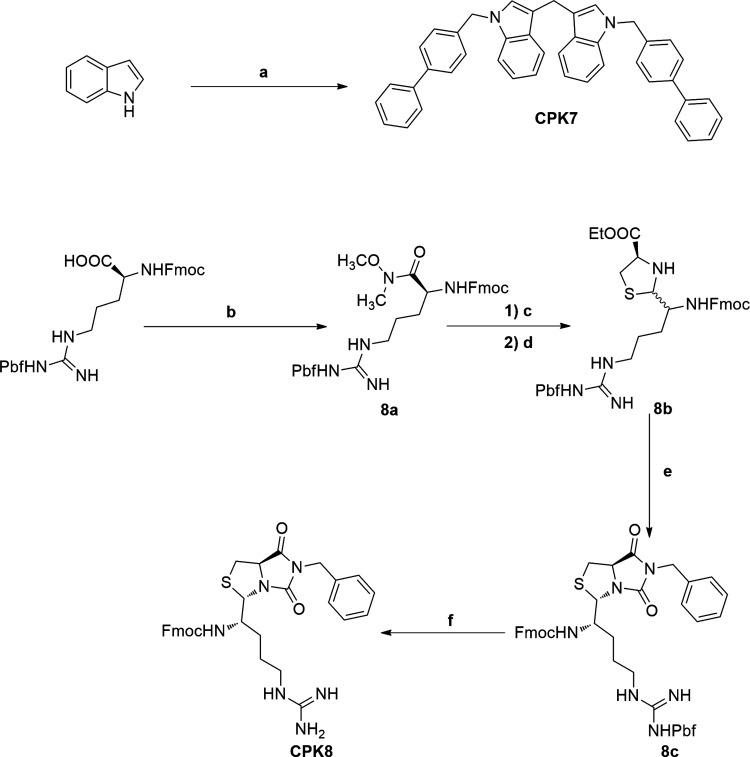
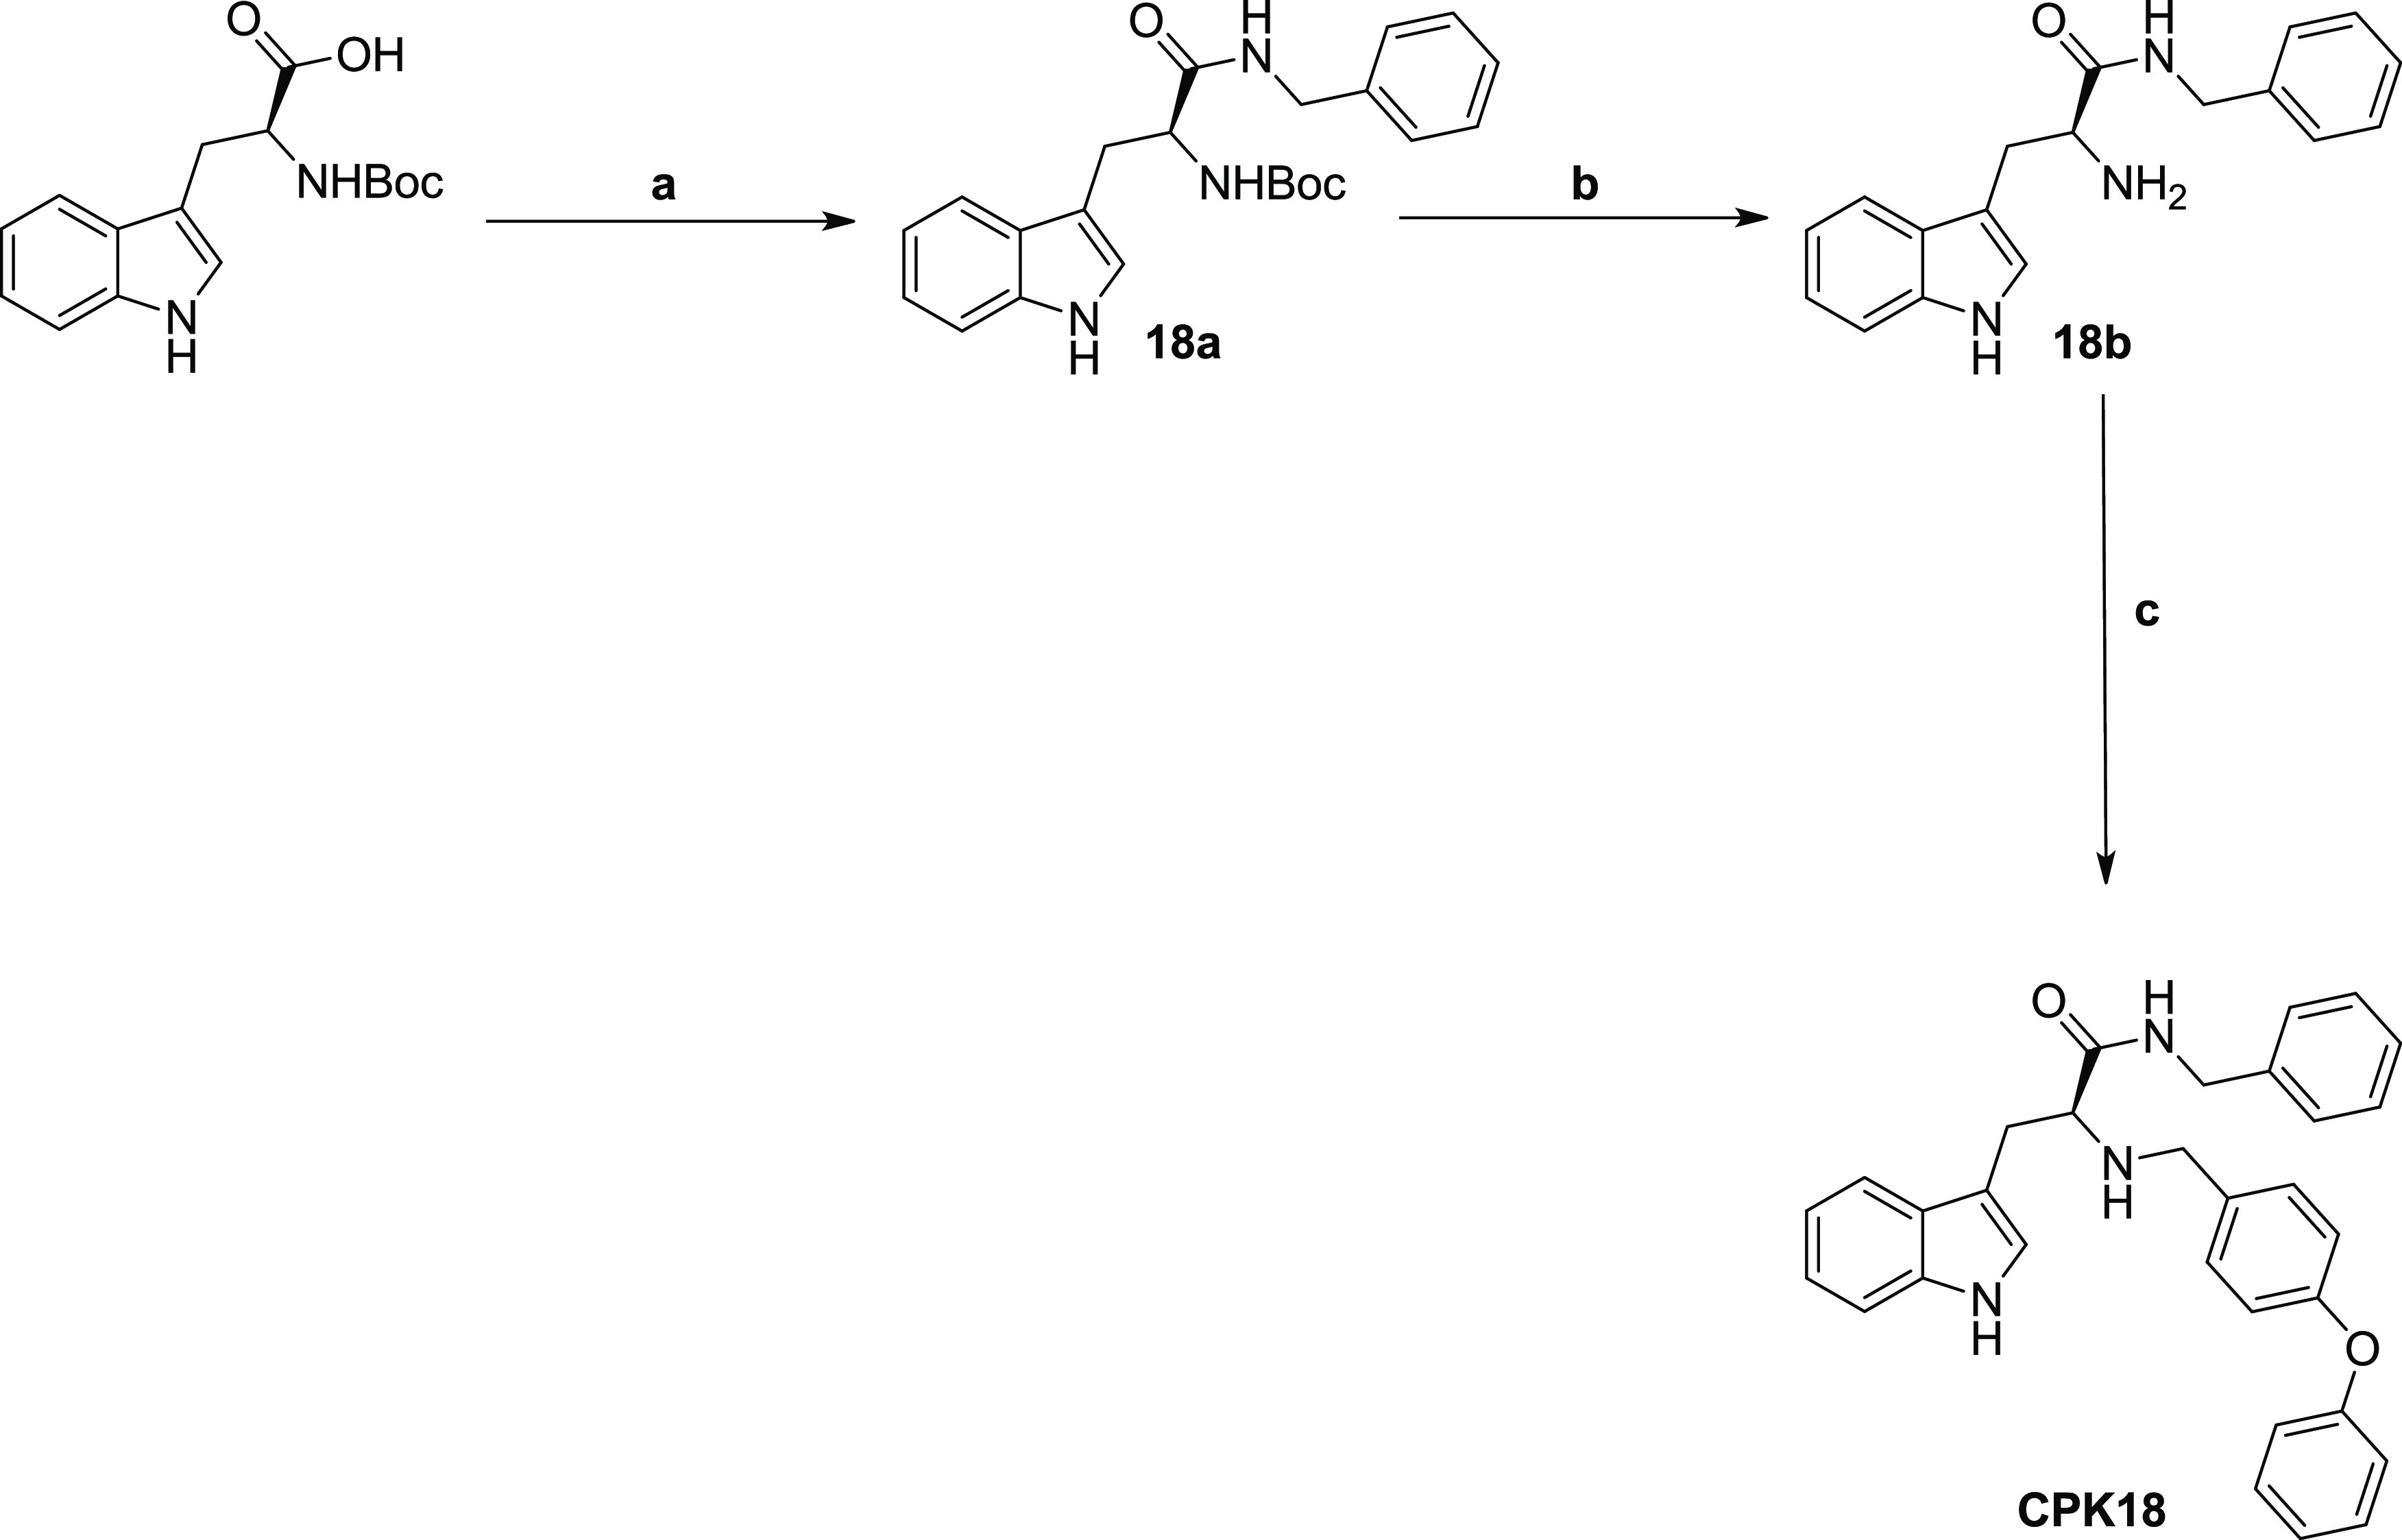
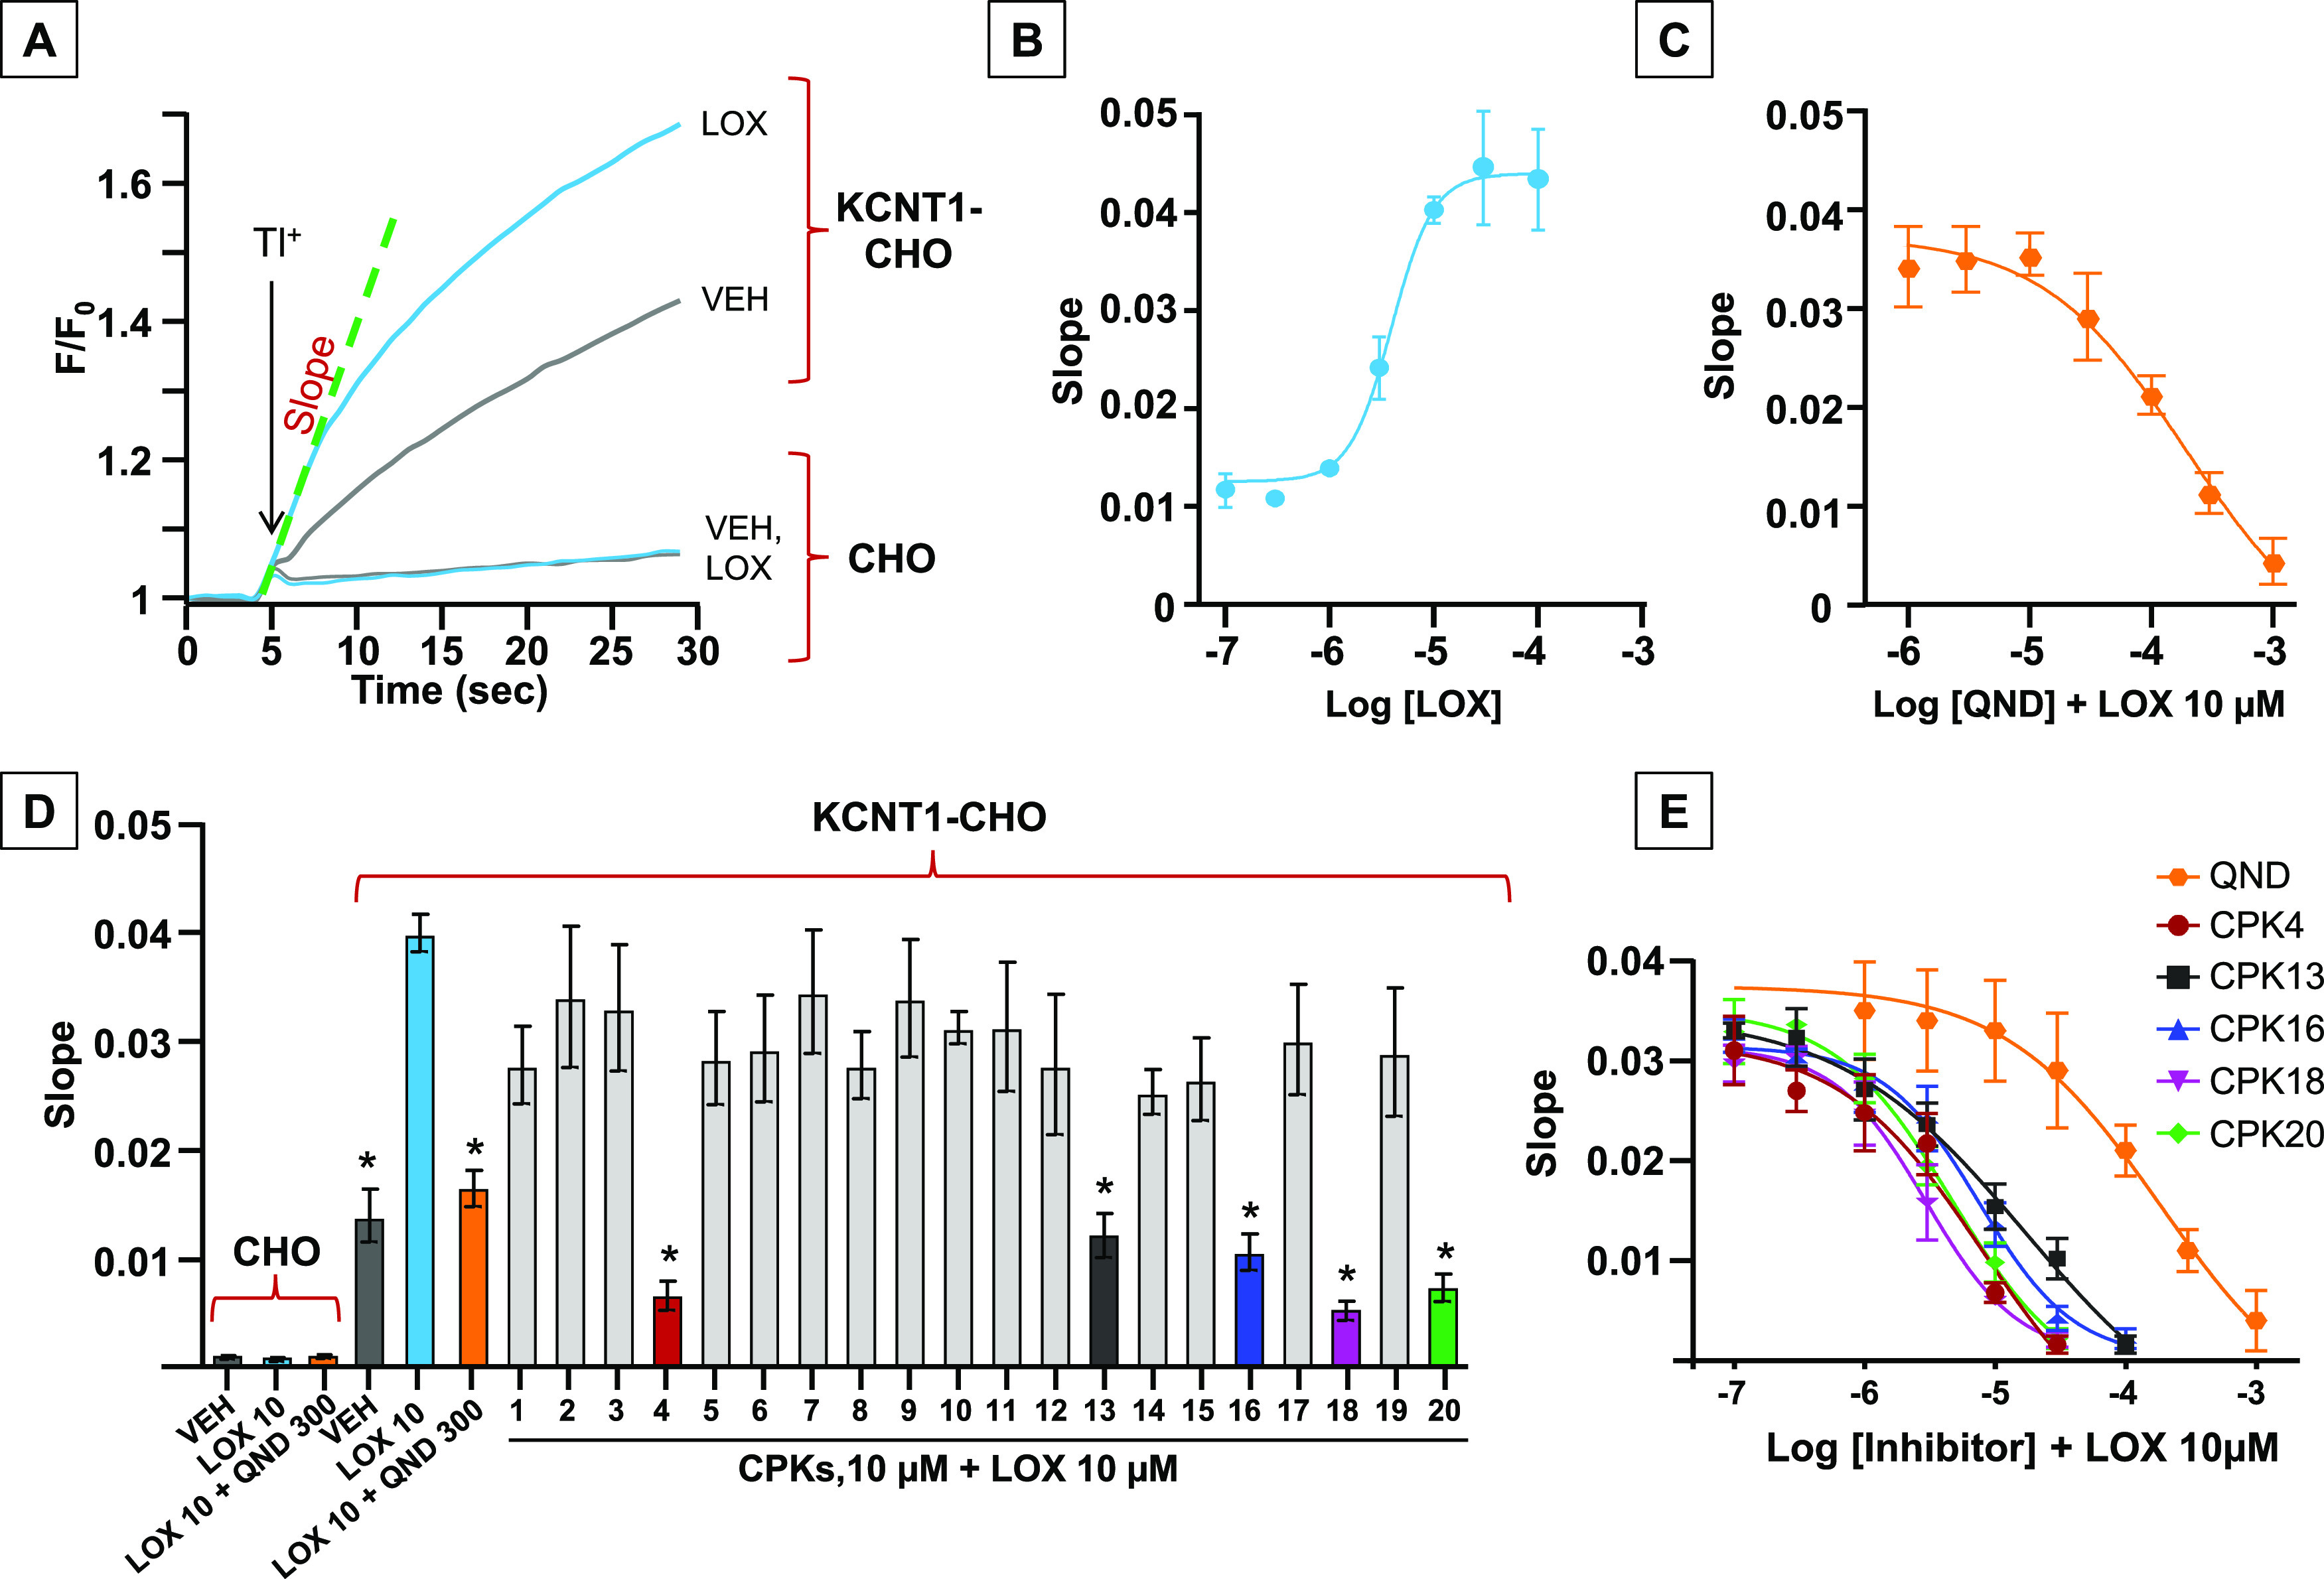
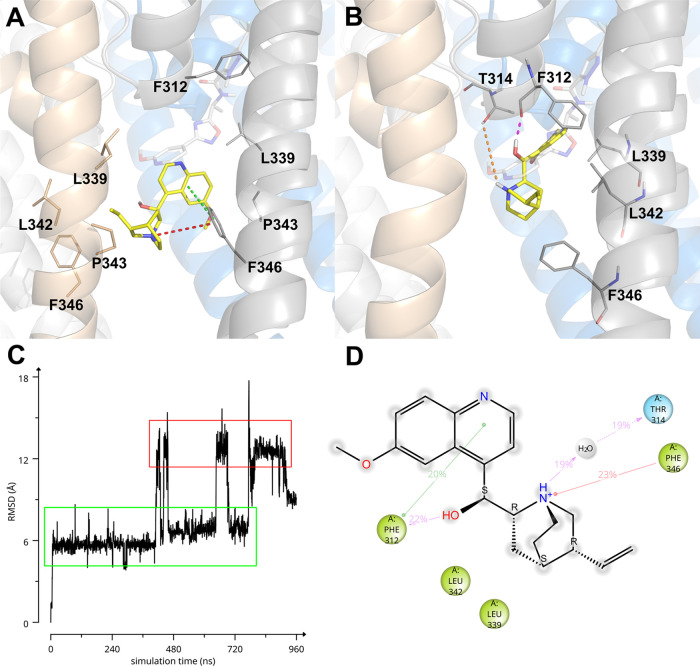
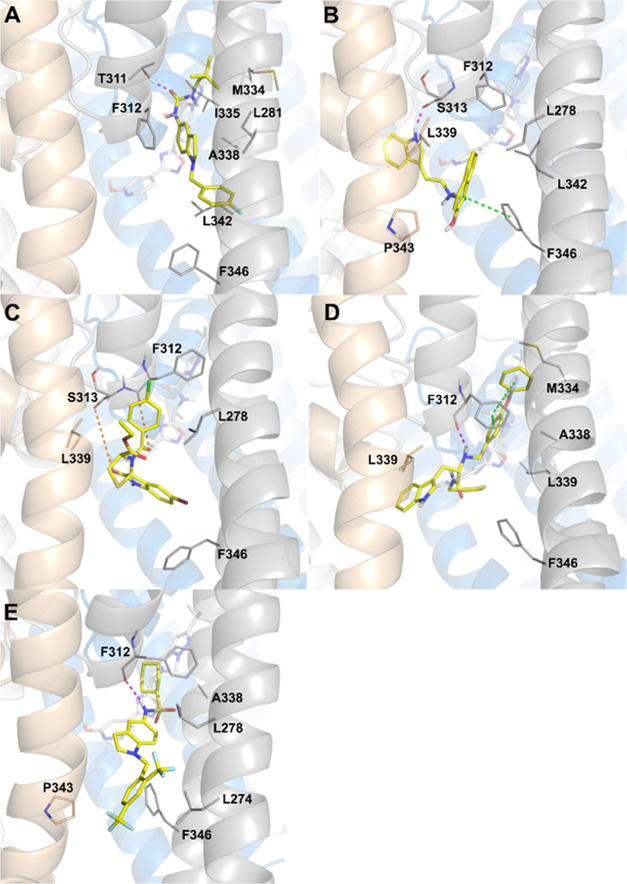
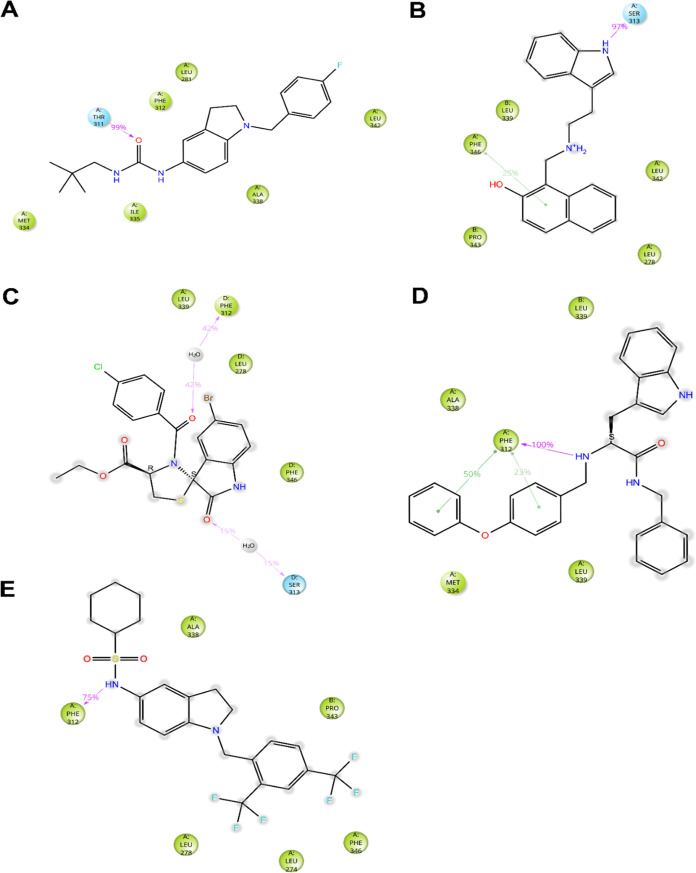
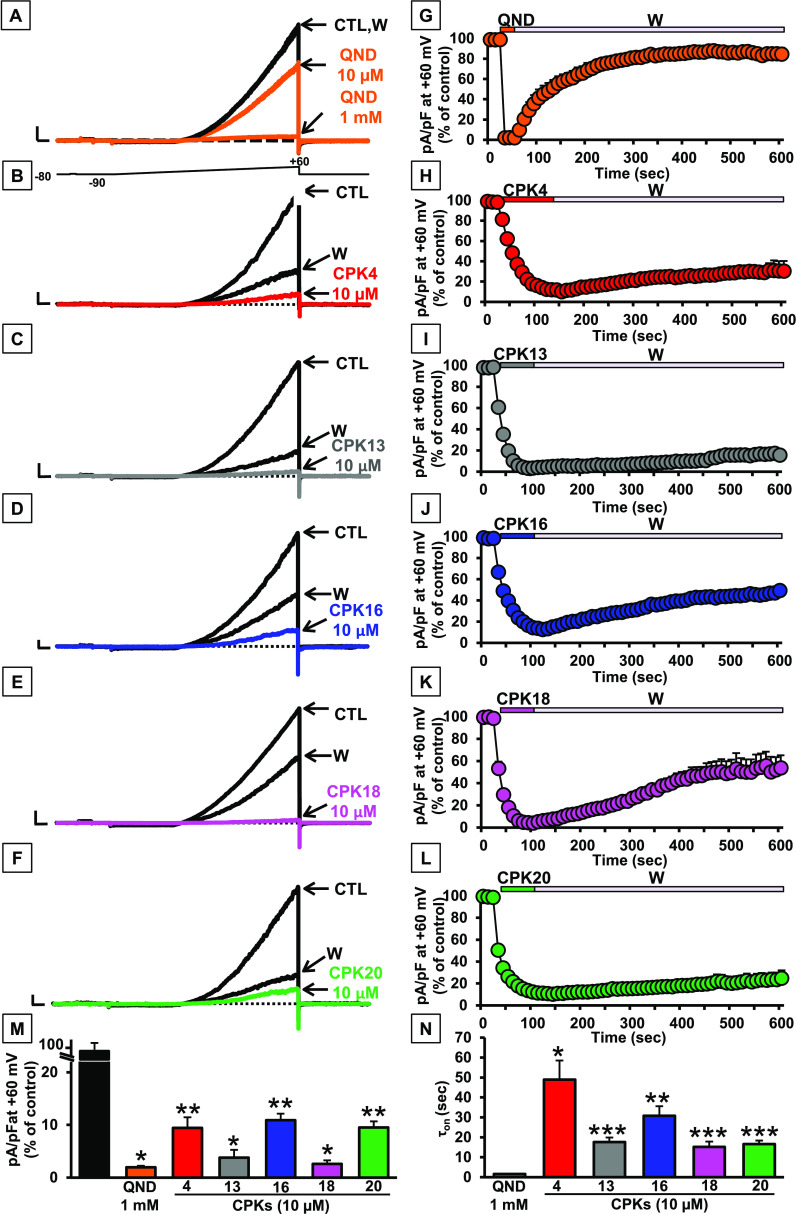
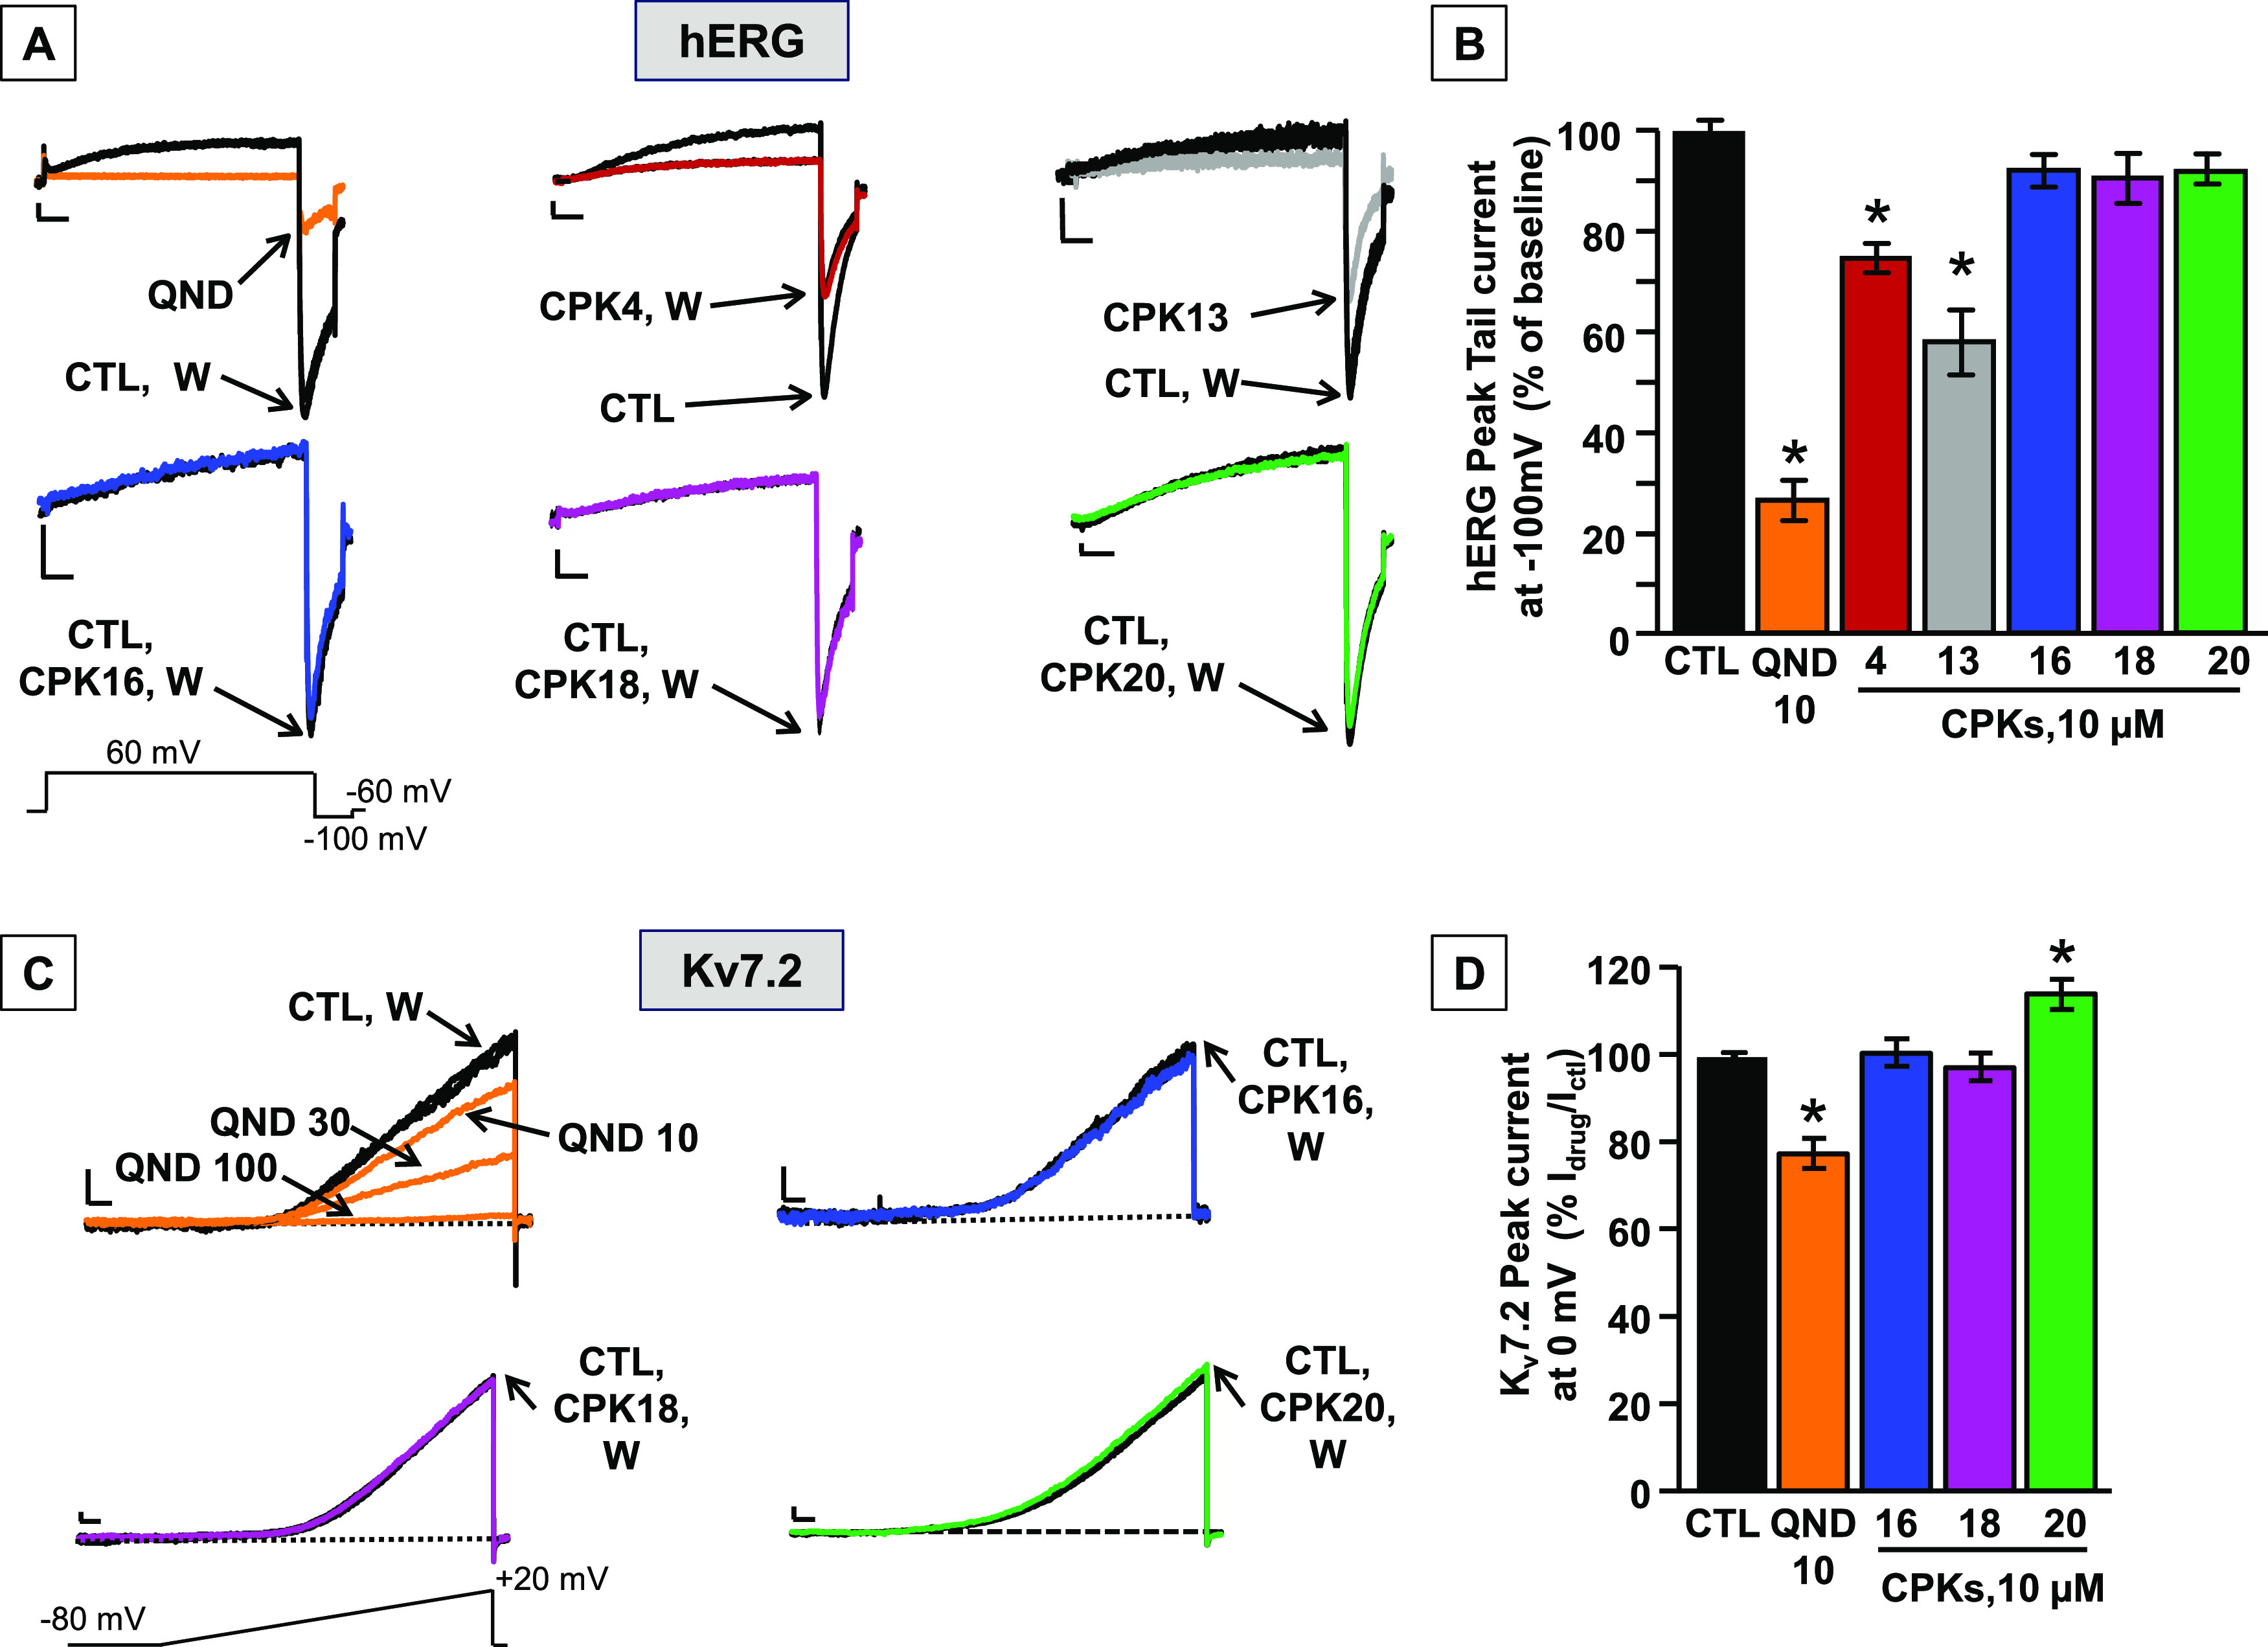
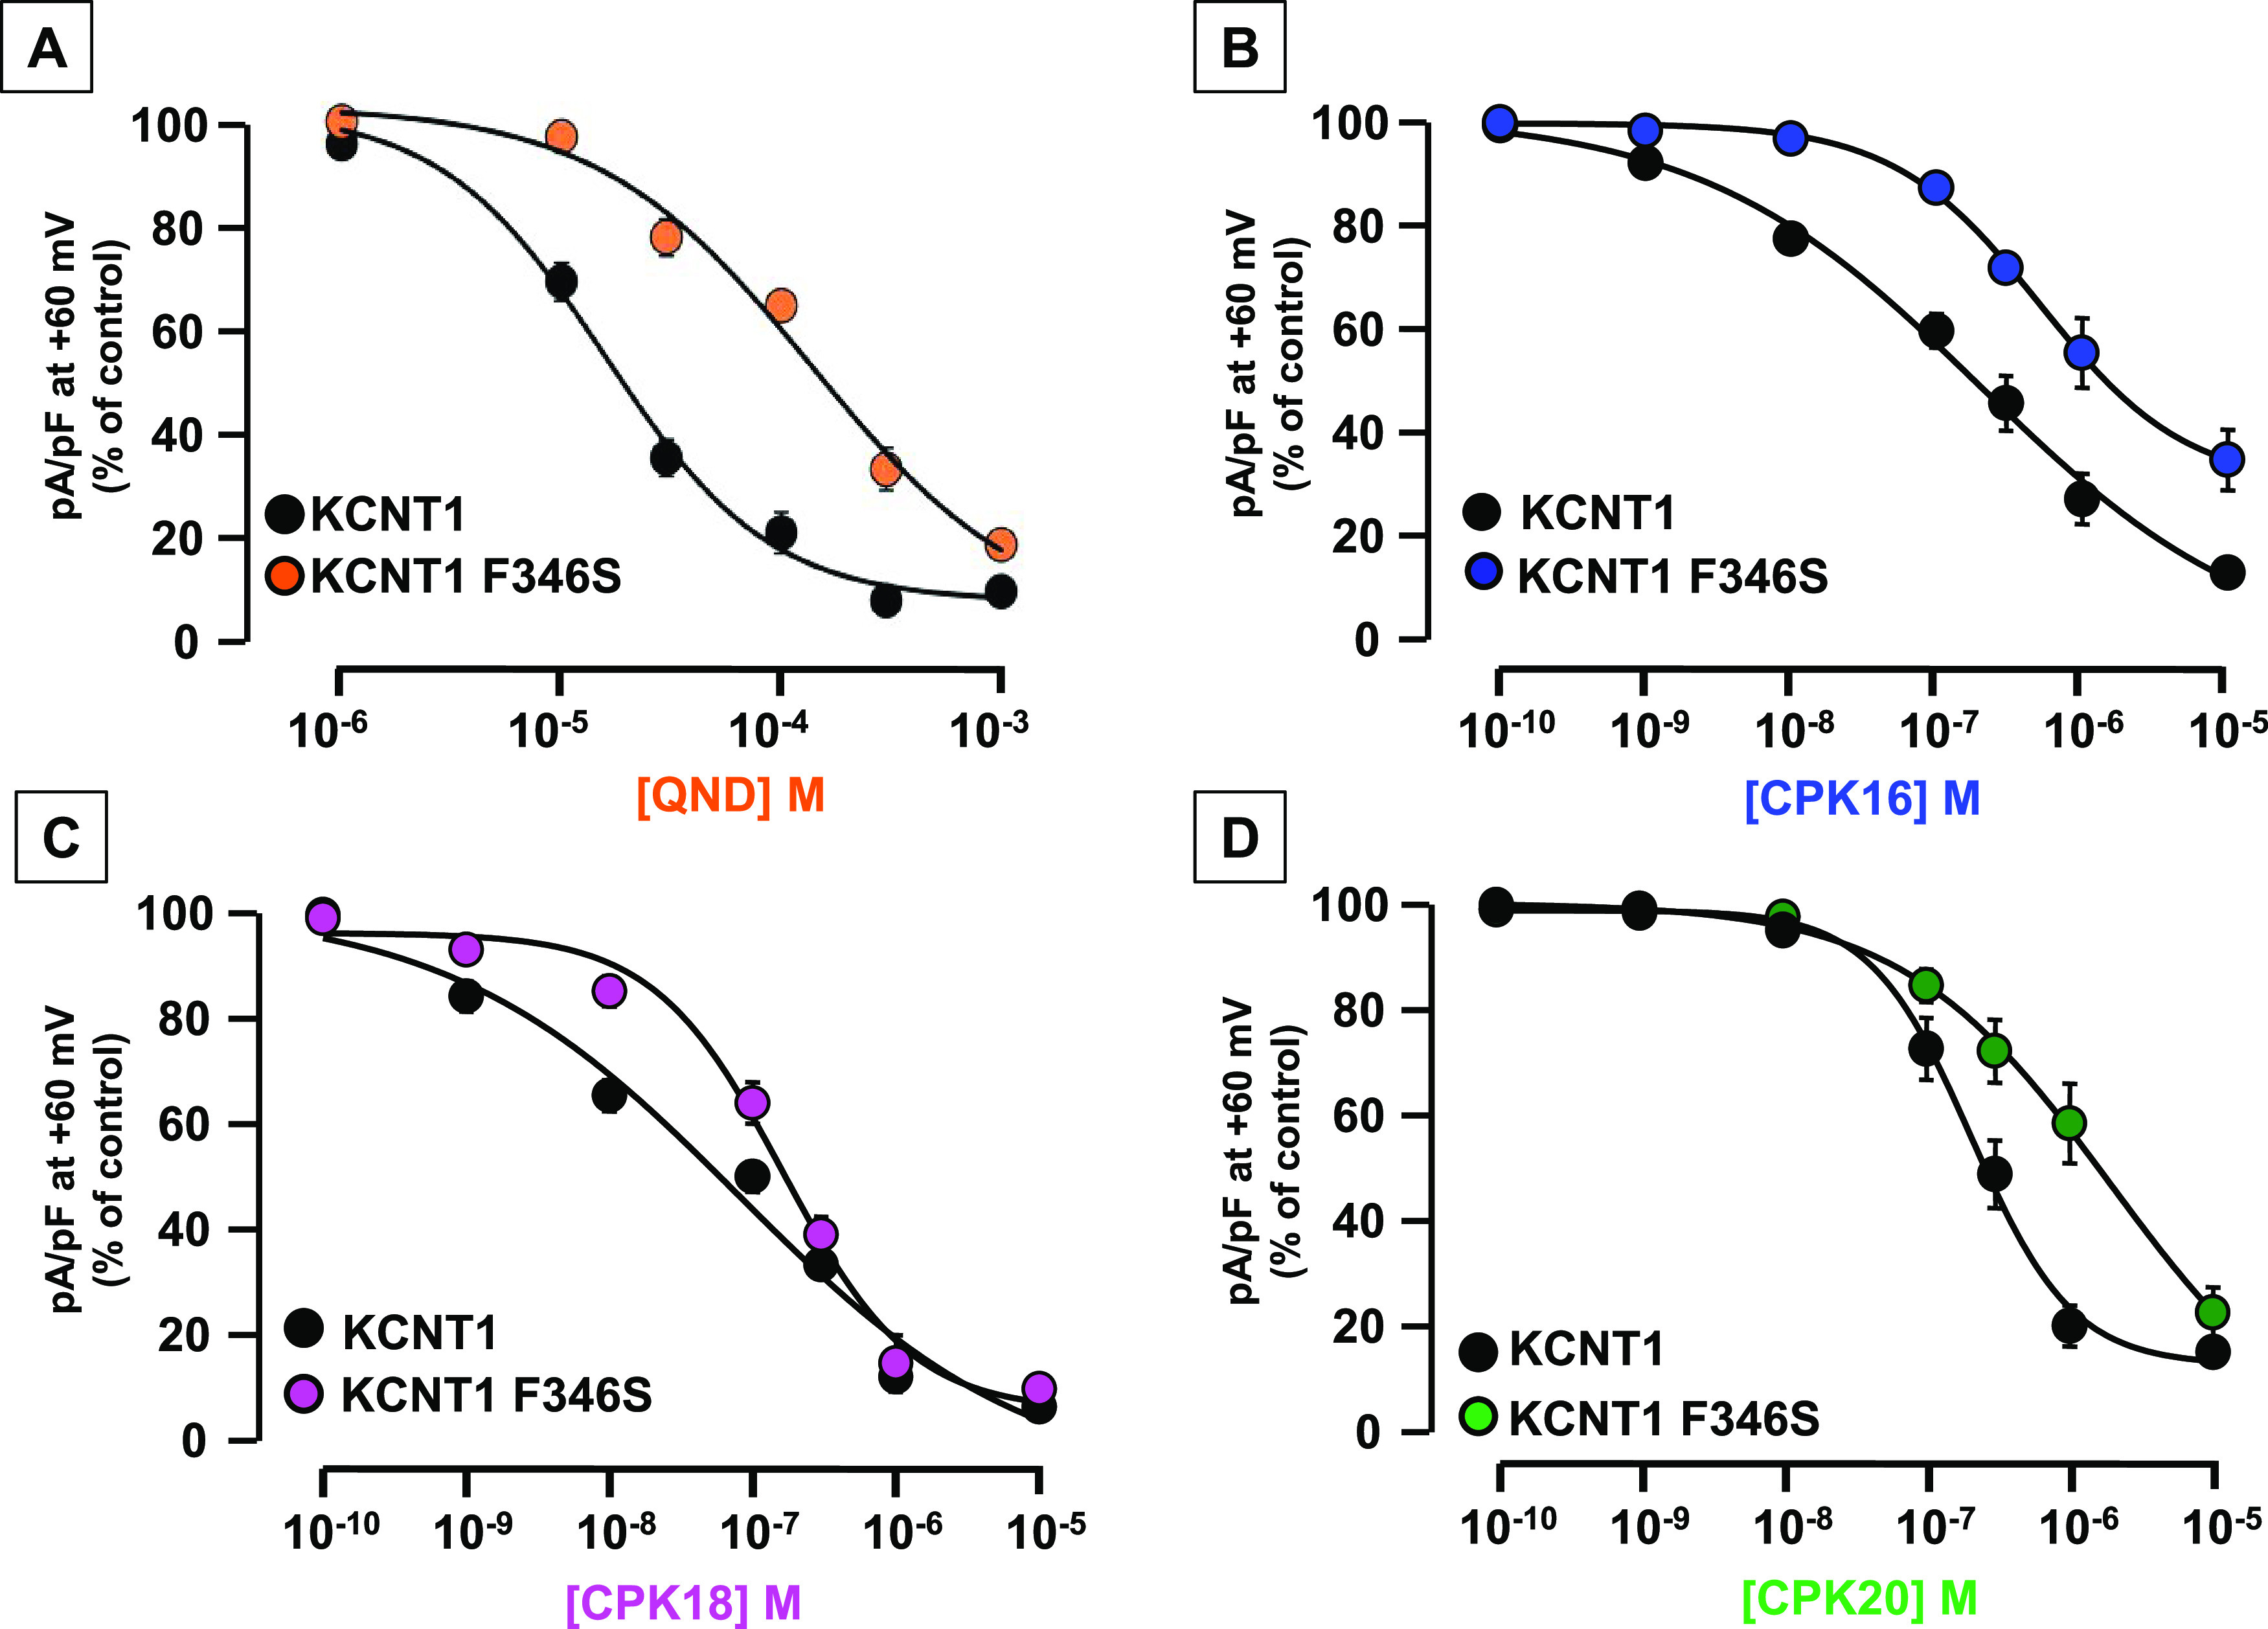
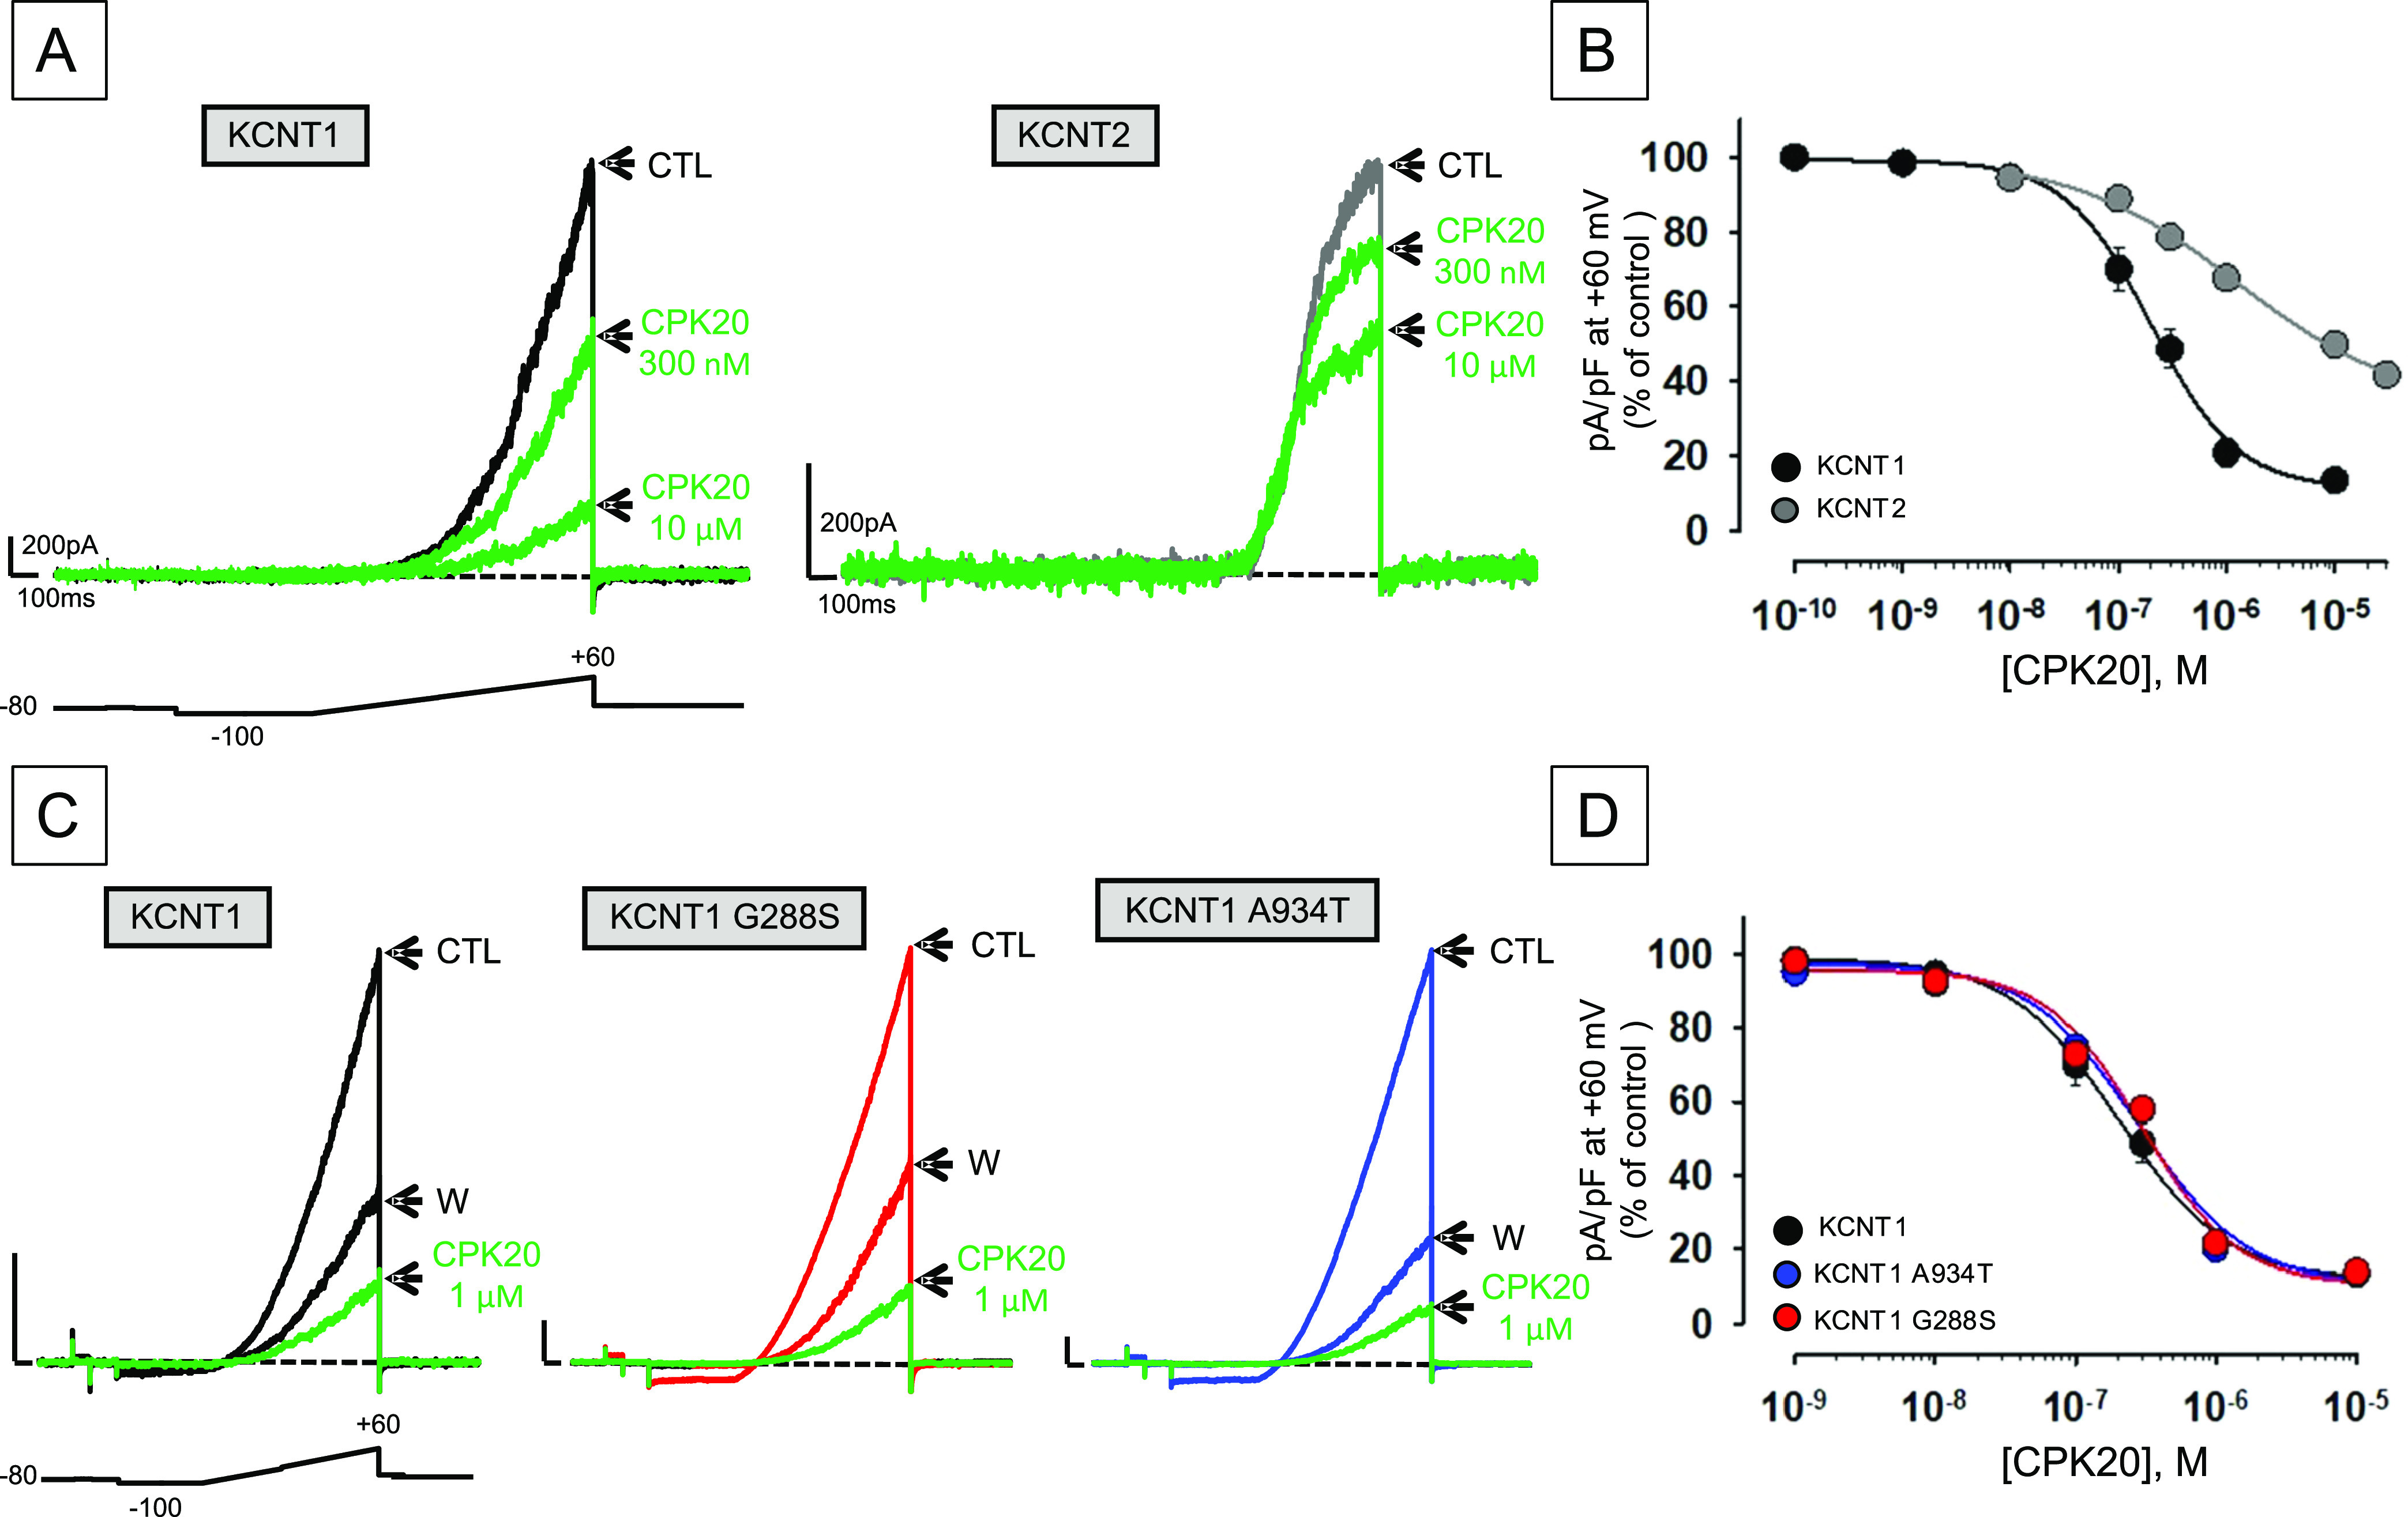
Gain-of-function (GoF) variants in KCNT1 channels cause severe, drug-resistant forms of epilepsy. Quinidine is a known KCNT1 blocker, but its clinical use is limited due to severe drawbacks. To identify novel KCNT1 blockers, a homology model of human KCNT1 was built and used to screen an in-house library of compounds. Among the 20 molecules selected, five (CPK4, 13, 16, 18, and 20) showed strong KCNT1-blocking ability in an in vitro fluorescence-based assay. Patch-clamp experiments confirmed a higher KCNT1-blocking potency of these compounds when compared to quinidine, and their selectivity for KCNT1 over hERG and Kv7.2 channels. Among identified molecules, CPK20 displayed the highest metabolic stability; this compound also blocked KCNT2 currents, although with a lower potency, and counteracted GoF effects prompted by 2 recurrent epilepsy-causing KCNT1 variants (G288S and A934T). The present results provide solid rational basis for future design of novel compounds to counteract KCNT1-related neurological disorders.


Conflict of interest statement

The authors declare no competing financial interest.

Figures

Figure 1
Figure 1
(A) Molecular structures of some previously identified KCNT1 blockers: VU0606170, VU0935685, Compound 31, BC12, and BC13. (B) The in silico workflow that led to the selection of the 20 compounds to be experimentally screened.
Scheme 1
Scheme 1. Synthesis of Final Compound CPK2
Reagents and conditions: (a) (2-Bromoethyl)cyclohexane, potassium tert-butoxide, DMF, 130 °C, overnight; (b) MeOH dry, 3 h, RT then NaBH4, 1 h, RT; (c) benzyl bromide, DIPEA, 100 °C, μW, 20 min.
Scheme 2
Scheme 2. Synthesis of Final Compound CPK3
Reagents and conditions: (a) Benzyl bromide, potassium tert-butoxide, DMF, 130 °C, overnight; (b) TFA/DCM (1/3, v/v), triisopropylsilane, 3 h, RT; (c) triphosgene, 4-amino-1-Boc-piperidine, TEA (to pH 8), THF, reflux, 1 h; (d) MeOH/HCl 2 M (1/1, v/v), reflux, 3 h.
Scheme 3
Scheme 3. Synthesis of Final Compounds CPK5 and CPK10
Reagents and conditions: (a) 4-Chlorobenzoyl chloride, DIPEA, DCM, 2 h, RT; (a′) 4-chlorobenzenesulfonyl chloride, DIPEA, DCM, 2 h, RT; (b) TFA/DCM (1/3, v/v), triisopropylsilane, 3 h, RT; (c) Boc-l-Tyr(2-Br-Z)–OH, HOBt, HBTU, DIPEA, DCM/DMF (4/1, v/v), RT, overnight; (c′) Boc-l-Tyr(tBu)–OH, HOBt, HBTU, DIPEA, DCM/DMF (4/1, v/v), RT, overnight; (d) TFA/DCM (1/5, v/v), triisopropylsilane, 2 h, RT; (e) 4-bromobenzyl bromide, potassium tert-butoxide, DMF, 130 °C, overnight.
Scheme 4
Scheme 4. Synthesis of Final Compound CPK7 and CPK8
Reagents and conditions: (a) Sodium hydride, 4-(iodomethyl)-1,1′-biphenyl, dichloromethane, CH3CN, ultrasounds, 50 °C, 2 h; (b) N,O-dimethylhydroxylamine, HOBt, HBTU, DIPEA, DCM/DMF (4/1, v/v), RT, overnight; (c) LiAlH4 (1 M in THF), THF dry, N2, 0 °C, 10 min; (d) l-Cys-OEt, NaHCO3, EtOH, overnight; (e) benzylamine, triphosgene, TEA, THF, reflux, 1 h; (f) TFA/DCM (1/3, v/v), triisopropylsilane, RT, 3 h.
Scheme 5
Scheme 5. Synthesis of Final Compound CPK18
Reagents and conditions: (a) Benzylamine, HOBt, HBTU, DIPEA, DCM/DMF (4/1, v/v), RT, overnight; (b) TFA/DCM (1/3, v/v), triisopropylsilane, 3 h, RT; (c) 4-phenoxybenzaldehyde, MeOH dry, 3 h, RT then NaBH4, 1 h, RT.
Figure 2
Figure 2
In vitro screening of the CPK library using the fluorescence-based assay FluxOR. (A) Representative curves describing the FluxOR fluorescent signals generated in stably KCNT1-transfected CHO cells and in untransfected CHO cells after incubation with vehicle (VEH) (gray curve) or LOX 10 μM (light blue curve). (B, C) Concentration–response curves of LOX (B) and QND (C) in stably KCNT1-transfected CHO cells. Solid lines represent fits of the experimental data to the four-parameter logistic equation used to estimate EC50/IC50 values. (D) Average FluxOR fluorescence signals obtained in stably KCNT1-transfected CHO cells and in untransfected CHO cells upon incubation with vehicle (VEH) (gray), LOX 10 μM (LOX, light blue), QND at 300 μM (orange), or with CPKs compounds, each at a concentration of 10 μM. QND and CPKs incubation was followed by incubation with LOX 10 μM. * indicates values significantly different (p < 0.05) from LOX (n = 5–13). (E) Concentration–response curves of QND (orange), CPK4 (red), CPK13 (black), CPK16 (blue), CPK18 (magenta), and CPK20 (green) in stably KCNT1-transfected CHO cells. Solid lines represent fits of the experimental data to the four-parameter logistic equation used to estimate IC50 values (n = 5).
Figure 3
Figure 3
(A, B) Predicted bound conformations of QND. KCNT1 subunits are depicted in gray, gold, white, and blue cartoons and sticks, while QND is represented in yellow sticks. Direct H-bonds are represented as magenta dashed lines, water-mediated H-bonds as orange dashed lines, π–π stacking interactions as green dashed lines, and π-cation interactions as red dashed lines. In (A, B), for reference, F312 and F346 are always shown as sticks and the experimental bound conformation of C23 is shown in white transparent sticks. (C) RMSD of QND as a function of MD simulation time. (D) Quindine/KCNT1 interaction diagram. Only residues interacting with the ligand for at least 144 out of 960 ns of MD simulation are shown. Residues are colored according to the following scheme: cyan, polar; green, hydrophobic; gray, water molecule. Gray halos highlight solvent exposure. H-bonds are represented by magenta arrows (dashed when side-chain atoms are involved, solid in the case of backbone atoms involvement); green solid lines represent π–π stacking interactions; red solid lines represent π-cation interactions.
Figure 4
Figure 4
Docking poses of CPK4 (A), CPK13 (B), CPK16 (C), CPK18 (D), and CPK20 (E). KCNT1 subunits are depicted in gray, gold, white, and blue cartoons and sticks, while ligands are represented as yellow sticks. Direct H-bonds are represented as magenta dashed lines, water-mediated H-bonds as orange dashed lines, and π–π stacking interactions as green dashed lines. In every panel, for reference, F312 and F346 are always shown as sticks and the experimental bound conformation of C23 is shown in white transparent sticks.
Figure 5
Figure 5
Ligand interaction diagrams of CPK4 (A), CPK13 (B), CPK16 (C), CPK18 (D), and CPK20 (E) in complex with EMhKCNT1110–354. Only residues interacting with the ligand for at least 72 out of 480 ns of MD simulation are shown. Residues are colored according to the following scheme: Cyan, polar; green, hydrophobic; gray, water molecule. Gray halos highlight solvent exposure. H-bonds are represented by magenta arrows (dashed when side-chain atoms are involved, solid in the case of backbone atoms involvement); green solid lines represent π–π stacking interactions.
Figure 6
Figure 6
Pharmacological characterization of QND and CPK compounds on KCNT1 channels. (A–F) Representative current traces recorded upon exposure to the voltage protocol shown in (A) in CHO cells expressing KCNT1 channels recorded in control solution (CTL), upon perfusion with 10 μM or 1 mM QND (QND; A), 10 μM of the indicated CPK compounds (B–F), or upon drug washout (W). Current scale: 1 nA; time scale: 100 ms. (G–L) Time course of current decrease and recovery in CHO cells expressing KCNT1 channels in the absence or presence of the indicated compounds. (M) Quantification of maximal currents measured in cells expressing KCNT1 channels at +60 mV in experiments like those shown in (A–F) in the presence of the indicated compounds (*=p < 0.05 vs CTL; **=p < 0.05 vs QND). (N) Time constants of the activation kinetics (τon) in seconds for all tested compounds (*=p < 0.05 vs QND; **=p < 0.05 vs CPK4; ***=p < 0.05 vs CPK16).
Figure 7
Figure 7
Effects of QND and CPK compounds on hERG and Kv7.2 channels. (A) Representative whole-cell current traces from hERG channels activated by the indicated ramp protocol recorded in control conditions and upon exposure to 10 μM quinidine (QND), 10 μM of the indicated CPK compounds, or upon drug washout (W). Current scale: 100 pA; time scale: 500 ms. (B) Quantification of the effects of the indicated compounds on hERG currents; data are expressed as the ratio between current amplitude at −100 mV in the presence and absence of 10 μM drugs (Idrug/ICTL); control value was calculated as the ratio between current amplitude at −100 mV at the beginning and after 1 min of perfusion with extracellular solution. Each data point is expressed as the mean ± SEM of at least three cells recorded in at least two independent transfections. * indicates values significantly different (p < 0.05) from control. (C) Representative whole-cell current traces from Kv7.2 channels activated by the indicated ramp protocol recorded in control conditions and upon exposure to 10–30–100 μM QND, 10 μM of the indicated CPK compounds, or upon drug washout (W). Current scale: 200 pA; time scale: 200 ms. (D) Quantification of the effects of the indicated compounds on Kv7.2 currents; data are expressed as the ratio between current amplitude at 0 mV in the presence and absence of 10 μM drugs (Idrug/ICTL); control value was calculated as the ratio between current amplitude at 0 mV at the beginning and after 1 min of perfusion with extracellular solution. Each data point is expressed as the mean ± EM of at least three cells recorded in at least two independent transfections. * indicates values significantly different (p < 0.05) from control.
Figure 8
Figure 8
Concentration–response curves for KCNT1 and KCNT1 F346S inhibition current by (A) QND, (B) CPK16, (C) CPK18, and (D) CPK20. Current density after exposure to each drug concentration was expressed as % of the control current; normalized data were fitted to the following binding isotherm: y = max/(1 + x/EC50)n, where x is the drug concentration and n is the Hill coefficient. Each data point is the mean ± SEM of 3–26 (for QND), 5–45 (for CPK16), 5–81 (for CPK18), or 4–35 (for CPK20) determinations.
Figure 9
Figure 9
Effect of CPK20 on KCNT2 and KCNT1 channels incorporating pathogenic GoF variants. (A, B) Representative current traces (A) and concentration–response curves for inhibition by CPK20 (B) from CHO or HEK cells expressing KCNT1 or KCNT2 channels, as indicated. Current values in control solution (CTL), upon perfusion with the indicated concentrations of CPK20, or upon drug washout (W), were measured at the end of the depolarizing pulse and normalized data were fitted to the following binding isotherm: y = max/(1 + x/EC50)n, where x is the drug concentration and n is the Hill coefficient. Current scale: 200 pA; time scale: 100 ms. Each data point is the mean ± SEM of at least 6 independent determinations. (C, D) Representative current traces (C) and concentration–response curves for inhibition by CPK20 (D) from CHO cells expressing KCNT1, KCNT1 G288S, or KCNT1 A934T channels, as indicated. Current scale: 1 nA; time scale: 100 ms. Data were recorded and analyzed as described for (A, B).

References

    1. Yuan A.; Santi C. M.; Wei A.; Wang Z.-W.; Pollak K.; Nonet M.; Kaczmarek L.; Crowder C. M.; Salkoff L. The Sodium-Activated Potassium Channel Is Encoded by a Member of the Slo Gene Family. Neuron 2003, 37 (5), 765–773. 10.1016/S0896-6273(03)00096-5. - DOI - PubMed
    1. Kaczmarek L. K. Slack, Slick, and Sodium-Activated Potassium Channels. ISRN Neurosci. 2013, 2013, 35426210.1155/2013/354262. - DOI - PMC - PubMed
    1. Xu J.; Lv Y.-T.; Zhao X.-Y.; Wang J.-J.; Shen Z.-S.; Li J.; Zhang F.-F.; Liu J.; Wang X.-H.; Xu Y.; et al. Identification of Sodium- and Chloride-Sensitive Sites in the Slack Channel. J. Neurosci. 2023, 43 (15), 2665–2681. 10.1523/JNEUROSCI.1365-22.2023. - DOI - PMC - PubMed
    1. Franceschetti S.; Lavazza T.; Curia G.; Aracri P.; Panzica F.; Sancini G.; Avanzini G.; Magistretti J. Na+-Activated K+ Current Contributes to Postexcitatory Hyperpolarization in Neocortical Intrinsically Bursting Neurons. J. Neurophysiol. 2003, 89 (4), 2101–2111. 10.1152/jn.00695.2002. - DOI - PubMed
    1. Liu X.; Leung L. S. Sodium-Activated Potassium Conductance Participates in the Depolarizing Afterpotential Following a Single Action Potential in Rat Hippocampal CA1 Pyramidal Cells. Brain Res. 2004, 1023 (2), 185–192. 10.1016/j.brainres.2004.07.017. - DOI - PubMed

Publication types

MeSH terms

Substances