. 2024 Jun 1;41(6):msae093.
doi: 10.1093/molbev/msae093.

Severe Bottleneck Impacted the Genomic Structure of Egg-Eating Cichlids in Lake Victoria

Affiliations

Severe Bottleneck Impacted the Genomic Structure of Egg-Eating Cichlids in Lake Victoria

Minami Imamoto et al. Mol Biol Evol. .

Abstract

Within 15,000 years, the explosive adaptive radiation of haplochromine cichlids in Lake Victoria, East Africa, generated 500 endemic species. In the 1980s, the upsurge of Nile perch, a carnivorous fish artificially introduced to the lake, drove the extinction of more than 200 endemic cichlids. The Nile perch predation particularly harmed piscivorous cichlids, including paedophages, cichlids eat eggs and fries, which is an example of the unique trophic adaptation seen in African cichlids. Here, aiming to investigate past demographic events possibly triggered by the invasion of Nile perch and the subsequent impacts on the genetic structure of cichlids, we conducted large-scale comparative genomics. We discovered evidence of recent bottleneck events in 4 species, including 2 paedophages, which began during the 1970s to 1980s, and population size rebounded during the 1990s to 2000s. The timing of the bottleneck corresponded to the historical records of endemic haplochromines" disappearance and later resurgence, which is likely associated with the introduction of Nile perch by commercial demand to Lake Victoria in the 1950s. Interestingly, among the 4 species that likely experienced bottleneck, Haplochromis sp. "matumbi hunter," a paedophagous cichlid, showed the most severe bottleneck signatures. The components of shared ancestry inferred by ADMIXTURE suggested a high genetic differentiation between matumbi hunter and other species. In contrast, our phylogenetic analyses highly supported the monophyly of the 5 paedophages, consistent with the results of previous studies. We conclude that high genetic differentiation of matumbi hunter occurred due to the loss of shared genetic components among haplochromines in Lake Victoria caused by the recent severe bottleneck.

Keywords: bottleneck; cichlid; genetic diversity; genetic structure; paedophage.


Figures

Fig. 1.
Fig. 1.
Sampling information and localities of 7 haplochromine cichlids endemic to Lake Victoria and A. stappersii as an outgroup. These species were included for genetic statistics comparison. a) Pictures of the 8 species. Colored triangles for paedophages and circles for others next to species names correspond to sampling locations on the map. Paedophages, Haplochromis sp. “matumbi hunter,” and H. microdon was shaded by a yellow box. A photo of A. stappersii was retrieved from Meier, Marques et al. (2017). b) Sampling localities of all samples in a). The area marked by a red square in the bottom left map represents the location of Mwanza Gulf, Lake Victoria, and the map of the enlarged Mwanza Gulf is shown on the right. The number of samples per species obtained in each sampling locality is shown next to markers colored by species, corresponding to the labels in a). Samples without locality information are noted as unknown.
Fig. 2.
Fig. 2.
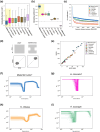
Distinct genetic structure and the signs of a severe bottleneck for matumbi hunter. The Nilotic lineage (A. bloyeti, A. paludinosa, H. gracilior, and T. pharyngalis) and the Congolese lineage (A. stappersii) are added as an outgroup. Paedophages, matumbi hunter, H. microdon, and Lipochromis spp. (L. parvidens, Lip. melanopterus, and L. cryptodon) have asterisks on each name label. a) ADMIXTURE (K = 3) for 97 Lake Victoria haplochromines and outgroup lineages. Paedophages are shaded by a yellow box. Species belonging to “Pundamilia I,” P. nyererei, and five species labeled as part of “Pundamilia spp.” (P. sp. “big blue red,” P. igneopinnis, P. sp. “nyererei-like,” P. sp. “orange,” and P. sp. “pundamilia-like’), are shaded by a light brown box. Labels for all samples are listed in the column “Label in ADMIXTURE” in supplementary table S1, Supplementary Material online. b) Principal Component Analysis (PCA) for 97 Lake Victoria haplochromines with 2 ancestral lineages (square markers) as an outgroup (left) and without an outgroup (right). Haplochromines endemic to Lake Victoria are shaded by gray in the left figure. The PC1 axis is transposed in descending order for graphical purposes for both figures. The contribution rate for each principal component is written on the axis. “Paedophages’ and “Pundamilia I” are plotted as triangle and pentagon markers, respectively. Species belonging to “Pundamilia I,” except for P. nyererei, are plotted as light brown pentagon markers. c) A heatmap of pairwise weighted FST (x-axis vs. y-axis) in a total of 28 pairs for 8 species. FST for the relevant pair is written in a box; for example, the FST between matumbi hunter and H. microdon is 0.37.
Fig. 3.
Fig. 3.
Estimated population genetics statistics and demography of haplochromine species. Paedophages (matumbi hunter and H. microdon) are either shaded by a yellow box or have an asterisk on the name label. a) 10 kb windowed nucleotide diversity (π) across a genome calculated by species. b) Average inbreeding coefficient (F) by species. We calculated F for each sample and then averaged them by species. c) Comparison of LD decay, plotting LD coefficient (r2) of Single Nucleotide Polymorphisms (SNPs) having a distance within 10 kb. H. microdon has been excluded from this analysis because an insufficient number of samples per species may cause a bias in estimating r2. d) Expected correlation between the SROH and the total NROH under certain demographic histories [larger (left) and bottlenecked populations (right)]. Theoretically, a short and small number of ROH regions (both SROH and NROH are smaller) will be detected in a large and expanded population, whereas long and large numbers of ROH (both SROH and NROH are larger) can be observed in a small and bottlenecked population (Ceballos et al. 2018). e) Observed correlation of SROH and NROH. Each plot corresponds to one sample. Homozygous regions lasting more than 150 kb were defined as ROH regions. Some samples showed close values of SROH and NROH, thus plots were overlapped. f and g) Effective population size (Ne) of 4 bottlenecked species [f) matumbi hunter, g) H. microdon, h) H. chilotes, and i) H. sauvagei] in the past 700 generations. The GONE estimate was repeated 200 times, and all results were plotted.
Fig. 4.
Fig. 4.
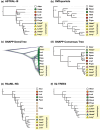
Phylogenies estimated by 4 different methods. Monophyly of paedophages was highly supported by phylogenies estimated by all the methods except for SNAPP. All the trees were rooted on A. burtoni (Abur), a riverine species. Samples are labeled with species name abbreviations: Hmat (matumbi hunter), Hmid (H. microdon), Lpar (L. parvidens), Lmel (Lip. melanopterus), Lcry (L. cryptodon), Pnye (P. nyererei), Ppun (P. pundamilia), Hchi (H. chilotes), Hsau (H. sauvagei), and Lruf (L. rufus). Paedophages are indicated as triangles shared by yellow boxes with asterisks on the name labels. Bootstrap values and posterior probabilities for each node are shown in b), e), f), and a), d), respectively. In b), e), and f), samples that formed monophyletic clades by species were collapsed for graphical purposes, except for P. nyererei (Pnye) in e), which showed a paraphyletic topology (brown outlined white circle). a) A consensus phylogenetic tree obtained by ASTRAL-III estimated from 7,980 gene trees in a 20 kb sliding window with a 5 kb overlap. b) Coalescent tree built by SVDquartets with 100 bootstrap replicates. Note that SVDquartets can estimate only the topology but not the branch length. c) Layered DensiTree drawn from concatenated SNAPP multi-trees and its maximum clade credibility tree d). In DensiTree, the more commonly observed trees are colored in the order of blue, red, and green, while the rest are dark green, respectively. e) The ML tree estimated by RAxML-NG with 200 bootstrap repetitions under the General Time Reversible (GTR) + G4 model. f) The ML tree estimated by IQ-TREE2 with 1,000 ultrafast bootstrap replicates under the Transversion model equal base freq (TVMe) + R5 model.
Fig. 5.
Fig. 5.
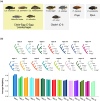
Frequently observed topologies in TWISST matched with the trees built by phylogenetic analyses. a) Groupings used for TWISST analysis. We defined 4 topological groups: 5 paedophages as C-Egg; 3 species often forming monophyletic clades as Clade-I; P. nyererei; and P. pundamilia. b) The 15 possible topologies for the 4 groups defined in a) and their average weightings (the frequency of a certain topology constructed in a SNP window) in 3 window sizes. A. burtoni was set as an outgroup (out). An asterisk indicates paedophages (C-Egg). Three bars for each topology, represented by a unique color, are average weightings observed in the 50 (left), 100 (center), and 300 (right) SNP windows. Bars are shown in descending order of average weightings among the 3 windows.
Fig. 6.
Fig. 6.
Split times of pairs of the 7 species indicated the codiversification of Lake Victoria haplochromines. Samples are labeled with species name abbreviations: Asta (A. stappersii), Hmat (matumbi hunter), Hchi (H. chilotes), Hsau (H. sauvagei), Lruf (L. rufus), Pnye (P. nyererei), and Ppun (P. pundamilia). Paedophages have an asterisk on the name label. The estimation of the split time was repeated 100 times per pair. The per-generation mutation rate was defined as 3.5 × 10⁻⁹, referring to Malinsky et al. (2018). The mean split time among pairs of Lake Victoria cichlids (19,158 yr) was drawn as a dashed line. Split times in pairs of matumbi hunter are colored blue.

Similar articles

Cited by

References

    1. Alexander DH, Novembre J, Lange K. Fast model-based estimation of ancestry in unrelated individuals. Genome Res. 2009:19(9):1655–1664. 10.1101/gr.094052.109. - DOI - PMC - PubMed
    1. Andrews S. FastQC: a quality control tool for high throughput sequence data. 2010. http://www.bioinformatics.babraham.ac.uk/projects/fastqc/.
    1. Bezault E, Mwaiko S, Seehausen O. Population genomic tests of models of adaptive radiation in Lake Victoria region cichlid fish. Evolution. 2011:65(12):3381–3397. 10.1111/j.1558-5646.2011.01417.x. - DOI - PubMed
    1. Bouckaert R, Heled J. DensiTree 2: seeing trees through the forest. bioRxiv. 2014. 10.1101/012401. - DOI
    1. Bouckaert R, Vaughan TG, Barido-Sottani J, Duchêne S, Fourment M, Gavryushkina A, Heled J, Jones G, Kühnert D, De Maio N, et al. BEAST 2.5: an advanced software platform for Bayesian evolutionary analysis. PLoS Comput Biol. 2019:15(4):e1006650. 10.1371/journal.pcbi.1006650. - DOI - PMC - PubMed