. 2024 May 23;15(1):4395.
doi: 10.1038/s41467-024-48305-1.

Angle between DNA linker and nucleosome core particle regulates array compaction revealed by individual-particle cryo-electron tomography

Affiliations

Angle between DNA linker and nucleosome core particle regulates array compaction revealed by individual-particle cryo-electron tomography

Meng Zhang et al. Nat Commun. .

Abstract

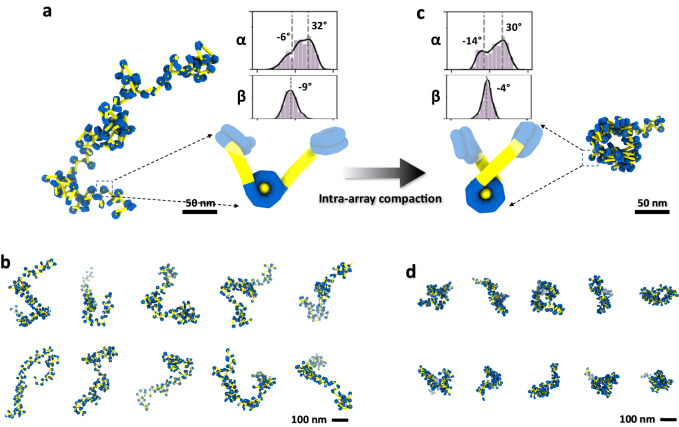
The conformational dynamics of nucleosome arrays generate a diverse spectrum of microscopic states, posing challenges to their structural determination. Leveraging cryogenic electron tomography (cryo-ET), we determine the three-dimensional (3D) structures of individual mononucleosomes and arrays comprising di-, tri-, and tetranucleosomes. By slowing the rate of condensation through a reduction in ionic strength, we probe the intra-array structural transitions that precede inter-array interactions and liquid droplet formation. Under these conditions, the arrays exhibite irregular zig-zag conformations with loose packing. Increasing the ionic strength promoted intra-array compaction, yet we do not observe the previously reported regular 30-nanometer fibers. Interestingly, the presence of H1 do not induce array compaction; instead, one-third of the arrays display nucleosomes invaded by foreign DNA, suggesting an alternative role for H1 in chromatin network construction. We also find that the crucial parameter determining the structure adopted by chromatin arrays is the angle between the entry and exit of the DNA and the corresponding tangents to the nucleosomal disc. Our results provide insights into the initial stages of intra-array compaction, a critical precursor to condensation in the regulation of chromatin organization.


Conflict of interest statement

The authors declare no competing interests.

Figures

Fig. 1
Fig. 1. Structure and morphology of phase separation.
a, A schematic model depicting the structural transition of nucleosomes, from a 10-nm “beads-on-a-chain” structure or loosely-packed polymer state to a fiber-like structure, spinodal condensate, and finally to a spherical condensate through the process of intra-array compaction, inter-array interaction and liquid-droplet formation. b, NS-EM images of the morphology of tetranucleosome incubated with 150 mM, 50 mM and 5 mM Na+, respectively, under room temperature for up to 10 h. The spinodal condensate particles are marked by orange circles, while the spherical condensates are indicated by cyan arrows. The boundary for generating spinodal condensate is depicted by orange dash line, while the boundary to generating the spherical condensate is described by cyan dash line. In this experiment, one grid was prepared for each condition, with ~5-10 grid squares examined and imaged, all showing a similar distribution of particles. c, Three representative area of cryo-ET 3D reconstruction of spherical condensate generated from tetranuclesome in physiological salt concentration as described. Each 3D map showed by its central slice (top left) and zoomed-in portion of the small spherical condensates (top right), which is compared to the 3D density map superimposed with models (the NCP portions are colored by cyan, and DNA linker portions are colored by yellow).
Fig. 2
Fig. 2. Cryo-EM 3D structure and dynamics of mononucleosome.
a, Cryo-EM images, and, b, nine representative particles of mononucleosome in 5 mM Na+. c, Zoomed-in images of two representative particles. Two DNA gyres and the NCP low-density central hole are indicated by orange and yellow arrows, respectively. d, 3D reconstruction process of an individual nucleosome particle, showing by raw image (ground-truth), the mask-free projection of the initial 3D map and the masked projection and final 3D map (column 1 through 4, respectively) at three representative tilting angles. In this experiment, 4 cryo-EM grids were prepared, 10 cryo-ET data sets were acquired, and all isolated particles (47 particles) were targeted for 3D reconstructions as showed in the supplementary Fig. 14-60. e,f, Perpendicular views of the final 3D map displayed by after (gray) and before (cyan) 45 Å Gaussian lowpass filtering, which superimposed with the flexibly fitted model. g, Schematic showing the angles. The orientation of the linker DNA relative to the NCP is defined as the wrapping angle α and the bending angle β, for both entry (cyan) and exit (yellow) side of the NCP. The convention of defining the negative direction as bending away from the NCP is applicable to αen, αex, βen, βex,θF, and θs. hj, Zoomed-in view of the NCP regions of three mononucleosomes, shown with the projection, the final map, and the fitted model, respectively. DNA on the histone is highlighted by yellow arrows. In this experiment, a total of 47 particles were reconstructed as shown in supplementary Fig. 3d-f and 14-60. for statistics. k, 30 representative density maps, shown with fitted models. l, Super-imposed 47 models aligned based on NCP portion. Models color-encoded by the θ angle. m, Histogram of DNA-histone contact positioning. n, Histograms of DNA entry and exit positions to/from NCP. The positive values represent the events of unwrapping against the standard model. o,p, Histograms of the θ angle and its two planar projections θF and θS. q, Scatter plot and correlation between the entry and exit DNA arms. r, Scatter plot and correlation between the wrapping angle α and bending angle β. s, Superimposed vectors of both entry (yellow) and exit (green) DNA linkers on NCP (magenta). t, Histogram of the wrapping angle α and the bending angle β distribution measured from all DNA linkers.
Fig. 3
Fig. 3. Cryo-ET 3D structures illustrating the dynamics of di-, tri- and tetranucleosome array particles.
a, 27 representative cryo-ET density maps from individual particle reconstructions of dinucleosomes in 20 mM HEPES buffer with 5 mM Na+. Each of the density maps is super-imposed with its flexibly fitted model. b, Zoomed-in views of a representative map with its fitting model. DNA color-encoded by their bp index (from yellow to cyan) and histone colored in pink. c, Histograms of the wrapping angle α and the bending angles β. d, Histogram of the core-to-core distance measured between the i and i + 1 NCP. e-h The structure and dynamics of trinucleosomes under same incubation conditions. i–l The structure and dynamics of tetranucleosome under same incubation conditions. m–p The structure and analysis of the same tetranucleosome under higher salt condition (50 mM Na+) after the same incubation time. The red arrow indicates the major change of the peaks.
Fig. 4
Fig. 4. Morphology and 3D structures of tetranucleosome arrays in the presence of H1.
a-c, Cryo-ET central slices s show the morphology of tetranucleosome arrays incubated with 5 mM Na+, 50 mM Na+ and physiological salt, respectively, for 20 min, in the presence of linker histone H1. In these experiments, a total of 3 cryo-EM grids for each condition were prepared, and 4-5 grids areas on each grid were imaged by cryo-ET, in which 4 tilt-series have been used for 3D reconstructions. d, 27 representative cryo-ET 3D density maps and models of tetranucleosome with 5 mM Na+ in the presence of H1. e, Zoomed-in views of four representative tetranucleosome array maps and models (left side of each panel) displaying four typical (I, II, III, and IV) NCP unwrapping/rewrapping conformations in response to the presence of H1. The schematics (right side of each panel) illustrate various 200-bp DNA arm trajectories during its invasion into one of the intermediate NCPs. The entry-, intermediate-, and exit-DNA portion are colored in orange, blue, and green, respectively. Histones are colored in purple. A red dashed line indicates that the second NCP unwrapping results in two spatially separated dinucleosomes. Red triangles mark the conventional H1 binding sites on NCP, while black arrows point to the possible H1 binding sites introduced by the distal DNA arm invasion. f, Histograms of α and β angle distributions and, g, core-to-core distance distributions measured from tetranucleosome NCPs in the presence of H1.
Fig. 5
Fig. 5. Simulating chromatin morphology and conformational regulation mechanism through linker DNA angles.
a, In silico assembly of a chromatin fiber by connecting 100 NCPs (top panel) using the α, β angle distribution (top right panel) and the NCP unwrapping distribution derived from experimental statistics of tetranucleosome arrays in 5 mM Na+. Zoomed-in view of the spatial orientation of a representative NCP (in cyan) with its linker DNA (in yellow). b, Ten additional simulated chromatin fiber (100 NCPs) generated from the same distribution of experimental data. c, In silico assembly of a chromatin fiber (connecting 100 NCPs) based on the experimental distributions of angles and the NCP unwrapping levels measured from the tetranucleosome sample with 50 mM Na+ after 20-min incubation. Zoomed-in view of the NCP (in cyan) with its linker DNA (in yellow). d, Ten more chromatin fibers generated based on the same distribution.

Update of

Similar articles

Cited by

References

    1. Ishihara S, et al. Local states of chromatin compaction at transcription start sites control transcription levels. Nucleic Acids Res. 2021;49:8007–8023. doi: 10.1093/nar/gkab587. - DOI - PMC - PubMed
    1. Olins AL, Olins DE. Spheroid chromatin units (v bodies) Science. 1974;183:330–332. doi: 10.1126/science.183.4122.330. - DOI - PubMed
    1. Luger K, Mader AW, Richmond RK, Sargent DF, Richmond TJ. Crystal structure of the nucleosome core particle at 2.8 angstrom resolution. Nature. 1997;389:251–260. doi: 10.1038/38444. - DOI - PubMed
    1. Maeshima K, Imai R, Tamura S, Nozaki T. Chromatin as dynamic 10-nm fibers. Chromosoma. 2014;123:225–237. doi: 10.1007/s00412-014-0460-2. - DOI - PMC - PubMed
    1. Finch JT, Klug A. Solenoidal model for superstructure in chromatin. Proc. Natl Acad. Sci. USA. 1976;73:1897–1901. doi: 10.1073/pnas.73.6.1897. - DOI - PMC - PubMed