. 2024 May 23;15(1):4388.
doi: 10.1038/s41467-024-48700-8.

Single-cell and spatial transcriptomics analysis of non-small cell lung cancer

Affiliations

Single-cell and spatial transcriptomics analysis of non-small cell lung cancer

Marco De Zuani et al. Nat Commun. .

Abstract

Lung cancer is the second most frequently diagnosed cancer and the leading cause of cancer-related mortality worldwide. Tumour ecosystems feature diverse immune cell types. Myeloid cells, in particular, are prevalent and have a well-established role in promoting the disease. In our study, we profile approximately 900,000 cells from 25 treatment-naive patients with adenocarcinoma and squamous-cell carcinoma by single-cell and spatial transcriptomics. We note an inverse relationship between anti-inflammatory macrophages and NK cells/T cells, and with reduced NK cell cytotoxicity within the tumour. While we observe a similar cell type composition in both adenocarcinoma and squamous-cell carcinoma, we detect significant differences in the co-expression of various immune checkpoint inhibitors. Moreover, we reveal evidence of a transcriptional "reprogramming" of macrophages in tumours, shifting them towards cholesterol export and adopting a foetal-like transcriptional signature which promotes iron efflux. Our multi-omic resource offers a high-resolution molecular map of tumour-associated macrophages, enhancing our understanding of their role within the tumour microenvironment.


Conflict of interest statement

The authors declare no competing interests.

Figures

Fig. 1
Fig. 1. Single-cell transcriptomics reveal the heterogeneity of NSCLC.
A Study overview. Single-cell suspensions of resected tumour tissue, adjacent non-involved tissue (background) and healthy lung from deceased donors were enriched for CD45+ or CD235− and subjected to scRNA-seq. Cryosections of fresh, flash-frozen tumour, background and healthy tissues were used for 10x Visium spatial transcriptomics. B Cohort overview. Symbols represent individual patients and performed analyses. C UMAP projection of tumour and combined background+healthy datasets. D Dotplot of representative genes used for broad cell-type annotations in tumour samples. E Contour plot showing the co-expression of myeloid (LYZ, CD68, MRC1) and epithelial (EPCAM) genes in AT2 cells (44,399 cells), CAMLs (2520 cells) and AIMɸ (16,120 cells). Normalised, scaled and log-transformed gene expression. F Boxplot showing normalised, scaled and log-transformed gene expression of myeloid (LYZ, APOE, CD68, MRC1) and epithelial (EPCAM, KRT8, KRT19) genes in AT2 cells, CAMLs and AIMɸ. Boxes: quartiles. Whiskers: 1.5× interquartile range. G Relative proportion of non-immune cell subsets in tumour and background, calculated within the CD235− enrichment. Arrows indicate increase (↑) or decrease (↓) in tumour versus background. Pairwise comparisons by two-sided Wilcoxon rank test and Bonferroni correction for multiple comparisons. **P < 0.01. Arrows without asterisks indicate that the cell type was found only in tumour or background. H Relative proportion of broad immune cells in tumour and background, calculated within all immune cells identified in the CD235- enrichment. Arrows indicate an increase (↑) or decrease (↓) in tumour versus background. Pairwise comparisons by two-sided Wilcoxon rank test and Bonferroni correction for multiple comparisons. *P < 0.05, **P < 0.01, ***P < 0.001. Arrows without asterisks indicate that the cell type was found only in tumour or background. I Relative proportion of NK, DC, B, T and macrophage subsets within the broad annotations in tumour and background, calculated within the CD235- enrichment. Arrows indicate increase (↑) or decrease (↓) in tumour versus background. Pairwise comparisons by two-sided Wilcoxon rank test and Bonferroni correction for multiple comparisons. ***P < 0.001. Arrows without asterisks indicate that the cell type was found only in tumour or background.
Fig. 2
Fig. 2. Integrated single cell and spatial transcriptomics uncovers different interaction networks in LUAD and LUSC.
A Heatmap showing the Pearson correlation between the relative cell-type abundance for each immune cell type (calculated within the CD235− enrichment). Colour indicates the Pearson correlation value, asterisks indicate the level of significance of the two-sided association test computed on Pearson’s product-moment correlation coefficients (*P < 0.05, **P < 0.01, ***P < 0.001). B Heatmap showing the number of LR interactions between all cell types summarised by broad cell annotations in LUAD (left) and LUSC (right). Rows were hierarchically clustered using the complete linkage method on euclidean distances. C Sankey diagram showing the tumour-specific interactions in LUAD and LUSC for selected ICIs detected by cellphoneDB. Line colour identifies whether the LR interaction between each cell type was found in LUAD only (orange), in LUSC only (green) or in both tumour types (blue). D Dotplot for the ICI genes and cell types highlighted in (C), split by tumour type. The size of each dot represents the percentage of cells in the cluster expressing the gene, while the colour represents the mean normalised scaled log-transformed expression of each gene in each group. E Sankey diagram showing the tumour-specific interactions in LUAD and LUSC for VEGFA/B interactors detected by cellphoneDB. Line colour identifies whether the LR interaction between each cell type was found in LUAD only (orange), in LUSC only (green) or in both tumours (blue). F Sankey diagram showing the tumour-specific interactions in LUAD and LUSC for EGFR interactors detected by cellphoneDB. Line colour identifies whether the LR interaction between each cell type was found in LUAD only (orange), in LUSC only (green) or in both tumours (blue).
Fig. 3
Fig. 3. 10x Visium confirms the spatial colocalization of key ligand–receptor pairs.
A Spatial images depicting the cell abundance estimated by cell2location for AT2 cells, AIMɸ and Tregs on a representative tumour section. B Relative proportion of immune (left) and non-immune (right) cell types calculated on the cell abundance estimations by cell2location in tumour and background sections. Immune cells were grouped according to their broad annotations. Arrows indicate an increase (↑) or a decrease (↓) in the tumour, compared to the background. Pairwise comparisons were performed with a two-sided Wilcoxon rank test and Bonferroni correction for multiple comparisons. *P < 0.05, **P < 0.01, ***P < 0.001. Arrows without asterisks indicate that the cell type was found only in the tumour or background. Please refer to Supplementary Data 13 and 14 for the exact P values. C Heatmap of spatial LR colocalization. LR gene pair co-expression was estimated in each spot for all sections, and the frequency of colocalising vs. non-colocalising spots in the tumour and background was compared using a χ2 test followed by Bonferroni multiple comparison correction. Dark-grey tiles indicate that the frequency of colocalising gene pairs was significantly different in tumour and background sections. Green column annotations indicate the LR pairs which were significant in at least four out of eight patients. Row annotations indicate tumour type. D Boxplot showing the frequency of colocalising LR pairs significantly different in tumour vs background in each section analysed. N = 8 patients. Boxes are plotted with default settings in the Python Seaborn package, i.e., boxes show quartiles with whisker length being 1.5 times the interquartile range. Source data is provided as a Source Data file. E Spatial images depicting the location of spots in which the LR pair was found co-expressed in tumour (top) and background (bottom), for NRP1-VEGFA, NECTIN2-TIGIT, PD1-PDL1, CD96-NECTIN1 and HAVCR2-LGALS9. Representative sections from one patient.
Fig. 4
Fig. 4. CAMLs share tumour CNAs and colocalise with tumour cells.
A CNA analysis. The plot shows chromosomal gains (red lines) and losses (blue lines) estimated by CopyKat in each chromosome arm for different cell types and patients in the tumour dataset. All immune cell types were grouped together for plotting purposes. B PAGA graph overlaid on the diffusion maps (force-directed layout—FLE embedding) computed for non-immune cell types in tumour. C First three panels—Representative blind annotations from a qualified pathologist, indicating the areas of tumour infiltration (left), binning of the tumour area on the Visium spots (centre) and the spots that passed QC (right). The last three panels—cell2location estimation for AT2 cells (left), Cycling AT2 cells (centre) and Atypical epithelial cells (right) on the same sections, overlaid with the pathologist’s annotation for the tumour infiltration (green contour). D Overrepresentation analysis on gene ontology—biological processes (GO:BP) and REACTOME database by clusterProfiler R package, using DEGs upregulated by AT2 cells in tumour vs background. Source data is provided as a Source Data file. E Detailed overview of CNAs in AT2 and CAMLs from the tumour of one representative patient. Bars indicate the frequency of cells harbouring chromosomal gains (red bar) or losses (blue bars) in specific chromosomal regions. F Scatterplot of the KL divergence for losses (x axis) and gains (y axis) between each cell type in the tumour dataset calculated using their gain and loss distribution. All immune cell types were grouped together for plotting purposes. G Spatial images depicting the cell abundance estimated by cell2location for AT2 cells and CAMLs on three representative tumour sections. H Hierarchical clustering of the correlation distance calculated on cell-type composition (as estimated by cell2location) across spots that passed QC in all tumour sections. I Non-negative matrix factorisation built on the q05 estimation of cell-type abundance across spots that passed QC (as estimated by cell2location) in all tumour sections.
Fig. 5
Fig. 5. Tumour macrophages undergo oncofoetal reprogramming.
A Volcano plot of DEGs (red) for AIMɸ in tumour vs background, extracted using the py_DESeq2 package. B Overrepresentation analysis on gene ontology—biological processes database by clusterProfiler R package, using the DEGs upregulated by Alveolar Mɸ and AIMɸ in tumour vs background. Source data is provided as a Source Data file. C IHC for CD68 and neutral lipids (BODIPY 493/503) on tumour and background tissue sections. Maximum intensity projection of Z-stacks. Scale bar 50 µm. D Area covered by the BODIPY signal in tumour and background section. The difference in BODIPY area coverage was determined with a paired, two-sided t test, matching tumour and background sections from the same patients. N = 5 patients. Source data is provided as a Source Data file. E IHC for CD68 and STAB1 on tumour (left) and background (right) tissue sections. Maximum intensity projection of Z-stacks. Inlets show a detailed magnification on a single cell. Scale bar 20 µm. F Quantification of STAB1+ cells within the CD68+ macrophage population. The fraction of the STAB1 + CD68+ area is shown as a percentage of the total CD68+ area. Data are presented as mean value and standard deviation (n = 3 biological replicates). Source data is provided as a Source Data file. G Staining for CD68, STAB1 and PanCK on tumour tissue sections. Maximum intensity projection of Z-stacks. Inlets show a detailed magnification on a single cell. Scale bar 20 µm. H Quantification of STAB1 + CD68+ cells within the CD68+ macrophage population in NSCLC. Data are presented as mean value and individual data points (n = 2 biological replicates). Source data is provided as a Source Data file. I Dotplot showing the expression of the “STAB1 signature genes” across all macrophage subsets and CAMLs in tumour. J Volcano plot of DEGs identified by py_DESeq2 (red) for Alveolar Mɸ vs STAB1 Mɸ in tumour. K Overrepresentation analysis on gene ontology— biological processes database by clusterProfiler R package, using the DEGs from Alveolar Mɸ vs STAB1 Mɸ (top) and AIMɸ vs STAB1 Mɸ (bottom) in tumour (left—upregulated by STAB1 Mɸ; right—upregulated by Alveolar Mɸ or AIMɸ). Source data is provided as a Source Data file.
Fig. 6
Fig. 6. STAB1 + Mɸ undergo oncofoetal reprogramming.
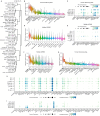
A Hierarchical clustering of the correlation distance calculated on each cell in the harmonised (tumour myeloid + background myeloid + foetal lung myeloid) PC space. B Violin plot showing the expression level of the “STAB1 gene signature” across myeloid cell and progenitor populations identified in a publicly available human foetal lung atlas. C Dotplot of the expression of each gene in the “STAB1 gene signature” in selected foetal lung macrophage populations. The size of each dot represents the percentage of cells in the cluster expressing the gene, while the colour represents the mean expression of each gene in each cluster. D Violin plot showing the expression level of the “STAB1 gene signature” across the clusters identified in the publicly available MoMac-VERSE dataset. E Dotplot of the expression of each gene in the “STAB1 gene signature” in selected macrophage populations from the MoMac-VERSE. The size of each dot represents the percentage of cells in the cluster expressing the gene, while the colour represents the mean expression of each gene in each cluster. F Violin plot showing the expression level of the “AMɸ gene signature” across myeloid cell and progenitor populations identified in the publicly available “MoMac-VERSE” dataset. G Violin plot showing the expression level of the “AMɸ gene signature” across myeloid cell and progenitor populations identified in a publicly available human foetal lung atlas. H Dotplot of the expression of each gene in the “AMɸ gene signature” in selected macrophages populations identified in the “MoMac-VERSE” dataset. The size of each dot represents the percentage of cells in the cluster expressing the gene, while the colour represents the mean expression of each gene in each cluster. I Dotplot of the expression of each gene in the “AMɸ gene signature” in selected foetal lung macrophage populations. The size of each dot represents the percentage of cells in the cluster expressing the gene, while the colour represents the mean expression of each gene in each cluster.

References

    1. Sung, H. et al. Global cancer statistics 2020: GLOBOCAN estimates of incidence and mortality worldwide for 36 cancers in 185 countries. CA. Cancer J. Clin. 71, 209–249 (2021). - PubMed
    1. Siegel RL, Miller KD, Jemal A. Cancer statistics, 2018. Ca. Cancer J. Clin. 2018;68:7–30. doi: 10.3322/caac.21442. - DOI - PubMed
    1. Nicholson AG, et al. The International Association for the Study of Lung Cancer Lung Cancer Staging Project: proposals for the revision of the clinical and pathologic staging of small cell lung cancer in the forthcoming eighth edition of the TNM classification for lung cancer. J. Thorac. Oncol. 2016;11:300–311. doi: 10.1016/j.jtho.2015.10.008. - DOI - PubMed
    1. Mantovani A, Allavena P, Marchesi F, Garlanda C. Macrophages as tools and targets in cancer therapy. Nat. Rev. Drug Discov. 2022;21:799–820. doi: 10.1038/s41573-022-00520-5. - DOI - PMC - PubMed
    1. DeNardo DG, Ruffell B. Macrophages as regulators of tumour immunity and immunotherapy. Nat. Rev. Immunol. 2019;19:369–382. doi: 10.1038/s41577-019-0127-6. - DOI - PMC - PubMed

MeSH terms