. 2024 May 23;15(1):4385.
doi: 10.1038/s41467-024-48685-4.

Translation initiation factor eIF1.2 promotes Toxoplasma stage conversion by regulating levels of key differentiation factors

Affiliations

Translation initiation factor eIF1.2 promotes Toxoplasma stage conversion by regulating levels of key differentiation factors

Fengrong Wang et al. Nat Commun. .

Abstract

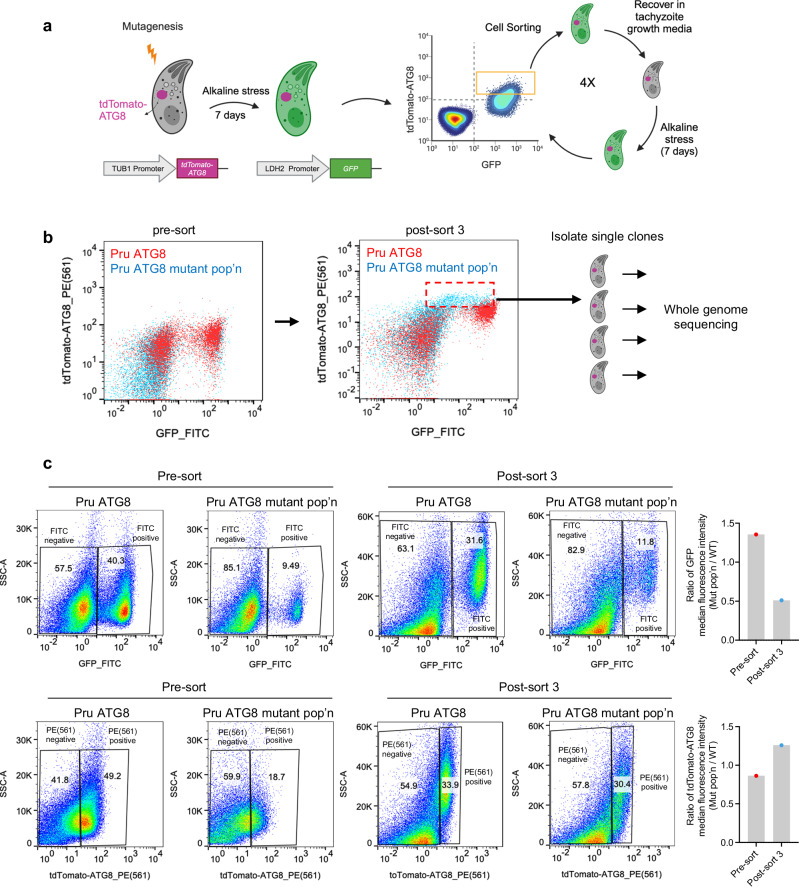
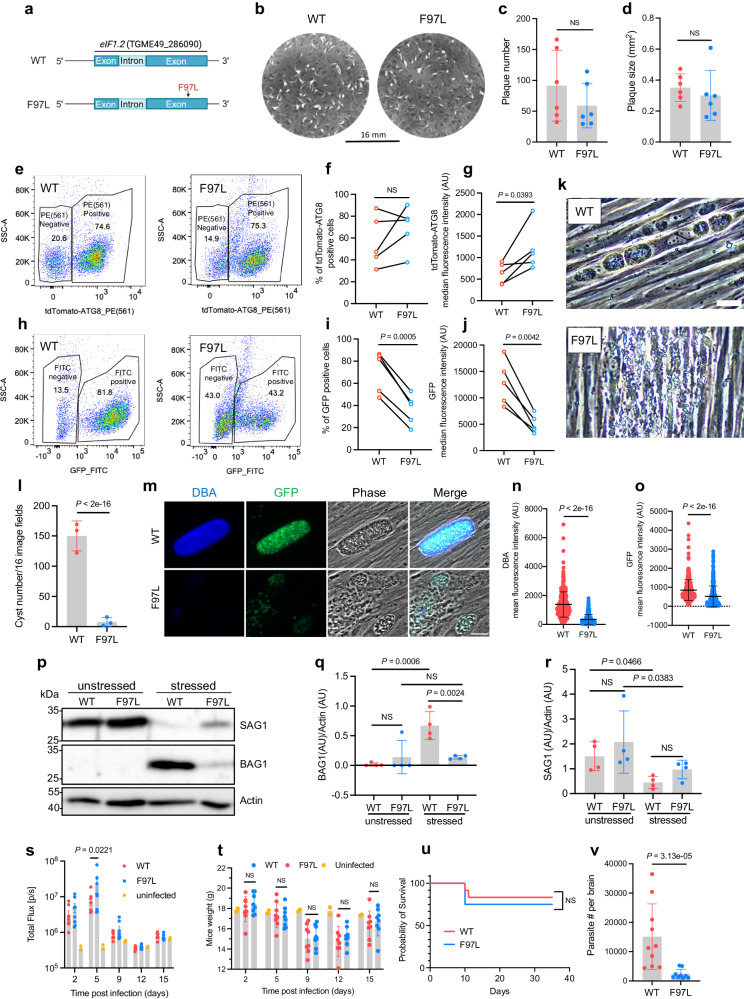
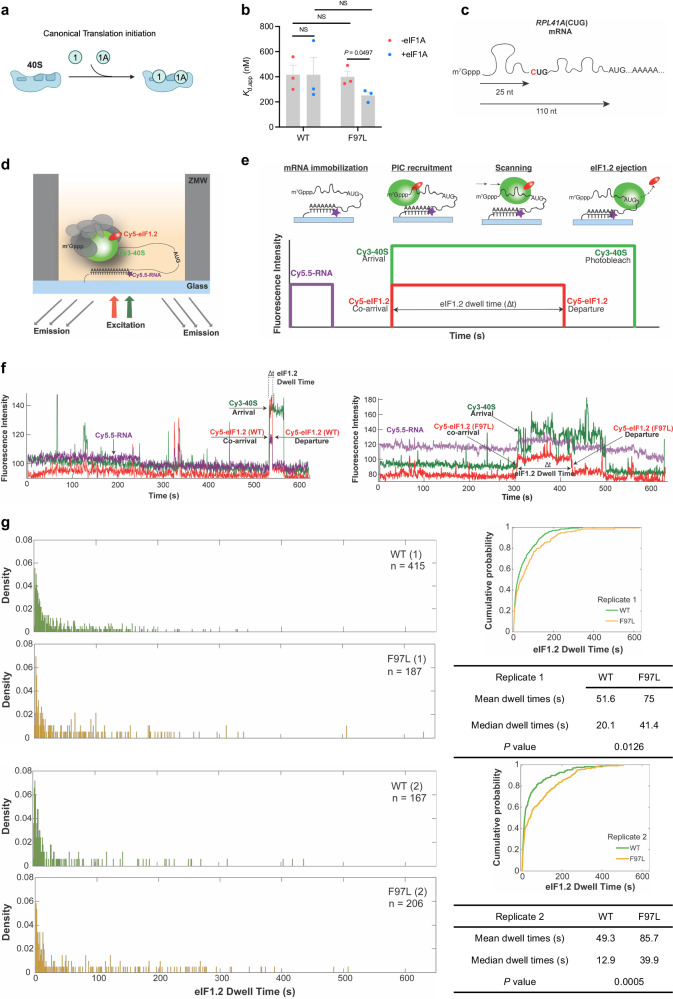
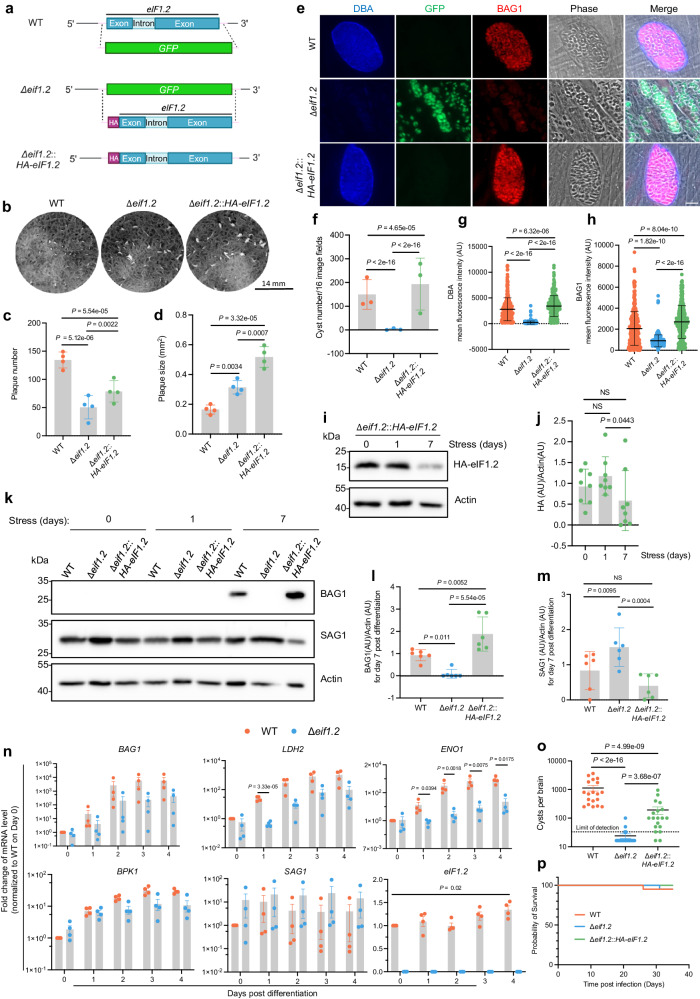
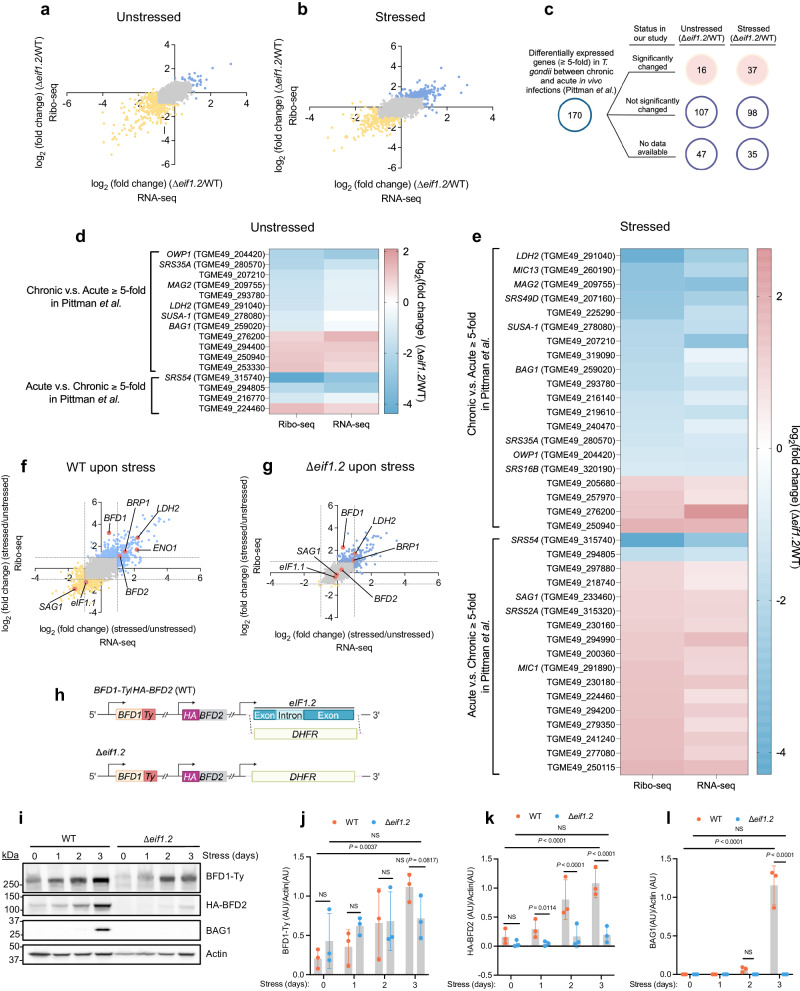
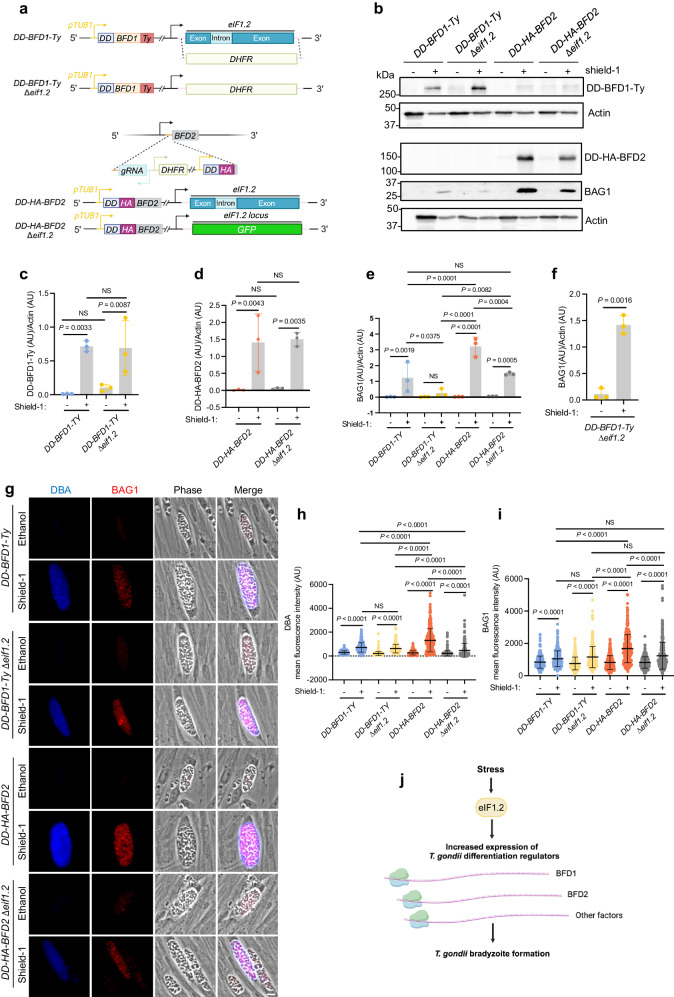
The parasite Toxoplasma gondii persists in its hosts by converting from replicating tachyzoites to latent bradyzoites housed in tissue cysts. The molecular mechanisms that mediate T. gondii differentiation remain poorly understood. Through a mutagenesis screen, we identified translation initiation factor eIF1.2 as a critical factor for T. gondii differentiation. A F97L mutation in eIF1.2 or the genetic ablation of eIF1.2 (∆eif1.2) markedly impeded bradyzoite cyst formation in vitro and in vivo. We demonstrated, at single-molecule level, that the eIF1.2 F97L mutation impacts the scanning process of the ribosome preinitiation complex on a model mRNA. RNA sequencing and ribosome profiling experiments unveiled that ∆eif1.2 parasites are defective in upregulating bradyzoite induction factors BFD1 and BFD2 during stress-induced differentiation. Forced expression of BFD1 or BFD2 significantly restored differentiation in ∆eif1.2 parasites. Together, our findings suggest that eIF1.2 functions by regulating the translation of key differentiation factors necessary to establish chronic toxoplasmosis.


Conflict of interest statement

The authors declare no competing interests.

Figures

Fig. 1
Fig. 1. A mutagenesis screen uncovered T. gondii mutants exhibiting decreased GFP expression driven by the LDH2 promoter.
a Illustration of ENU-mediated mutagenesis and FACS for enriching parasite mutants with increased autophagy signal during the bradyzoites stage. b Representative flow cytometry pseudocolor plots demonstrating the intensities of tdTomato-ATG8 and GFP (driven by the bradyzoite-specific LDH2 promoter) for parasites before or after three rounds of sorting. The final enriched population (pop’n) (red dashed box) were subcloned and subjected to whole genome sequencing. c Quantification of GFP and tdTomato-ATG8 intensities before and after three rounds of sorting. As different voltage settings were used for GFP and tdTomato-ATG8 for before and after the three rounds of sorting, direct comparison of absolute median fluorescence intensity values is not feasible. Therefore, median fluorescence intensities for GFP or tdTomato-ATG8 in the mutant population were divided by those in the WT to obtain the ratio of median fluorescence intensity (mut pop’n/WT), as depicted in the bar graphs. The numbers in the pseudocolor plots represent the percentage of the gated population relative to the total population. Source data are provided as a Source Data file.
Fig. 2
Fig. 2. F97L mutation in eIF1.2 led to a differentiation defect in vitro and low cyst burden in vivo.
a eIF1.2 F97L mutant. bd Plaque assay. Mean ± s.d. for 6 biological replicates. NS, not significant (P > 0.05); Student’s two-tailed t-test. eo Parasites exposed for 7 days to alkaline stress. ej Flow cytometry analysis and quantification of tdTomato(+) and GFP(+) cell percentage (f, i) and intensity (g, j) in total ungated population. Numbers in (e) and (h) represent the percentage of the gated population relative to the total population. Data conducted on the same day were connected by a line. AU, arbitrary units. n = 5 biological replicates; NS, not significant (P > 0.05); Student’s two-tailed t-test. k Phase contrast microscopy images. Bar, 50 μm. l In vitro cysts count. Mean ± s.d. for n = 3 biological replicates; P-values derived from a Poisson model. m Immunofluorescence images. Bar, 20 µm. n, o Quantification of DBA and GFP signals within individual vacuoles. Mean ± s.d. for at least n = 300 vacuoles from 3 biological replicates. Data were analyzed with a linear regression model. pr Western blot analysis. Stressed, 7 days of alkaline stress. Actin, loading control. Mean ± s.d for 4 biological replicates. Data were analyzed using a linear mixed model. NS, not significant (P > 0.05). s Bioluminescence imaging. Uninfected (n = 2 mice), WT (n = 8 mice), eIF1.2 F97L (n = 8 mice). Data represent mean ± s.e.m. and analyzed using a linear regression model. t Mice (s) body weight. Uninfected (n = 2 mice), WT (n = 8 mice), eIF1.2 F97L (n = 8 mice). Data represent mean ± s.d. and were analyzed using a linear regression model. NS, not significant (P > 0.05). u Mice survival curve. n = 12 mice for each group. NS, not significant (P > 0.05); Mantel-Cox two-sided test. v qPCR analysis of parasite burden in mice brain. WT (n = 10 mice), eIF1.2 F97L (n = 9 mice). Data represent mean ± s.d. and analyzed using Welch’s two-tailed t-test. Source data are provided as a Source Data file.
Fig. 3
Fig. 3. eIF1.2 F97L affects the scanning dynamics of preinitiation complex.
a Model illustrating eIF1 and eIF1A binding to 40 S ribosome subunit during translation initiation. b Gel shift assay quantification. Kd,app, or the apparent equilibrium dissociation constant, measures the strength of the interaction between T. gondii eIF1.2 (WT or F97L) and the yeast 40 S subunit, with and without yeast eIF1A. P-values were calculated using Student’s two-tailed t-test. NS, not significant (P > 0.05). Mean ± s.e.m for 3 biological repeats. c Generation of the RPL41A(CUG) mRNA by mutating the 5’ proximal AUG site to CUG. d Schematic for single-molecule fluorescence experiments. Reconstituted chimeric PICs containing T. gondii Cy5-eIF1.2 (WT or F97L), yeast Cy3-40S, unlabeled yeast eIFs 1 A, 2, 3, 4 A, 4B, 4 G, 4E, 5, tRNA-Met, ATP, and GTP were pre-assembled and delivered to immobilized Cy5.5-RPL41A mRNA. ZMWs were illuminated with red and green lasers and the resulting fluorescence was collected and analyzed. e Cy5.5-mRNA fluorescence (purple) at the start of the movie, and terminated by a single photobleaching event, indicates a single mRNA is immobilized on the ZMW surface. mRNA recruitment of Cy5-eIF1.2/Cy3-40S PICs results in simultaneous appearance of green (40 S) and red (eIF1.2) fluorescence. The PIC then scans the mRNA until it locates an initiation site, corresponding to the time interval with sustained, continuous green and red fluorescence (denoted by an arrow). PIC mRNA start-site location triggers rapid eIF1.2 ejection, reflected by loss of red (eIF1.2) fluorescence with retention of green (40 S) fluorescence. The interval (“dwell time”) between co-appearance of Cy3/Cy5 signals and loss of Cy5-eIF1.2 fluorescence is quantified across at least 100 molecules, to generate a dwell-time distribution for each experimental condition. f Representative traces of dwell times for WT and F97L eIF1.2. g Comparison of dwell time distributions, cumulative distributions, and summary (mean, median, P-value) for T. gondii WT and F97L eIF1.2 on RPL41A(CUG) mRNA. 2 biological replicates were performed. n in the distribution plots represents the total number of scanning events which equals to number of molecules. P values were calculated by Wilcoxon rank-sum two-sided test. Source data are provided as a Source Data file.
Fig. 4
Fig. 4. eIF1.2 is essential for tachyzoite growth and bradyzoite formation.
a Generation of ∆eif1.2 and HA-eIF1.2 complemented strains. b Plaque assays. c, d Quantification of b. Mean ± s.d. for 4 biological replicates. P value was calculated using a linear mixed model. e Representative immunofluorescence images of parasites exposed for 7 days to alkaline stress. Bar, 10 µm. f In vitro cysts count. Mean ± s.d. for 3 biological replicates; A Poisson model was used to calculate P-value. g, h Quantification of mean fluorescence intensity for DBA and BAG1 within individual vacuoles. AU, arbitrary units. Mean ± s.d. for 3 biological replicates. A minimum of 100 vacuoles were quantified for each condition within each replicate. Data were analyzed with a linear regression model. im Western blot analysis of parasites exposed for 0, 1 and 7 days to alkaline stress. Actin, loading control. j, l m Quantification of western blot results. Data represent mean ± s.d. The HA-eIF1.2/Actin ratios were from 8 biological replicates and analyzed using a linear regression model. The BAG1/Actin or SAG1/Actin ratios were calculated from 6 biological replicates and analyzed using a linear mixed model. NS, not significant (P > 0.05). n qRT-PCR analysis of parasites exposed to alkaline stress for various days. TUB1, loading control. BAG1, LDH2, ENO1 and BPK1 are bradyzoite-specific markers. SAG1, tachyzoite-specific marker. Mean ± s.e.m. for 4 biological replicates. eIF1.2: linear scale, other genes: logarithmic scale. P values for a specific day were calculated using Welch’s two-tailed t-test combined with a Bonferroni correction. o Brain cyst burden in mice at 5 weeks post-infection. The detection limit is 33 cysts per brain. Brain tissue samples with undetected cysts were assigned 16.5 cysts per brain, half the detection limit. Data represent mean ± s.e.m. Total number of mice analyzed: WT (n = 19), ∆eif1.2 (n = 20), ∆eif1.2::HA-eif1.2 (n = 19). P-value was calculated using a linear regression model. p Survival curve of infected mice. n = 20 mice for each group. Mantel-Cox two-sided test revealed no significant differences among the 3 infected groups. Source data are provided as a Source Data file.
Fig. 5
Fig. 5. eIF1.2 regulates the expression of stage-specific factors, including BFD1 and BFD2.
ag The impact of eIF1.2 deletion on transcription and translation. RNA-seq, RNA sequencing. Ribo-seq, Ribosome profiling. n = 3 biological replicates. a, b, f, g Blue dots, genes increased for at least 2-fold (Padj < 0.05). Yellow dots, genes decreased for at least 2-fold (Padj < 0.05). Padj values were derived using DeSeq2, employing a two-sided test with adjustments for multiple comparison. Grey dots, not significantly changed genes. Pink dots, genes of interest. Grey dotted lines indicate where the y-axis or x-axis equals 1 or −1. Stressed, 1 day of alkaline stress. a Comparison of unstressed ∆eif1.2 and WT (ME49∆ku80) parasites at transcription and translational levels. b Comparison of stressed ∆eif1.2 and WT (ME49∆ku80) parasites at transcription and translational levels. ce Comparing our RNA-seq and Ribo-seq results with a RNA-seq dataset for in vivo acute and chronic infection. Listed significantly changed genes in our study have a fold change greater than 2 or less than 0.5 in either RNA-seq, Ribo-seq or both, with Padj < 0.05, and minimum of 5 reads. d Heatmap illustrates the fold change of the 16 genes that were significantly altered between unstressed ∆eif1.2 and WT parasites in our study (Padj < 0.05). e Heatmap illustrates the fold change of the 37 genes that were significantly altered between stressed ∆eif1.2 and WT parasites in our study (Padj < 0.05). f The impact of alkaline stress on transcription and translation in WT parasites. g The impact of alkaline stress on the transcription and translation in ∆eif1.2 parasites. h Knocking out eif1.2 in a strain with both BFD1 and BFD2 tagged. i Western blot analysis of lysates from parasites exposed to alkaline stress for indicated days. Actin was used as a loading control. jl Quantification of western blot results. Data represent the mean ± s.d. n = 3 biological replicates. The ratios of BFD1-Ty/Actin, HA-BFD2/Actin and BAG1/Actin were analyzed using a linear mixed model. NS, not significant (P > 0.05). Source data are provided as a Source Data file.
Fig. 6
Fig. 6. Stabilization of BFD1 or BFD2 triggers differentiation in Δeif1.2 parasites.
a Stabilization of BFD1 or BFD2 in WT or ∆eif1.2 parasites. b Western blot analysis of lysates from parasites treated with vehicle control (100% ethanol) or 3 µM Shield−1 for 4 days. Actin, loading control. The actin and DD-BFD1-Ty were from the same sample but run on separate blots due to a bubble in one of the original actin bands on the same blot as DD-BFD1-Ty. Uncropped images for both the current actin and previous actin blots are provided in the Source Data for (b). cf Quantification of western blot results. AU, arbitrary units. Data represent the mean ± s.d. n = 3 biological replicates. The DD-BFD1-Ty/Actin ratio was analyzed using a linear regression model. The DD-HA-BFD2/Actin or BAG1/Actin ratios were analyzed using a linear mixed model. NS, not significant (P > 0.05). e The BAG1 signals were captured when BAG1 bands in all lanes in the western blots were not saturated. Here, BAG1 levels in Shield−1 treated DD-BFD1-Ty∆eif1.2 were notably low and showed no significant difference compared to the vehicle-treated group. f With longer exposure of the western blots to ensure BAG1 signals for DD-BFD1-Ty∆eif1.2 parasites not saturated, Shield−1 treated DD-BFD1-Ty∆eif1.2 exhibited significantly higher BAG1 levels compared to the vehicle treated control. g Representative vacuoles of parasites treated with vehicle or 3 µM Shield−1 for 4 days. Bar, 10 µm. h, i Measurement of mean fluorescence intensity for DBA and BAG1 within individual vacuoles. Mean ± s.d. plotted for 3 biological replicates. A minimum of 100 vacuoles were quantified for each condition within each replicate. Data were analyzed with a linear mixed model. j Model for the role of eIF1.2 in T. gondii differentiation. Upon stress, eIF1.2 enhances the expression of key bradyzoite-specific factors, such as BFD1 and BFD2, to drive T. gondii differentiation. Source data are provided as a Source Data file.

Update of

References

    1. Dubey JP. History of the discovery of the life cycle of Toxoplasma gondii. Int. J. Parasitol. 2009;39:877–882. doi: 10.1016/j.ijpara.2009.01.005. - DOI - PubMed
    1. Montoya JG, Liesenfeld O. Toxoplasmosis. Lancet. 2004;363:1965–1976. doi: 10.1016/S0140-6736(04)16412-X. - DOI - PubMed
    1. Cerutti A, Blanchard N, Besteiro S. The Bradyzoite: A Key Developmental Stage for the Persistence and Pathogenesis of Toxoplasmosis. Pathog. Basel Switz. 2020;9:234. doi: 10.3390/pathogens9030234. - DOI - PMC - PubMed
    1. Rougier S, Montoya JG, Peyron F. Lifelong Persistence of Toxoplasma Cysts: A Questionable Dogma? Trends Parasitol. 2017;33:93–101. doi: 10.1016/j.pt.2016.10.007. - DOI - PubMed
    1. Zhou Z, et al. Toxoplasmosis and the Heart. Curr. Probl. Cardiol. 2021;46:100741. doi: 10.1016/j.cpcardiol.2020.100741. - DOI - PubMed