. 2024 May 23;15(1):4403.
doi: 10.1038/s41467-024-48608-3.

Single molecule delivery into living cells

Affiliations

Single molecule delivery into living cells

Chalmers C Chau et al. Nat Commun. .

Abstract

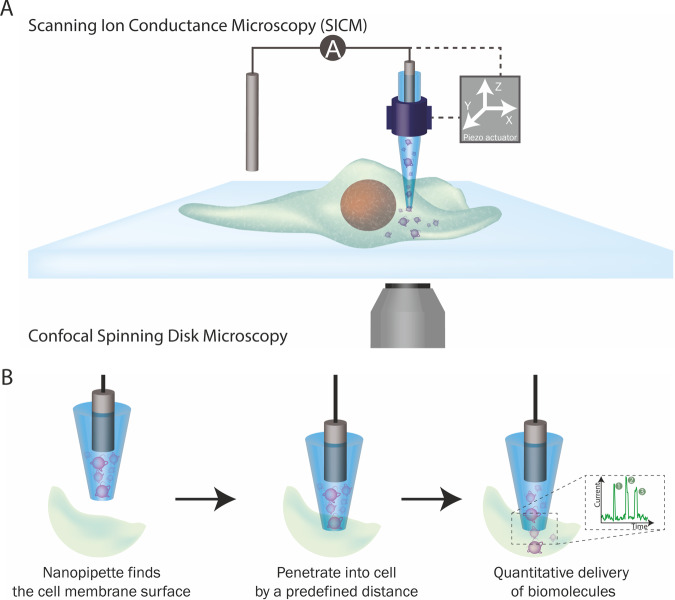
Controlled manipulation of cultured cells by delivery of exogenous macromolecules is a cornerstone of experimental biology. Here we describe a platform that uses nanopipettes to deliver defined numbers of macromolecules into cultured cell lines and primary cells at single molecule resolution. In the nanoinjection platform, the nanopipette is used as both a scanning ion conductance microscope (SICM) probe and an injection probe. The SICM is used to position the nanopipette above the cell surface before the nanopipette is inserted into the cell into a defined location and to a predefined depth. We demonstrate that the nanoinjection platform enables the quantitative delivery of DNA, globular proteins, and protein fibrils into cells with single molecule resolution and that delivery results in a phenotypic change in the cell that depends on the identity of the molecules introduced. Using experiments and computational modeling, we also show that macromolecular crowding in the cell increases the signal-to-noise ratio for the detection of translocation events, thus the cell itself enhances the detection of the molecules delivered.


Conflict of interest statement

The authors declare no competing interests

Figures

Fig. 1
Fig. 1. The nanoinjection platform.
A SICM integration into the platform. The position of the nanopipette is controlled by the SICM through a piezoelectric actuator. B The quantitative nanoinjection procedure. The nanopipette approaches the surface of the cell membrane through the spatial control of the SICM, then the nanopipette is moved downward by a predefined distance to penetrate the cell, finally, the delivery of materials will be triggered by electrophoretic forces via the application of a suitable voltage. During delivery, the current is monitored in real-time, and the translocation of a single analyte disrupts the current baseline and appears as a peak, quantifying the number of peaks and thus revealing the number of molecules delivered to the cell.
Fig. 2
Fig. 2. Quantitative nanoinjection of DNA plasmids into living cells.
A Schematic of the nanoinjection of GFP plasmids (pMaxGFP) into the nucleus and the transfection of the cell. B The transfection of a HeLa cell expressing the nuclear localised mCherry-NLS (HeLa RNuc) with pMaxGFP plasmid through quantitative nanoinjection. HeLa RNuc cells were cultured on a grided dish to enable identification of the cell after nanoinjection. pMaxGFP plasmids were quantitatively nanoinjected into the nucleus of the cell (arrow). Twenty-four hours later, the two daughter cells were imaged to confirm the expression of GFP from the injected pMaxGFP plasmids. C A snapshot of the current trace (20 s) recorded during the nanoinjection. Based on peak counting, a total of 132 pMaxGFP plasmids were nanoinjected into the HeLa RNuc cell. D The transfection of a DRG primary neuron with pMaxGFP plasmid through quantitative nanoinjection. Twenty-four hours later, the neuron was imaged to confirm the expression of GFP. E The current trace (20 s) was recorded during the nanoinjection step. A total of 41 pMaxGFP plasmids were delivered into the DRG neuron. The dotted line in C and D indicated the threshold for events search. The experiments were repeated three times, and the replicates can be found in the Supplementary Information. Source data are provided as a Source Data file.
Fig. 3
Fig. 3. Quantitative nanoinjection of β-galactosidase into cells.
A The dye SPiDER-βGal was used to detect β-galactosidase enzymatic activity inside the cell. Endogenous β-galactosidase is localised to lysosomes in the perinuclear cytoplasm. The nanoinjection of E. coli β-galactosidase into the nucleus causes the nucleus to become fluorescent. A target cell’s nucleus nanoinjected with E. coli β-galactosidase shows an increase in nuclear overall fluorescence. B A snapshot of the current trace (100 s) during the nanoinjection. Based on peak counting, a total of 439 β-galactosidases were nanoinjected into the cell. C The Corrected Total Cell Fluorescence (CTCF) of the nucleus area before and after the nanoinjection was calculated and plotted against the molecule count for 8 independent experiments. The dotted line in B indicated the threshold for events search. The experiments were repeated eight times, and the replicates can be found in the Supplementary Information. Source data are provided as a Source Data file.
Fig. 4
Fig. 4. The quantitative nanoinjection of α-synuclein fibrils into rat primary cortical neurons.
A A representative image of the α-synuclein fibrils and B their associated length distribution of 69 ± 2 nm (standard error of the mean, 628 fibrils traced). C The primary neuron before and after the nanoinjection of the α-synuclein fibrils. D A snapshot of the current trace (100 seconds) during the nanoinjection. Based on peak counting, a total of 153 α-synuclein fibrils were nanoinjected into the cell. The experiments were repeated three times, and the replicates can be found in the Supplementary Information. Source data are provided as a Source Data file.
Fig. 5
Fig. 5. Analysis of the effects of the intracellular environment on single molecule translocation of DNA.
A The same nanopipette was filled with 5 nM 7 kbp dsDNA in PBS mixed with 10 µM ATTO 488 fluorescent dye, and a voltage of −500 mV was used to drive the dsDNA from the nanopipette to either the HeLa RNuc cell, PBS or 30% (w/v) BSA PBS. The cell turns fluorescently green after the injection due to the ATTO 488. B The 5 s current traces of the translocation of the dsDNA into either PBS, 30% (w/v) BSA PBS or cell. C The population distribution of the translocation event of the 7 kbp dsDNA, both 30% (w/v) BSA PBS and cell show a wider distribution on the dwell time. D The equivalent charge of the translocation events was plotted, and a clear shift can be observed between PBS and 30% (w/v) BSA PBS and cell. The box and whisker plots show the median value, the 25th and 75th percentile (box) and upper extreme and lower extreme (whisker). For C and D, a total of 500 events were randomly sampled and plotted. The experiments were repeated three times, and the replicates can be found in the Supplementary Information. Source data are provided as a Source Data file.
Fig. 6
Fig. 6. Coarse-grained simulations of DNA translocation.
A Coarse-grained simulation systems consisting of a 2.7 kbp dsDNA molecule (orange) driven out of a nanopipette (grey) by an applied electric potential into an electrolyte solution with and without BSA proteins (blue). Each simulation ensemble (with or without BSA) consisted of 24 independent runs. B Ionic current enhancement as the DNA moved through the pore, averaged over each simulation ensemble. Here and throughout the figure, solid lines depict the ensemble average, whereas shaded regions depict the standard deviation among the simulations. C Number of base pairs having left the pore during the simulations averaged over each ensemble. D Scatter plot showing the elapsed time between the first and last base pair being translocated through the pore in each simulation against the average current enhancement during that time interval. E Radius of gyration of DNA having been translocated through the pore plotted against the number of translocated base pairs (left) or the time since the last base pair was translocated (right). F Distance of the centre of mass of the ejected DNA from the pore aperture, projected along the pore axis and plotted against the number of translocated base pairs (left) or the time since the last base pair was translocated (right). G Number of BSA molecules below the aperture. The number of molecules was analysed in a cylindrical volume sharing the axis of the pore and immediately below the aperture with a 15 nm radius and 30 nm height. The shadings represent the s.d. calculated for 24 independent simulations. Source data are provided as a Source Data file.

References

    1. Ellis RJ. Macromolecular crowding: an important but neglected aspect of the intracellular environment. Curr. Opin. Struct. Biol. 2001;11:114–119. doi: 10.1016/S0959-440X(00)00172-X. - DOI - PubMed
    1. Stewart MP, Langer R, Jensen KF. Intracellular delivery by membrane disruption: mechanisms, strategies, and concepts. Chem. Rev. 2018;118:7409–7531. doi: 10.1021/acs.chemrev.7b00678. - DOI - PMC - PubMed
    1. Chau C, Actis P, Hewitt E. Methods for protein delivery into cells: from current approaches to future perspectives. Biochem. Soc. Trans. 2020;48:357–365. doi: 10.1042/BST20190039. - DOI - PubMed
    1. Fu A, Tang R, Hardie J, Farkas ME, Rotello VM. Promises and pitfalls of intracellular delivery of proteins. Bioconjug. Chem. 2014;25:1602–1608. doi: 10.1021/bc500320j. - DOI - PMC - PubMed
    1. Stockslager MA, et al. Optical method for automated measurement of glass micropipette tip geometry. Precis. Eng. 2016;46:88–95. doi: 10.1016/j.precisioneng.2016.04.003. - DOI - PMC - PubMed