. 2024 May 23;15(1):4383.
doi: 10.1038/s41467-024-47842-z.

Autophagy-deficient macrophages exacerbate cisplatin-induced mitochondrial dysfunction and kidney injury via miR-195a-5p-SIRT3 axis

Affiliations

Autophagy-deficient macrophages exacerbate cisplatin-induced mitochondrial dysfunction and kidney injury via miR-195a-5p-SIRT3 axis

Yujia Yuan et al. Nat Commun. .

Abstract

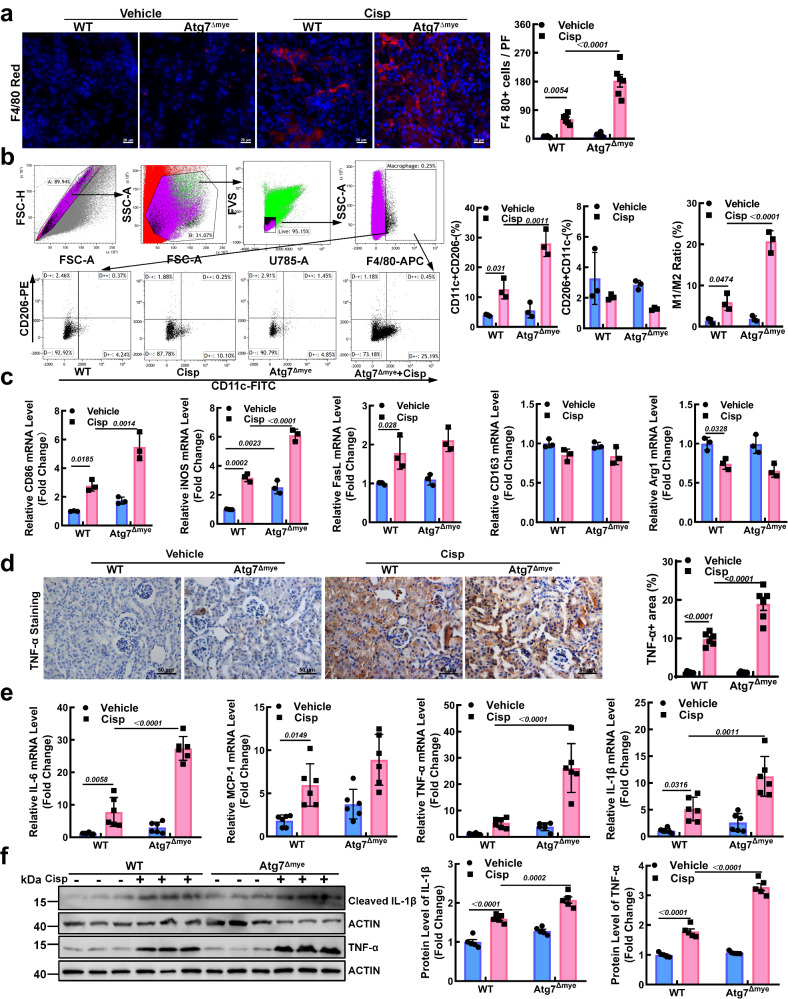
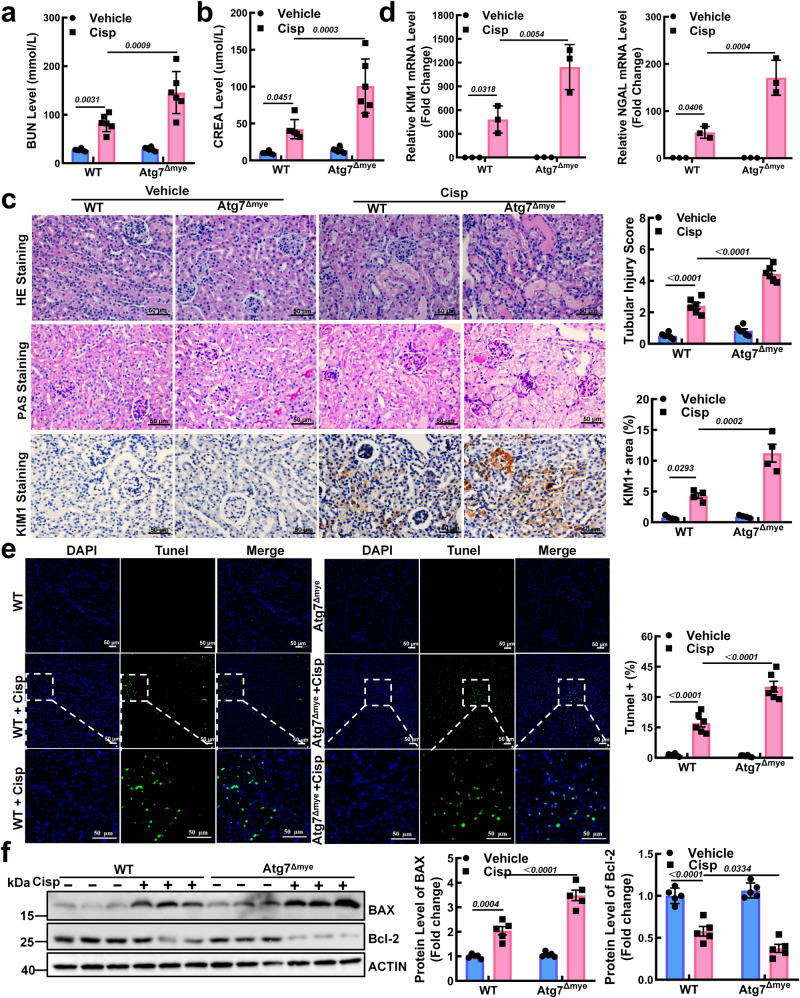
Macrophages (Mφ) autophagy is a pivotal contributor to inflammation-related diseases. However, the mechanistic details of its direct role in acute kidney injury (AKI) were unclear. Here, we show that Mφ promote AKI progression via crosstalk with tubular epithelial cells (TECs), and autophagy of Mφ was activated and then inhibited in cisplatin-induced AKI mice. Mφ-specific depletion of ATG7 (Atg7Δmye) aggravated kidney injury in AKI mice, which was associated with tubulointerstitial inflammation. Moreover, Mφ-derived exosomes from Atg7Δmye mice impaired TEC mitochondria in vitro, which may be attributable to miR-195a-5p enrichment in exosomes and its interaction with SIRT3 in TECs. Consistently, either miR-195a-5p inhibition or SIRT3 overexpression improved mitochondrial bioenergetics and renal function in vivo. Finally, adoptive transfer of Mφ from AKI mice to Mφ-depleted mice promotes the kidney injury response to cisplatin, which is alleviated when Mφ autophagy is activated with trehalose. We conclude that exosomal miR-195a-5p mediate the communication between autophagy-deficient Mφ and TECs, leading to impaired mitochondrial biogenetic in TECs and subsequent exacerbation of kidney injury in AKI mice via miR-195a-5p-SIRT3 axis.


Conflict of interest statement

The authors declare no competing interests.

Figures

Fig. 1
Fig. 1. Autophagy activity of macrophages (Mφ) is activated and then inhibited in cisplatin-induced AKI mice.
a Representative images of F4/80 (red) in kidney sections used for Mφ detection. Scale bar, 20 µm, n = 4 biological replicates for each group, unpaired two-tailed Student’s t test. b, c After cisplatin injection, peritoneal Mφ were isolated, and the mRNA levels (b) (unpaired two-tailed Student’s t test) and protein levels (c) (one-way ANOVA with Dunnett’s multiple comparisons test) of autophagy genes were measured. ACTIN was used as the loading control. n = 3 biological replicates for each group. d Representative images of LC3 staining (red) in peritoneal Mφ treated with the treatment of hydroxychloroquine (HCQ, 20 µM) after cisplatin injection for 4 days. Scale bar, 20 µm, n = 6 biological replicates for each group, two-way ANOVA with Tukey’s multiple comparison test. To detect changes in autophagy in kidney-infiltrated Mφ, F4/80+ cells in kidney tissue were sorted. e Representative flow cytometric images illustrating the expression of LC3 in F4/80+ cells in kidney tissues. n = 3 biological replicates for each group, unpaired two-tailed Student’s t test. f F4/80+ kidney-infiltrated Mφ on the 4th day after cisplatin treatment were sorted and then stained with LC3 (red). Scale bar, 20 µm, n = 6 biological replicates for each group, unpaired two-tailed Student’s t test. The data are presented as the means ± SEMs. NC normal control, Cisp cisplatin. Source data are provided as a Source data file.
Fig. 2
Fig. 2. Macrophage (Mφ)-specific deficiency of ATG7 aggravates the inflammatory response in AKI mice.
a Representative images and quantification of F4/80 (red) in kidney sections for Mφ detection. Scale bar, 20 µm, n = 6 biological replicates for each group. b, c The phenotype of Mφ in kidney tissues was characterized by flow cytometry (b) (M1: CD11c + CD206-; M2: CD206 + CD11c-) and RT‒PCR (c) (M1: CD86, iNOS, FasL); M2: CD163 and Arg1). n = 6 biological replicates for each group. d Immunohistochemical staining for TNF-α in paraffin-embedded kidney sections. Scale bar, 50 µm, n = 6 biological replicates for each group. The mRNA levels (e) and protein levels (f) of inflammation-related genes were measured. ACTIN was used as the loading control. The data are the means ± SEMs. All statistical analysis were performed by two-way ANOVA with Tukey’s multiple comparison test. Source data are provided as a Source data file.
Fig. 3
Fig. 3. Macrophages (Mφ) specifically deficient in ATG7 sensitize mice to cisplatin-induced kidney injury.
a, b Serum of BUN and CREA in WT and Atg7Δmye mice after cisplatin injection. n = 6 biological replicates for each group. c Representative periodic acid-Schiff (PAS)- and hematoxylin and eosin (H&E)-stained kidneys and immunohistochemical staining and quantification of kidney injury molecule 1 (KIM1) in paraffin-embedded kidney sections. n = 6 biological replicates for each group. Scale bar, 50 µm. d The mRNA levels of KIM1 and neutrophil gelatinase-associated lipocalin (NGAL) in mice. n = 3 biological replicates for each group. e Representative micrographs and quantification of TUNEL staining (green) in each group (the line box indicates the magnified image). Scale bar, 50 µm, n = 6 biological replicates for each group. f Representative images of western blot and quantitative analyses of BAX and Bcl-2. ACTIN was used as the loading control. n = 5 biological replicates for each group. The data are presented as the means ± SEMs. All statistical analysis were performed by two-way ANOVA with Tukey’s multiple comparison test. Source data are provided as a Source data file.
Fig. 4
Fig. 4. Exosomes derived from ATG7-deficient macrophages (Mφs) exacerbate kidney injury in vivo.
a Experimental procedure to explore the effects of Mφ-derived exosomes on cisplatin-induced AKI. Mice were injected with Mφ-derived exosomes from WT (MφWT-EXO, EXO1) or Atg7Δmye mice (MφAtg7Δmye-EXO, EXO2) (~100 μg (at the protein level) in 100 μl) 24 h before cisplatin injection (16 mg/kg). b Imaging of DiR-labeled exosomes from different tissues. c Quantification of the relative fluorescence intensity of the infiltrated exosomes in the kidney in different groups. n = 3 biological replicates for each group, unpaired two-tailed Student’s t test. d, e The serum levels of BUN (d) and CREA (e) in the mice. n = 6 biological replicates for each group. f, g Representative images of hematoxylin-eosin (HE)- and periodic acid-Schiff (PAS)-stained kidney sections and the tubular injury scores of the mice. Scale bars, 50 µm. n = 6 biological replicates for each group. The data are the means ± SEMs. Statistical analysis were performed by two-way ANOVA with Tukey’s multiple comparison test in (df). EXO1, MφWT-EXO; EXO2, MφAtg7Δmye-EXO. Source data are provided as a Source data file.
Fig. 5
Fig. 5. Macrophage (Mφ)-derived miR-195a-5p impairs mitochondria in TECs.
a The level of miR-195a-5p in Mφ from WT and Atg7Δmye mice. n = 4 biological replicates for each group. b The level of miR-195a-5p in Mφ-derived exosomes. c The level of miR-195a-5p in TECs after the incubation with exosomes (10 μg/ml). n = 3 biological replicates for each group. d Flow cytometry analysis of the mitochondrial membrane potential (Δψm) in TECs. n = 3 biological replicates for each group. e Representative images and quantification of mitochondrial ROS (mtROS) (red) in TECs. Scale bars, 10 µm, n = 3 biological replicates for each group f Representative immunofluorescence images and quantification of mitochondrial morphology (green) in TECs loaded with MitoTracker Green. Scale bars, 10 µm and 2 µm. g The ATP content of TECs was measured by an ATP assay kit, and the ATP concentration was calculated in nmol/mg protein. n = 3 biological replicates for each group. h Measurement of the mitochondrial OCR in TECs using a Mito Stress kit, and the quantification of basal respiration, ATP production, maximal respiration, and spare respiration capacity. n = 3 biological replicates for each group. The data are presented as the means ± SEMs. All statistical analysis were performed by unpaired two-tailed Student’s t test. EXO1, MφWT-EXO; EXO2, MφAtg7Δmye-EXO. Source data are provided as a Source data file.
Fig. 6
Fig. 6. The miR-195a-5p antagomir attenuates mitochondrial dysfunction and kidney injury in cisplatin-induced Atg7Δmye mice.
a The level of miR-195a-5p in kidney sections from WT and Atg7Δmye mice. n = 4 biological replicates for each group. b Representative IVIS images of different organs harvested from mice after intravenous injection of anti-miR-195a-5p-5’Cy5 (PBS vs. Anti-miR-195a-5p-CY5-24h, P = 0.0009; PBS vs. Anti-miR-195a-5p-CY5-48h, P = 0.0002; PBS vs. Anti-miR-195a-5p-CY5-72h, P = 0.0025; PBS vs. Anti-miR-195a-5p-CY5-96h, P = 0.001). n = 3 biological replicates for each group, unpaired two-tailed Student’s t test. c Representative micrographs of anti-miR-195a-5p-5’Cy5 (red) in the kidney. Scale bar, 20 μm. d Representative TEM images of kidney tissues from mice. Scale bar, 2 µm. e Representative images of western blot and quantitative analyses of OXPHOS-related genes (ATP5b, UQCRC2, mtCO1, SDHB, and NDUFS4). ACTIN was used as the loading control. n = 3 biological replicates for each group. f The serum levels of BUN and CREA in the Atg7Δmye mice. n = 6 biological replicates for each group. g Representative images of hematoxylin-eosin (HE) and periodic acid-Schiff (PAS)-staining (n = 6 biological replicates for each group), immunohistochemical staining and quantification of ATP5b and KIM1 (n = 4 biological replicates for each group) in paraffin-embedded kidney sections. Scale bars, 50 µm. h Representative micrographs and quantification of TUNEL staining (green) in Atg7Δmye mice treated with anti-NC or anti-miR-195a-5p treatment. Scale bars, 50 µm, n = 6 biological replicates for each group. i Representative images of western blots and quantitative analyses of BAX and Bcl-2 expression. ACTIN was used as the loading control. n = 5 biological replicates for each group. The data are the means ± SEMs. Statistical analysis was performed by two-way ANOVA with Tukey’s multiple comparison test in (a) and (ei). Source data are provided as a Source data file.
Fig. 7
Fig. 7. Overexpression of SIRT3 alleviates EXO2-induced mitochondrial damage and cisplatin-induced kidney injury.
a Prediction of SIRT3 as a target of miR-195a-5p. b Dual-luciferase assays of TECs cotransfected with a SIRT3 luciferase reporter (pmirGLO-SIRT3-WT, SIRT3-WT) and a miR-195a-5p mimic or mutant SIRT3 luciferase reporter (pmirGLO-SIRT3-MUT, SIRT3-MUT), and the luciferase activity of the cells was detected using a dual-luciferase assay kit. n = 4 biological replicates for each group, two-way ANOVA with Tukey’s multiple comparison test. c, d Western blot and quantitative analyses of SIRT3 in TECs treated with the treatment of miR-195a-5p mimic, or miR-195a-5p inhibitor. ACTIN was used as the loading control. n = 3 biological replicates for each group. e Representative images and quantification of mitochondrial ROS (mtROS) (red) and mitochondrial morphology (green) in TECs. Scale bars, 10 µm and 2 µm, n = 3 biological replicates for each group. f Measurement of the mitochondrial OCR in TECs using a Mito Stress kit and quantification of basal respiration, ATP production, maximal respiration, and spare respiration capacity. n = 3 biological replicates for each group. Statistical analysis were performed by unpaired two-tailed Student’s t test in (cf). For lentiviral experiments, cisplatin-induced AKI was induced 3 days after intrarenal injection of lentivirus carrying SIRT3 (LV-Sirt3) or NC (LV-nc). g Representative micrographs of SIRT3 (red) and TEM images of the kidneys of Atg7Δmye mice. Scale bars, 20 µm and 2 µm, n = 3 biological replicates for each group. h Serum levels of BUN and CREA in mice. n = 5 biological replicates for each group. i Representative images of hematoxylin-eosin (HE) and periodic acid-Schiff (PAS)-staining, and immunohistochemical staining and quantification of KIM1 expression in kidney sections. Scale bars, 50 µm, n = 4 biological replicates for each group. Statistical analysis was performed by two-way ANOVA with Tukey’s multiple comparison test in (gi). The data are the means ± SEMs. Source data are provided as a Source data file.
Fig. 8
Fig. 8. Adoptive transfer of autophagy-activated macrophages (Mφ) alleviates kidney injury in AKI mice.
a Peritoneal Mφ isolated from AKI mice were treated with trehalose, after which the protein levels of LC3 II and P62 were measured. ACTIN was used as the loading control. n = 3 biological replicates for each group, two-way ANOVA with Tukey’s multiple comparison test. b The level of miR-195a-5p in Mφ from AKI mice treated with trehalose. ACTIN was used as the loading control. n = 3 biological replicates for each group, unpaired two-tailed Student’s t test. After endogenous Mφ were deleted by clodronate liposomes (Lipo-Clod), AKI was induced in mice by cisplatin. Then, Mφ from AKI mice (MφAKI) or trehalose-treated MφAKI mice (MφAKI+Tre) were adoptively transferred into the mice at 6 h after cisplatin treatment. c western blot and quantitative analyses of OXPHOS-related proteins. ACTIN was used as the loading control. n = 3 biological replicates for each group, two-way ANOVA with Tukey’s multiple comparison test. d Representative TEM images and hematoxylin-eosin (HE) staining of kidneys from AKI mice after adoptive transfer of Mφ. Scale bars, 2 µm and 50 µm, n = 4 biological replicates for each group, unpaired two-tailed Student’s t test. e Renal function (serum levels of BUN and CREA) detection. n = 6 biological replicates for each group, one-way ANOVA with Tukey’s multiple comparisons test. f Representative micrographs and quantification of TUNEL staining (green) in each group. Scale bars, 20 µm and 50 µm, n = 6 biological replicates for each group, one-way ANOVA with Tukey’s multiple comparisons test. g Schematic representation of the data. Data in (a) and (b) show a representative of three independent experiments. The data are the means ± SEMs. Source data are provided as a Source data file.

References

    1. James MT, Bhatt M, Pannu N, Tonelli M. Long-term outcomes of acute kidney injury and strategies for improved care. Nat. Rev. Nephrol. 2020;16:193–205. doi: 10.1038/s41581-019-0247-z. - DOI - PubMed
    1. Vijayan A. Tackling AKI: prevention, timing of dialysis and follow-up. Nat. Rev. Nephrol. 2021;17:87–88. doi: 10.1038/s41581-020-00390-3. - DOI - PMC - PubMed
    1. Ronco C, Bellomo R, Kellum JA. Acute kidney injury. Lancet. 2019;394:1949–1964. doi: 10.1016/S0140-6736(19)32563-2. - DOI - PubMed
    1. Liu J, Jia Z, Gong W. Circulating mitochondrial DNA stimulates innate immune signaling pathways to mediate acute kidney injury. Front. Immunol. 2021;12:680648. doi: 10.3389/fimmu.2021.680648. - DOI - PMC - PubMed
    1. Cantero-Navarro E, et al. Role of macrophages and related cytokines in kidney disease. Front. Med. 2021;8:688060. doi: 10.3389/fmed.2021.688060. - DOI - PMC - PubMed

MeSH terms

LinkOut - more resources