

Typical and extreme weather datasets for studying the resilience of buildings to climate change and heatwaves
- PMID: 38782916
- PMCID: PMC11116384
- DOI: 10.1038/s41597-024-03319-8
Typical and extreme weather datasets for studying the resilience of buildings to climate change and heatwaves
Erratum in
-
Author Correction: Typical and extreme weather datasets for studying the resilience of buildings to climate change and heatwaves.Sci Data. 2025 Jan 15;12(1):83. doi: 10.1038/s41597-025-04420-2. Sci Data. 2025. PMID: 39814748 Free PMC article. No abstract available.
Abstract
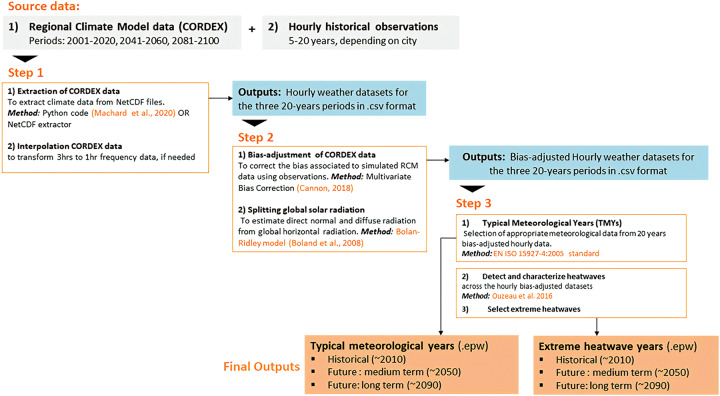
We present unprecedented datasets of current and future projected weather files for building simulations in 15 major cities distributed across 10 climate zones worldwide. The datasets include ambient air temperature, relative humidity, atmospheric pressure, direct and diffuse solar irradiance, and wind speed at hourly resolution, which are essential climate elements needed to undertake building simulations. The datasets contain typical and extreme weather years in the EnergyPlus weather file (EPW) format and multiyear projections in comma-separated value (CSV) format for three periods: historical (2001-2020), future mid-term (2041-2060), and future long-term (2081-2100). The datasets were generated from projections of one regional climate model, which were bias-corrected using multiyear observational data for each city. The methodology used makes the datasets among the first to incorporate complex changes in the future climate for the frequency, duration, and magnitude of extreme temperatures. These datasets, created within the IEA EBC Annex 80 "Resilient Cooling for Buildings", are ready to be used for different types of building adaptation and resilience studies to climate change and heatwaves.
© 2024. The Author(s).
Conflict of interest statement
The authors declare no competing interests.
Figures


References
-
- Belcher, S., Hacker, J. & Powell, D. Constructing design weather data for future climates. Building Services Engineering Research and Technology26, 49–61 (2005).
-
- Nik, V. M. Making energy simulation easier for future climate – Synthesizing typical and extreme weather data sets out of regional climate models (RCMs). Applied Energy177, 204–226 (2016).
-
- Machard, A., Inard, C., Alessandrini, J.-M., Pelé, C. & Ribéron, J. A Methodology for Assembling Future Weather Files Including Heatwaves for Building Thermal Simulations from the European Coordinated Regional Downscaling Experiment (EURO-CORDEX) Climate Data. Energies13, 3424 (2020).
-
- Machard, A. Towards mitigation and adaptation to climate change: Contribution to Building Design. (2021).
-
- ISO. ISO. ISO 15927-4:2005 Hygrothermal Performance of Buildings — Calculation and Presentation of Climatic Data — Part 4: Hourly Data for Assessing the Annual Energy Use for Heating and Cooling. (2005).
