. 2024 May 23;15(1):4372.
doi: 10.1038/s41467-024-48640-3.

An integrated spatio-temporal view of riverine biodiversity using environmental DNA metabarcoding

Affiliations

An integrated spatio-temporal view of riverine biodiversity using environmental DNA metabarcoding

William Bernard Perry et al. Nat Commun. .

Abstract

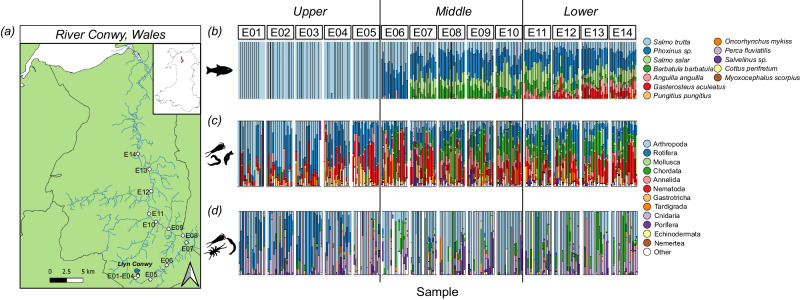
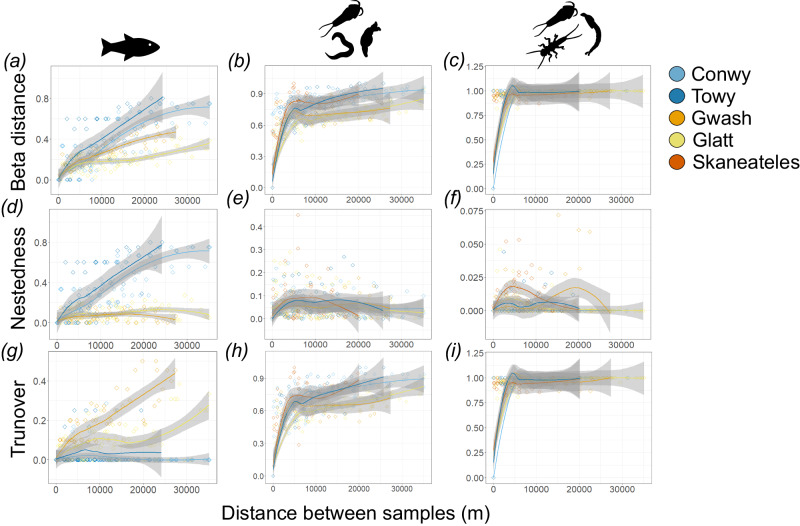
Anthropogenically forced changes in global freshwater biodiversity demand more efficient monitoring approaches. Consequently, environmental DNA (eDNA) analysis is enabling ecosystem-scale biodiversity assessment, yet the appropriate spatio-temporal resolution of robust biodiversity assessment remains ambiguous. Here, using intensive, spatio-temporal eDNA sampling across space (five rivers in Europe and North America, with an upper range of 20-35 km between samples), time (19 timepoints between 2017 and 2018) and environmental conditions (river flow, pH, conductivity, temperature and rainfall), we characterise the resolution at which information on diversity across the animal kingdom can be gathered from rivers using eDNA. In space, beta diversity was mainly dictated by turnover, on a scale of tens of kilometres, highlighting that diversity measures are not confounded by eDNA from upstream. Fish communities showed nested assemblages along some rivers, coinciding with habitat use. Across time, seasonal life history events, including salmon and eel migration, were detected. Finally, effects of environmental conditions were taxon-specific, reflecting habitat filtering of communities rather than effects on DNA molecules. We conclude that riverine eDNA metabarcoding can measure biodiversity at spatio-temporal scales relevant to species and community ecology, demonstrating its utility in delivering insights into river community ecology during a time of environmental change.


Conflict of interest statement

K.D. is the co-founder of SimplexDNA, a company which sells services for environmental DNA analysis. The remaining authors declare no competing interests.

Figures

Fig. 1
Fig. 1. Sample sites across the River Conwy (Wales, UK) with corresponding taxonomic overview.
A simplified catchment map of the a River Conwy, Wales, showing sampling sites as white dots (E01–E14) that were sampled at 19 timepoints for eDNA over the course of a year. The same sample sites are shown in the inset map of Wales as red dots. Corresponding stacked bar plots show normalised reads at 19 time points, grouped by sample sites, and coloured by taxonomy, featuring b fish detected with the 12 S marker, c metazoans detected with the 18S marker and d aquatic arthropods detected with the COI marker. Taxonomic identification is shown at the species level for the 12S marker, and at the phylum level for the 18S and COI markers. White bars represent lower read count phylum and the colour order of the key matches the colour order of the stacked bars. Sites in the stacked bar plots are separated into the upper, middle and lower sections of the river. Source data are provided as a Source Data file. The maps in (a) contain OS data © Crown copyright and database right 2023 as well as Natural Resources Wales information © Natural Resources Wales and Database Right. All Rights Reserved. Contains Ordnance Survey Data. Ordnance Survey Licence number AC0000849444. Crown Copyright and Database Right.
Fig. 2
Fig. 2. Spatiotemporal variation in measures of alpha diversity across the River Conwy (Wales, UK).
Venn diagrams showing the overlap in a fish species (12S marker), b metazoan ASVs (18S marker) and c aquatic arthropod ASVs (COI marker) between the upper (E01–E05), middle (E06–E10) and lower (E11–E14) sections of the River Conwy. Segments of the river are based on changing environmental characteristics and land use at different points in the river (Supplementary Fig. 3). The size of the circles are scaled to the number of species/ASVs that they represent. Also shown are alpha diversity plots of d fish species count, e Shannon index of the most abundant metazoan phyla (annelids, arthropods, nematodes, molluscs and rotifers) and f Shannon index of aquatic arthropods. Alpha diversity is shown over distance from the lake, coloured by season, with smoothed conditional means and 95% grey confidence intervals provided by linear models (d, f) and (e) generalised additive models. Source data are provided as a Source Data file.
Fig. 3
Fig. 3. Alpha and beta diversity within each of the five rivers, the Rivers Conwy (Wales, UK), Tywi (Wales, UK), Gwash (England, UK), Glatt (Switzerland) and Skaneateles Creek (USA).
a Maps of North America and Europe show the geographic location of the rivers and highlight the colour and shape coordination used in (bd). Alpha diversity is represented by (b) species count of fish detected with the 12S marker (Skaneateles Creek was excluded as only a few samples passed the filtering criterion), c Shannon index of metazoan ASVs detected with the 18S marker and (d) Shannon index of aquatic arthropod ASVs detected with the COI marker, all of which are plotted against distance from the lake and contain a linear regression with corresponding 95% confidence intervals (grey). NMDS plots of beta diversity using e fish species, f 18S metazoan ASVs and g COI aquatic arthropod ASVs, broken down by distance from the lake (colour) and river sampled (shape), with red dots representing the mean NMDS scores for each of the rivers. Source data are provided as a Source Data file.
Fig. 4
Fig. 4. Spatiotemporal variation in measures of beta diversity across the River Conwy (Wales, UK), in addition to the relationship between beta diversity and environmental conditions.
Beta diversity of the River Conwy for a, b fish species detected with the 12S marker, c, d metazoan ASVs detected with the 18S marker and e, f aquatic arthropod ASVs detected by the COI marker. Included are (a, c, e) NMDS plots coloured by distance the sample was taken from the lake (Llyn Conwy), with shapes denoting season, red dots displaying seasonal mean NMDS scores and lines connecting datapoints with their respective seasonal means. R2 values from permutational multivariate analysis of variance (PERMANOVA) are also included for b fish, d metazoans (split by the five most abundant phyla) and f aquatic arthropods. Source data are provided as a Source Data file.
Fig. 5
Fig. 5. Spatiotemporal variation of pairwise beta diversity in the River Conwy (Wales, UK).
Pairwise beta diversity in the River Conwy, based on (ac) Sørensen dissimilarity, including two components, df nestedness and gi turnover, are plotted against the pairwise geographic distance between samples for fish species detected with the 12S marker (a, d, g), metazoan ASVs detected with the 18S marker (b, e, h) and aquatic arthropod ASVs detected with the COI marker (c, f, i). Loess smoothers with corresponding 95% confidence intervals (grey) are also present. Datapoints are coloured by pairwise difference in days between sample collections. Source data are provided as a Source Data file.
Fig. 6
Fig. 6. Pairwise beta diversity in five rivers, the Rivers Conwy (Wales, UK), Tywi (Wales, UK), Gwash (England, UK), Glatt (Switzerland) and Skaneateles Creek (USA).
Beta diversity is based on (ac) Sørensen dissimilarity, including two components, df nestedness and gi turnover, are plotted against the pairwise geographic distance between samples for fish species detected with the 12S marker (a, d, g), metazoan ASVs detected with the 18S marker (b, e, h) and aquatic arthropod ASVs detected with the COI marker (c, f, i). Loess smoothers with corresponding 95% confidence intervals (grey) are also present. Datapoints are coloured according to sample origin. For fish species, Skaneateles Creek was excluded as only a few samples passed the filtering criterion. Source data are provided as a Source Data file.

References

    1. WWF. Living Planet Report 2022 – Building a Naturepositive Society (WWF, 2022).
    1. Tickner D, et al. Bending the curve of global freshwater biodiversity loss: an emergency recovery plan. Bioscience. 2020;70:330–342. doi: 10.1093/biosci/biaa002. - DOI - PMC - PubMed
    1. Altermatt F, et al. Uncovering the complete biodiversity structure in spatial networks: the example of riverine systems. Oikos. 2020;129:607–618. doi: 10.1111/oik.06806. - DOI
    1. Pereira HM, David Cooper H. Towards the global monitoring of biodiversity change. Trends Ecol. Evol. 2006;21:123–129. doi: 10.1016/j.tree.2005.10.015. - DOI - PubMed
    1. Deiner K, et al. Environmental DNA metabarcoding: transforming how we survey animal and plant communities. Mol. Ecol. 2017;26:5872–5895. doi: 10.1111/mec.14350. - DOI - PubMed

Substances