. 2024 May 23;15(1):4393.
doi: 10.1038/s41467-024-48622-5.

Reduction of specific enterocytes from loss of intestinal LGR4 improves lipid metabolism in mice

Affiliations

Reduction of specific enterocytes from loss of intestinal LGR4 improves lipid metabolism in mice

Yuan Liang et al. Nat Commun. .

Abstract

Whether intestinal Leucine-rich repeat containing G-protein-coupled receptor 4 (LGR4) impacts nutrition absorption and energy homeostasis remains unknown. Here, we report that deficiency of Lgr4 (Lgr4iKO) in intestinal epithelium decreased the proportion of enterocytes selective for long-chain fatty acid absorption, leading to reduction in lipid absorption and subsequent improvement in lipid and glucose metabolism. Single-cell RNA sequencing demonstrates the heterogeneity of absorptive enterocytes, with a decrease in enterocytes selective for long-chain fatty acid-absorption and an increase in enterocytes selective for carbohydrate absorption in Lgr4iKO mice. Activation of Notch signaling and concurrent inhibition of Wnt signaling are observed in the transgenes. Associated with these alterations is the substantial reduction in lipid absorption. Decrement in lipid absorption renders Lgr4iKO mice resistant to high fat diet-induced obesity relevant to wild type littermates. Our study thus suggests that targeting intestinal LGR4 is a potential strategy for the intervention of obesity and liver steatosis.


Conflict of interest statement

The authors declare no competing interests.

Figures

Fig. 1
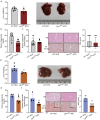
Fig. 1. Deficiency of intestinal Lgr4 protects mice from HFD-induced obesity.
Six-week-old male Lgr4iKO mice and littermates were fed normal chow diet (NCD) or 60% high fat diet (HFD) for 12 weeks. Results were expressed as mean ± SD and analyzed by the t-test (two-side). *P < 0.05 vs WT NCD. #P < 0.05 vs WT HFD. n = 4–11. a, b Body weight and body size of mice fed NCD or HFD. n  =  11 for WT NCD, 5 for Lgr4iKO NCD, 7 for WT HFD, and 5 for Lgr4iKO HFD. WT NCD vs. Lgr4iKO NCD: P  =  0.0003. WT HFD vs. Lgr4iKO HFD: P  =  0.005. c Body condition score (BCS) of mice fed NCD or HFD. n = 5. *P = 0.0476. d, e Fat mass and lean mass of mice fed NCD or HFD. n  =  5 for WT NCD, 4 for Lgr4iKO NCD, 7 for WT HFD, and 5 for Lgr4iKO HFD. d Fat mass: *P  =  0.0268. Lean mass: *P  = 0.0027. e Fat mass: #P  = 0.0048. Lean mass: #P  = 0.006. fi Fat mass, H&E staining, adipocyte size and mRNA levels of beigeing marker genes in sWAT (Ucp1, Ucp3 and Pgc1α) of mice fed either NCD (f: n = 5–6, *P  = 0.0196) or HFD (g: n = 4–6, #P  = 0.0279 for sWAT weight, #P  <0.0001 for frequency, #P = 0.0115 for Ucp1), as well as in eWAT of mice fed NCD (h, n = 4–6, *P  = 0.0005) or HFD (i, n = 4–6, #P  = 0.0222 for eWAT weight, #P = 0.047 for Ucp1).
Fig. 2
Fig. 2. Deficiency of intestinal Lgr4 protects mice from HFD-induced hepatic steatosis.
Six-week-old male Lgr4iKO mice and littermates were fed normal chow diet (NCD) or 60% high fat diet (HFD) for 12 weeks. Results were expressed as mean ± SD and analyzed by the t-test (two-side). *P < 0.05 vs WT NCD. #P < 0.05 vs WT HFD. a Liver weight and liver size of NCD-fed mice. n  =  6 for WT NCD and 5 for Lgr4iKO NCD. *P = 0.0385. b Plasma triglyceride levels of NCD-fed mice. n = 5. *P = 0.0157. c Triglyceride contents and steatosis in liver of NCD-fed mice. n  =  5 for WT NCD and 4 for Lgr4iKO NCD. d Liver weight and liver size of HFD-fed mice. n  =  6 for WT NCD and 4 for Lgr4iKO NCD. #P = 0.024. e Plasma triglyceride levels of HFD-fed mice. n = 4. #P = 0.0236. f Triglyceride contents and steatosis in liver of HFD-fed mice. n = 4. #P = 0.0388 for hepatic triglyceride, #P < 0.0001 for NAS score.
Fig. 3
Fig. 3. Deficiency of intestinal Lgr4 decreases lipid absorption.
af Six-week-old male Lgr4iKO mice and littermates were fed normal chow diet (NCD) or 60% high fat diet (HFD) for 12 weeks. Results were expressed as mean ± SD and analyzed by the t-test or one-way ANOVA. *P < 0.05 vs WT NCD. #P < 0.05 vs WT HFD. n = 3–6. a Fecal triglyceride levels. n  =  4 for WT NCD, 4 for Lgr4iKO NCD, 5 for WT HFD, and 4 for Lgr4iKO HFD. WT NCD vs. Lgr4iKO NCD: *P  =  0.0296. WT NCD vs. WT HFD: *P  =  0.0185. WT HFD vs. Lgr4iKO HFD: #P  =  0.011. b Levels of circulating triglyceride and the area under curve in response to oral administration of olive oil in NCD-fed mice. n = 4. *P  = 0.0004 for AUC. c Oil red O staining of intestine 2 h after olive oil gavage and quantitative analysis. n  =  4 for WT NCD and 3 for Lgr4iKO NCD. *P  = 0.0107. d mRNA levels of lipid absorption markers (Fatp4, Cd36 and Fabp2) in intestine of NCD-fed mice. n  =  5 for WT NCD and 5–6 for Lgr4iKO NCD. *P  = 0.0483 for Cd36, *P = 0.0104 for Cav1. e Immunohistochemical staining of FATP4 in intestine and quantification of positive area. n = 9. *P  = 0.0004(left) and 0.0075(right). f Western blot and quantification of CD36 protein levels. β-actin was used as internal control. n = 3. *P = 0.0093. gj The mouse small intestinal epithelial cell line MODE-K cells were transfected with Lgr4 siRNA for 48 h. g Western blot and quantification of LGR4 and FATP4 protein levels. β-actin was used as loading control. n = 3. *P = 0.008 for LGR4, *P = 0.0124 for FATP4. h mRNA levels of lipid absorption markers (Fatp4, Cav1, Fabp1 and Fabp2) in MODE-K cells. β-actin was used as a reference gene. n = 3. *P = 0.0077 for Fatp4, *P = 0.0085 for Cav1. i The triglyceride level in MODE-K cells treated with mixture of oleic acid (0.6 mmol/l) and palmitic acid (0.2 mmol/l). n = 5. j Cells were treated with BODIPY-C12 long-chain fatty acid for 2 h and observed under microscope and the uptake of BODIPY-C12 long-chain fatty acid in MODE-K cells by flow cytometry.
Fig. 4
Fig. 4. Intestine-specific Lgr4 knockout improves glucose tolerance.
Six-week-old male Lgr4iKO mice and littermates were fed normal chow diet (NCD) or 60% high fat diet (HFD) for 12 weeks. Results were expressed as mean ± SD. *P < 0.05 vs WT NCD. #P < 0.05 vs WT HFD. n = 3–6. a, b Intraperitoneal glucose tolerance test and the area under curve of mice fed NCD or HFD. n = 3 for WT NCD, 3 for Lgr4iKO NCD, 4 for WT HFD, and 4 for Lgr4iKO HFD. Statistical analysis by two-way ANOVA with Šídák’s multiple comparisons test for IPGTT. #P = 0.0007. c Homeostatic model assessment of insulin resistance (HOMA-IR) and homeostatic model assessment of insulin sensitivity (HOMA-IS) of HFD-fed mice. HOMA-IR = plasma insulin (μU) × glucose (mmol/l)/22.5. HOMA-IS = 1/HOMA-IR. n = 5 for WT HFD, and 3 for Lgr4iKO HFD. Student’s t test (two-side) was used for un-paired analysis. #P = 0.0371 for HOMA-IR. #P = 0.0234 for HOMA-IS. d, e Oral glucose tolerance test and the area under curve in mice fed NCD or HFD. n = 6 for WT NCD, 5 for Lgr4iKO NCD, 6 for WT HFD, and 4 for Lgr4iKO HFD. f mRNA levels of carbohydrate absorption markers (Glut1, Glut2, Glut5 and Sglt1) in intestine of mice fed NCD or HFD. n = 5 for WT NCD, 5–6 for Lgr4iKO NCD, 6 for WT HFD, and 4 for Lgr4iKO HFD. Statistical analysis by two-way ANOVA with Šídák’s multiple comparisons test. *P < 0.0001. #P = 0.0007 for Glut2 and #P < 0.0001 for Glut5. g Immunohistochemical staining of GLUT2 in intestine and quantification of positive area. n = 9.
Fig. 5
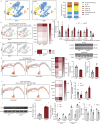
Fig. 5. The effect of LGR4 on the heterogeneity of intestinal absorptive cells.
Six-week-old male Lgr4iKO mice and littermates were fed normal chow diet (NCD) for 12 weeks. Single cell RNA sequencing was used to obtain intestinal epithelium single cell transcriptome data from 18-week-old Lgr4iKO mice and littermates. n = 3. a t-SNE plot showing stem cell, TA cell, absorptive cell, goblet cell, paneth cell, enteroendocrine cell and tuft cell marker genes expression in intestinal epithelium. b Defining cell populations with marker gene expression. c Pseudotime ordering on intestinal epithelium cells. d Re-clustering absorptive cells. Enterocytes selective for absorption of long-chain fatty acid, carbohydrate, or both were defined by the expression of Cd36Fatp4Glut2 and Sglt1. e The proportions of long-chain fatty acid-absorptive enterocytes, carbohydrate-absorptive enterocytes, and long-chain fatty acid and carbohydrate-absorptive enterocytes.
Fig. 6
Fig. 6. LGR4 regulates differentiation of ISCs via Wnt and Notch signaling pathways.
ai Six-week-old male Lgr4iKO mice and littermates were fed normal chow diet for 12 weeks. Single cell RNA sequencing was used to obtain intestinal epithelium single cell transcriptome data from 18-week-old Lgr4iKO mice and littermates. n = 3. *P < 0.05 vs WT. a The proportions of stem cells, TA cells, absorptive cells, goblet cells, paneth cells, enteroendocrine cells and tuft cells. b t-SNE plot showing absorptive progenitor cell marker genes expression (left) and heatmap showing UMI value (right). The transcription expression levels were calculated as UMI value. c t-SNE plot showing secretory progenitor cell marker genes expression (left) and heatmap showing UMI value of Dll1 (right). d mRNA levels of absorptive progenitor cell and secretory progenitor cell markers in intestine of NCD-fed mice. n = 4–5 for WT, and 5–6 for Lgr4iKO. Results were expressed as mean ± SD. e Pseudotime showing Wnt target genes expression (left) and heatmap showing UMI value (right). f Western blotting detecting nuclear and cytosol levels of β-catenin protein. The relative expression level was quantified using Image J software. Results were expressed as mean ± SD. g mRNA levels of downstream genes of the Notch signaling pathway (Math1 and Hes1) detected by RT-qPCR. n = 5 for WT, and 6 for Lgr4iKO. Results were expressed as mean ± SD. h Pseudotime showing Notch related genes expression (left) and heatmap showing UMI value (right). i Western blot and quantification of HES1 protein levels. β-actin was used as loading control. Results were expressed as mean ± SD. j Wnt and Notch related genes of the mouse small intestinal epithelial cell line MODE-K cells treated with the Notch activator VPA (P4543-25G, Sigma). *P < 0.05 vs NC. n = 3. Statistical analysis by two-way ANOVA with Šídák’s multiple comparisons test. *P = 0.0001 for Axin2, *P = 0.0035 for Ccnd1, *P = 0.0003 for Hes1, *P < 0.0001 for Hey1. k mRNA levels of lipid absorption markers of MODE-K cells treated with the Wnt inhibitor IWR-1 (HY-12238, MedChemExpress). *P < 0.05 vs NC. n = 3. Statistical analysis by two-way ANOVA with Šídák’s multiple comparisons test. *P = 0.0178.
Fig. 7
Fig. 7. Graphic highlight of findings.
Deficiency of intestinal Lgr4 reduces enterocytes selective for absorption of long-chain fatty acid, leading to reduction in lipid absorption and subsequent metabolic benefit.

References

    1. Luo CW, Hsueh AJ. Genomic analyses of the evolution of LGR genes. Chang. Gung. Med. J. 2006;29:2–8. - PubMed
    1. Ordaz-Ramos, A., Rosales-Gallegos, V. H., Melendez-Zajgla, J., Maldonado, V. & Vazquez-Santillan, K. The Role of LGR4 (GPR48) in Normal and Cancer Processes. Int. J. Mol. Sci. 22, 4690 (2021). - PMC - PubMed
    1. Mustata RC, et al. Lgr4 is required for Paneth cell differentiation and maintenance of intestinal stem cells ex vivo. EMBO Rep. 2011;12:558–564. doi: 10.1038/embor.2011.52. - DOI - PMC - PubMed
    1. Liu S, et al. Lgr4 gene deficiency increases susceptibility and severity of dextran sodium sulfate-induced inflammatory bowel disease in mice. J. Biol. Chem. 2013;288:8794–8803. doi: 10.1074/jbc.M112.436204. - DOI - PMC - PubMed
    1. Duca FA, Waise T, Peppler WT, Lam T. The metabolic impact of small intestinal nutrient sensing. Nat. Commun. 2021;12:903. doi: 10.1038/s41467-021-21235-y. - DOI - PMC - PubMed

MeSH terms