. 2024 May 23;8(1):116.
doi: 10.1038/s41698-024-00602-0.

Metabolic pathway-based subtypes associate glycan biosynthesis and treatment response in head and neck cancer

Affiliations

Metabolic pathway-based subtypes associate glycan biosynthesis and treatment response in head and neck cancer

Benedek Dankó et al. NPJ Precis Oncol. .

Abstract

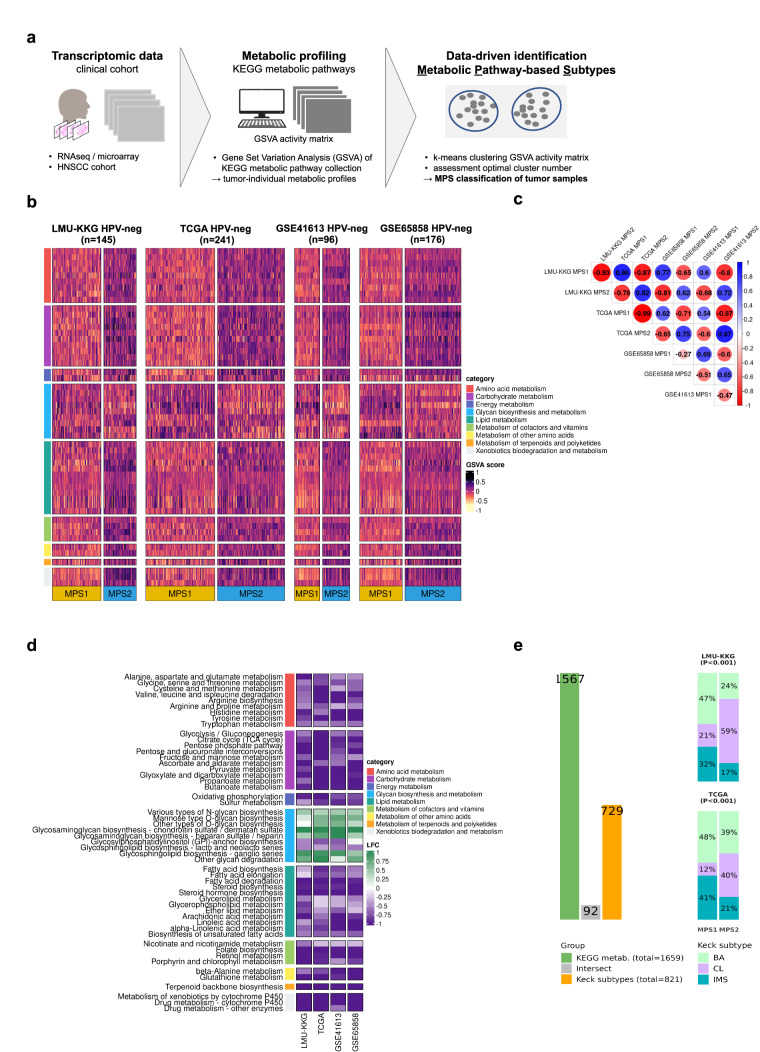
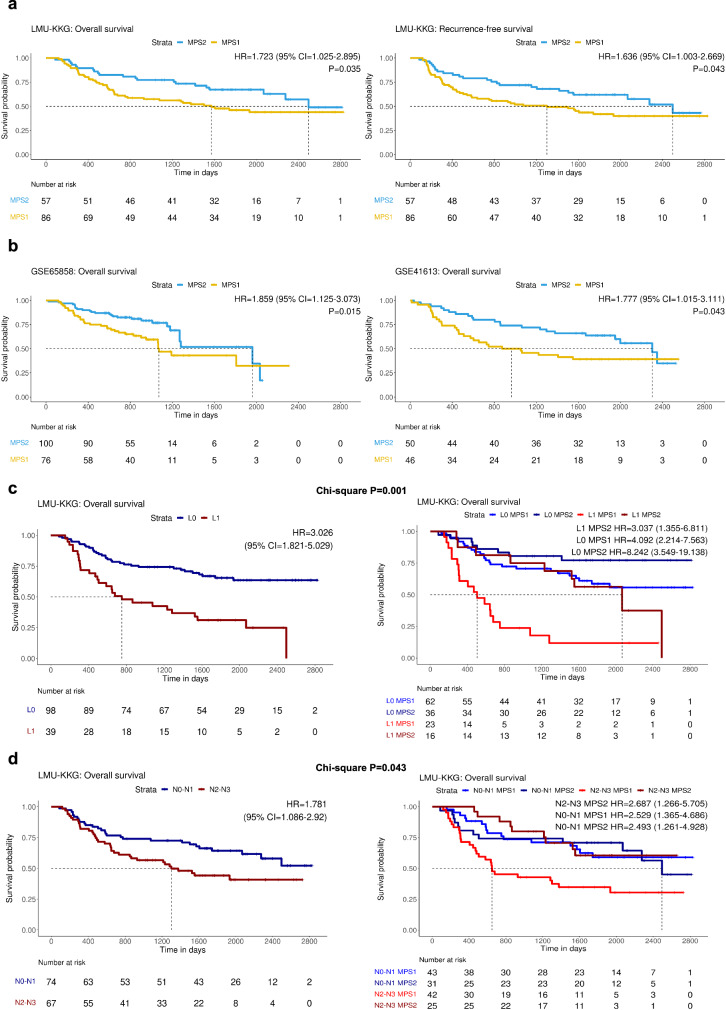
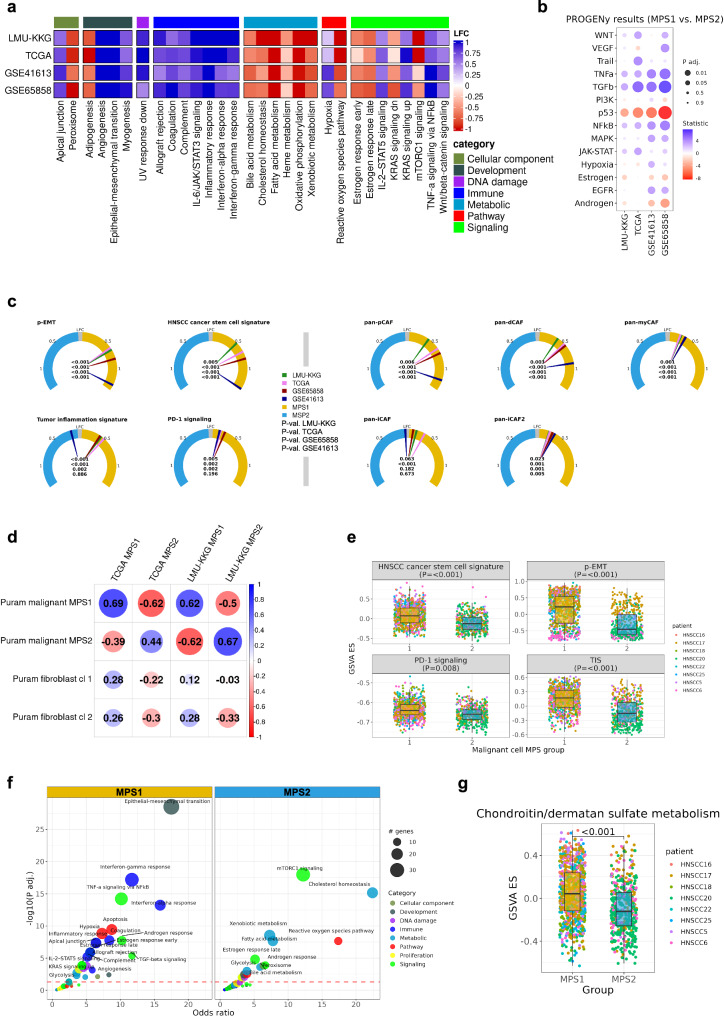
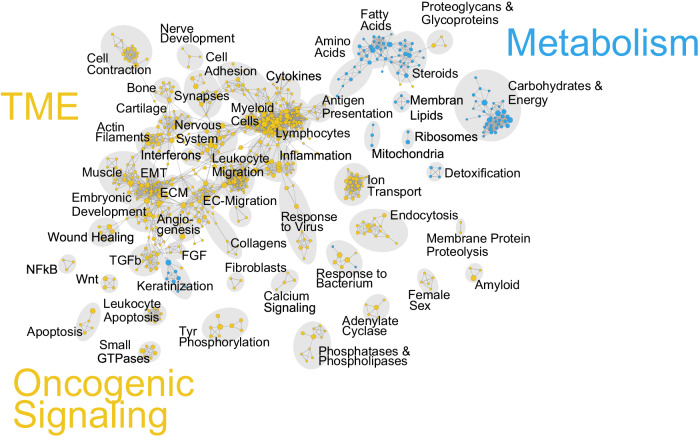
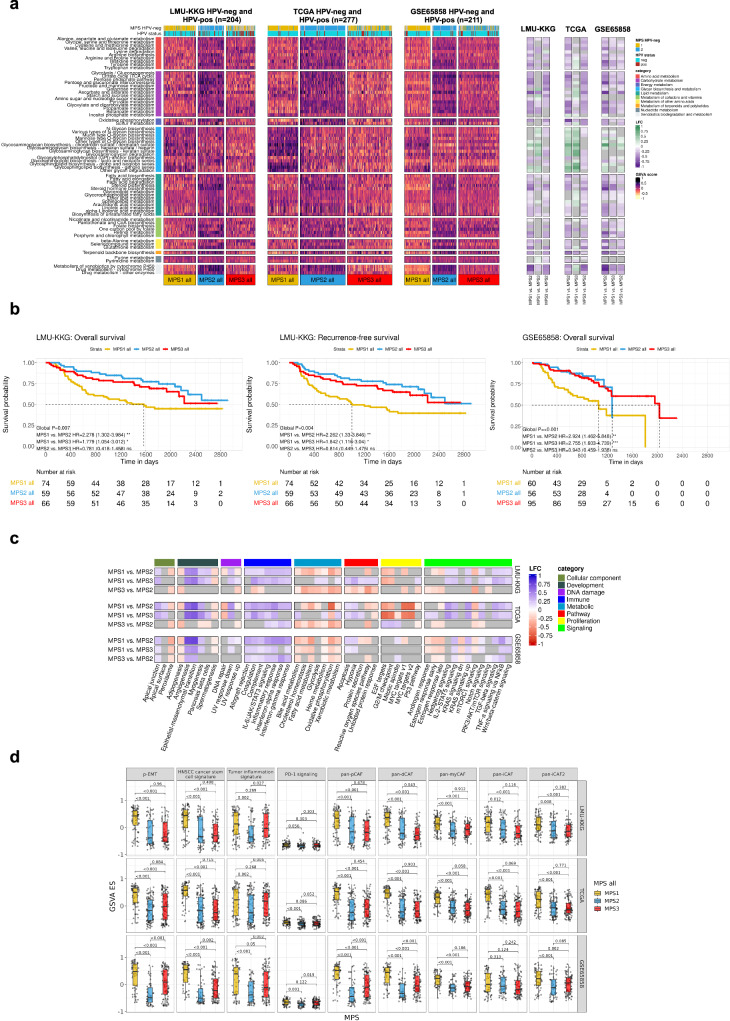
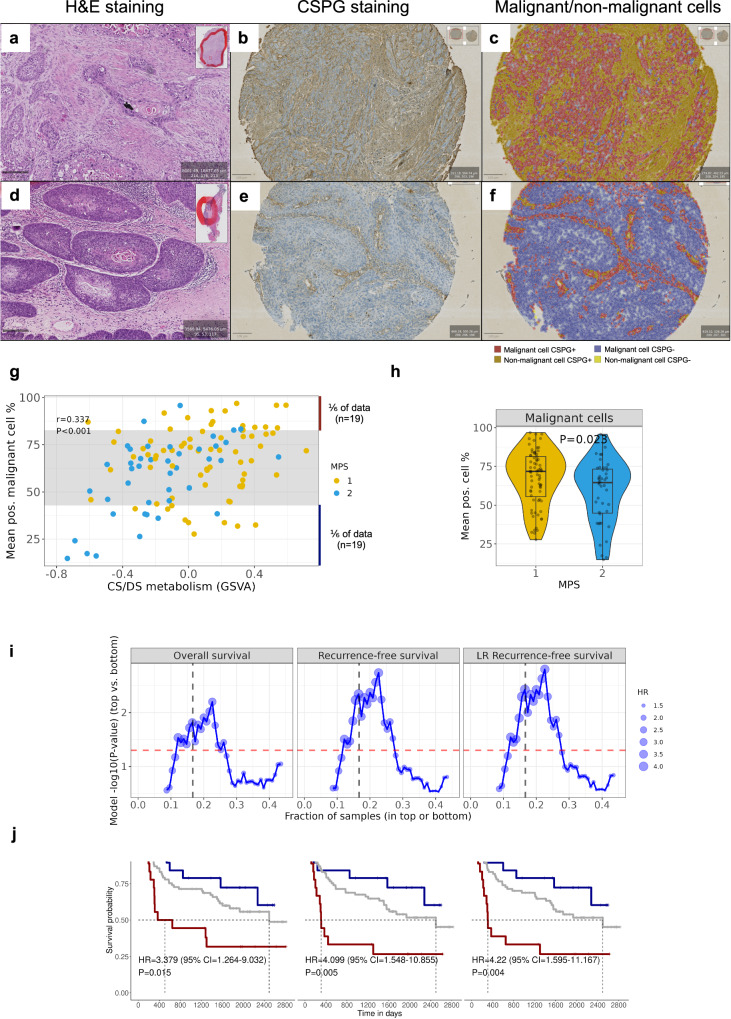
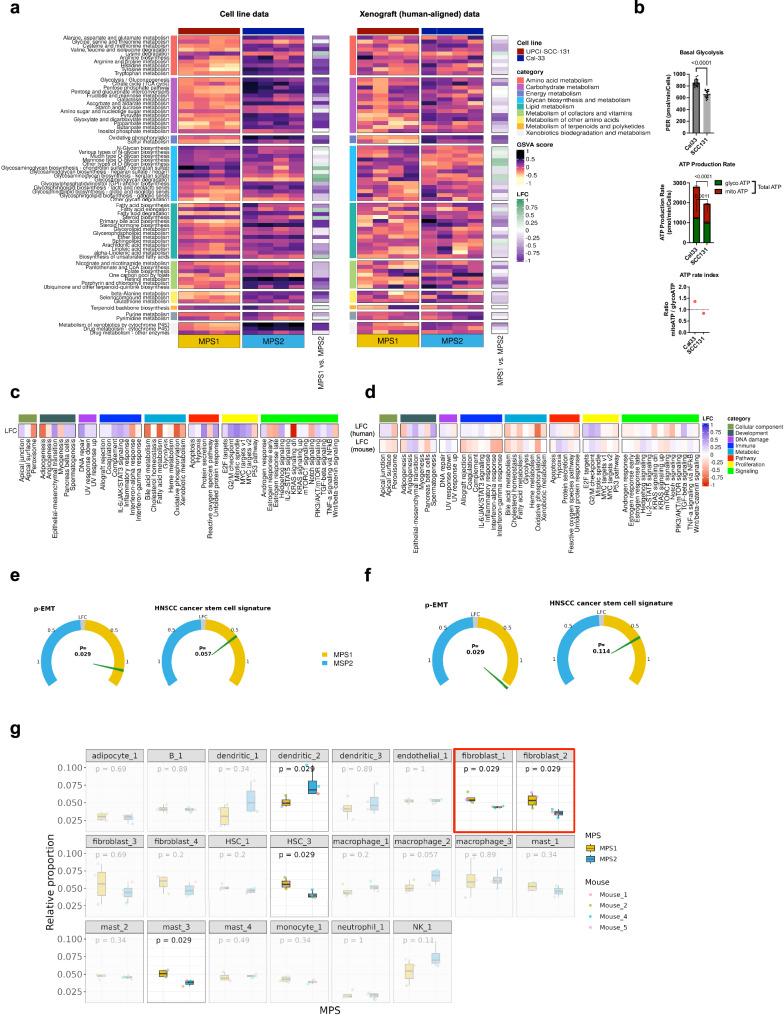
Head and Neck Squamous Cell Carcinoma (HNSCC) is a heterogeneous malignancy that remains a significant challenge in clinical management due to frequent treatment failures and pronounced therapy resistance. While metabolic dysregulation appears to be a critical factor in this scenario, comprehensive analyses of the metabolic HNSCC landscape and its impact on clinical outcomes are lacking. This study utilized transcriptomic data from four independent clinical cohorts to investigate metabolic heterogeneity in HNSCC and define metabolic pathway-based subtypes (MPS). In HPV-negative HNSCCs, MPS1 and MPS2 were identified, while MPS3 was enriched in HPV-positive cases. MPS classification was associated with clinical outcome post adjuvant radio(chemo)therapy, with MPS1 consistently exhibiting the highest risk of therapeutic failure. MPS1 was uniquely characterized by upregulation of glycan (particularly chondroitin/dermatan sulfate) metabolism genes. Immunohistochemistry and pilot mass spectrometry imaging analyses confirmed this at metabolite level. The histological context and single-cell RNA sequencing data identified the malignant cells as key contributors. Globally, MPS1 was distinguished by a unique transcriptomic landscape associated with increased disease aggressiveness, featuring motifs related to epithelial-mesenchymal transition, immune signaling, cancer stemness, tumor microenvironment assembly, and oncogenic signaling. This translated into a distinct histological appearance marked by extensive extracellular matrix remodeling, abundant spindle-shaped cancer-associated fibroblasts, and intimately intertwined populations of malignant and stromal cells. Proof-of-concept data from orthotopic xenotransplants replicated the MPS phenotypes on the histological and transcriptome levels. In summary, this study introduces a metabolic pathway-based classification of HNSCC, pinpointing glycan metabolism-enriched MPS1 as the most challenging subgroup that necessitates alternative therapeutic strategies.


Conflict of interest statement

The authors declare no competing interests.

Figures

Fig. 1
Fig. 1. Metabolic pathway-based subtypes identified in four independent gene expression cohorts.
Transcriptomic data from clinical cohorts were used for KEGG metabolic pathway enrichment quantification by GSVA. GSVA metabolic enrichment matrices were subjected to k-means clustering (with optimal k = 2) for unsupervised metabolic subtype identification (a). Heatmaps of KEGG metabolic pathways enrichment scores, according to the k-means clustering (k = 2) for the LMU-KKG (n = 145), TCGA-HNSC (n = 241), GSE41613 (n = 96), and GSE65858 (n = 176) cohorts, respectively (HPV-neg. only). MPS1 and MPS2 were independently delineated in the four cohorts. 52 metabolic pathways with significant (P adj.<0.05) differences in at least three cohorts between MPS1 and MPS2 are visualized (b). Correlation plot including Pearson’s coefficients of MPS-specific centroids between the four cohorts (c). MPS1 vs. MPS2 log2 fold changes (LFC) of GSVA enrichment scores for the 52 metabolic pathways in the four cohorts (d). Comparison of gene sets used for MPS and “Keck classification”, respectively. MPS1/2 with significantly different Keck subtype frequencies (consistent in LMU-KKG and TCGA) (e). MPS1 is enriched in IMS and BA cases, while CL cases are overrepresented in MPS2. Fisher’s exact test P-value on MPS and Keck subtype <0.001 for both cohorts. BA basal, CL classical, IMS inflamed/mesenchymal, NT matched normal, TP primary tumor, NS non-significant.
Fig. 2
Fig. 2. MPS is associated with radio(chemo)therapy response.
Kaplan-Meier (KM) plots of the LMU-KKG cohort (HPV-negative) for overall survival (OS), and recurrence-free survival (RFS), respectively (a). MPS1 with significantly adverse OS, RFS, and locoregional recurrence-free survival (LR-RFS) compared to MPS2 (LR-RFS, and additional endpoints in Supplementary Figure 4a). Independent validation of MPS1 with adverse OS in two HPV-negative HNSCC data sets (GSE65858 and GSE41613) (b). Risk-group stratification and comparative KM analysis based on established clinical prognostic factors and MPS: lymphovascular invasion (LVI/L stage, c) and N stage (d) for endpoint OS. Clinical variables only (left) and in combination with MPS (right). The two models were compared by chi-square testing, and P-values are shown. Reference groups in pairwise comparisons are L1 MPS1 (c), and N2-3 MPS1 (d), HRs with 95% CI are indicated (additional clinical factors/endpoints in Supplementary Figure 6).
Fig. 3
Fig. 3. Functional characterization of the MPS in bulk and single-cell data.
Differential MPS1 vs. MPS2 hallmarks analysis (GSVA scores) in four individual data sets (LMU-KKG, TCGA, GSE41613, and GSE65858, HPV-negative only) (a). Hallmarks with P adj.<0.05 in at least three cohorts are visualized. PROGENy differential analysis was performed and showed consistent results for eleven cancer-related signaling pathways in the four data sets (b). Gauge charts of LFC values of MPS1 vs. MPS2 with selected gene signatures (GSVA scores, Wilcoxon test, four data sets individually) (c). Correlation plot with Spearman correlation coefficients of the data set-specific MPS/cluster groups (based on KEGG metabolic GSVA enrichment scores) between Puram et al. malignant cells or fibroblast cells, and LMU-KKG or TCGA MPS classes (d). Gene signature comparisons between MPS1 and MPS2 malignant cells of the Puram et al. scRNAseq data (generalized linear mixed models) (e). Enrichment analysis results of MPS1 and MPS2 malignant cell clusters of the Puram et al. data set using the hallmarks signatures (dashed red line P adj.=0.05) (f). Significant upregulation of CS/DS metabolism enrichment scores in MPS1 compared to MPS2 malignant cells (generalized linear mixed models) (g). Cl cluster.
Fig. 4
Fig. 4. Integrated network visualization of enriched biological processes in MPS1 and MPS2 HPV-negative tumors.
Integrated network visualization of MPS1 and MPS2 enriched biological processes was carried out using enrichmentMap. MPS1 vs. MPS2 differential gene expression results of the four cohorts were used to derive a mean-ranked list of genes and pre-ranked gene set enrichment analysis (GSEA) with the gene set collection Gene Ontology Biological Process (GO-BP) was performed and visualized using enrichmentMap. Yellow indicates MPS1-specific, and blue color indicates MPS2-specific terms.
Fig. 5
Fig. 5. Inclusion of HPV-positive HNSCC in MPS classification.
K-means clustering was performed with k = 3 on the HPV-negative and HPV-positive cases of the LMU-KKG, TCGA, and GSE65858 cohorts. Heatmaps of KEGG metabolic pathways GSVA enrichment scores, according to the classes obtained by k-means clustering (k = 3) for the LMU-KKG (n = 204), TCGA-HNSC (n = 277), and GSE65858 (n = 211) cohorts, respectively. 68 intersecting metabolic pathways are visualized. On the right-hand side, LFC values of GSVA scores per pathway for MPS1 vs. MPS2, gray color indicates P adj.>0.05 (a). KM plots of MPS1, MPS2, and MPS3 of the LMU-KKG and GSE65858 cohorts for OS and RFS (LMU-KKG only). Pairwise HRs with 95% CI. ***P-value < 0.001, **P-value >= 0.001 and < 0.01, *P-value >= 0.01 and < 0.05, ns: P-value >= 0.05. Global P: global logrank P-value (b). LFC values of hallmarks GSVA scores comparing the three MPS groups of the three data sets (LMU-KKG, TCGA, and GSE65858), gray color indicates P adj.>0.05 (c). Boxplots and differential testing of gene signatures (GSVA scores) compared between the three MPS of the three data sets, adjusted P-values are indicated (d).
Fig. 6
Fig. 6. ECM remodeling, activated tumor stroma, and elevated chondroitin sulfate proteoglycan (CSPG) level in MPS1.
HE sections of MPS1 (CS/DS metabolism high) and MPS2 (CS/DS metabolism low) tumors in the LMU-KKG cohort (6x magnification, 200 µm scale bar) (a, d). MPS1 (high CS/DS metabolism): activated stroma/ECM rearrangement (a). MPS2 (low CS/DS metabolism): lower level of malignant cells-TME interaction (d). CSPG staining in FFPE tissue sections of MPS1 and MPS2 tumors, respectively, from the LMU-KKG cohort (3x magnification, 100 µm scale bar) (b, c, e, f, additional examples in Supplementary Figs. IHC slides). Elevated fractions of CSPG-positive malignant cells in MPS1 (b, c) compared to MPS2 malignant cells (e, f). Annotation color: red=pos. malignant cell, blue=neg. malignant cell, dark yellow=pos. non-malignant cell, light yellow=neg. non-malignant cell. Scatterplot with GSVA enrichment scores of CS/DS metabolism vs. CSPG-positive malignant cell % of 115 HPV-negative cases from LMU-KKG (Spearman r = 0.337, P < 0.001) (g). The gray interval area indicates the inner 2/3 of the data set. CSPG-positive cell fractions were calculated using QuPath. CSPG-positive malignant cell % difference of MPS1 and MPS2 of the same 115 cases (Wilcoxon P = 0.023) (h). Sliding threshold analysis for definition of top and bottom fraction of cases (based on mean CSPG-positive malignant cell %). Cox models’ HR (dot size), -log10(P-value) (y-axis) for the top vs bottom groups are plotted for varying thresholds (x-axis) (i). Dashed red lines indicate P = 0.05. Dashed black lines indicate the 1/6 fraction threshold for top vs. bottom, as visualized in panels g and in the KM plots in panel j. KM analysis of 114 HPV-negative cases from LMU-KKG (one patient did not have survival data), highlighting the top and bottom 1/6 of tumors (based on CSPG-positive malignant cell %) Cox models’ HR, CI, and P-value for top vs bottom groups (j). HR, 95% CI, and P indicate the comparison of the CSPG high and CSPG low groups.
Fig. 7
Fig. 7. In vitro and orthotopic xenograft models support MPS-specific TME assembly.
KEGG metabolic GSVA scores of UPCI-SCC-131 and Cal33 HNSCC cell lines (each n = 4 replicates) were used for MPS-classification using NSC trained/tested on the LMU-KKG/TCGA HPV-negative cohort (a). Proton Efflux Rate (PER) representing glycolytic rate in Cal33 and UPCI-SCC131 cells determined with a Glycolysis Rate Assay using a Seahorse XFe96 Analyzer and basal glycolysis by Glycolytic rate assay (n = 7 wells each). Total ATP rate, ATP by glycolysis (glyco) and mitochondrial (mito) production in Cal33 by ATP Rate Assay. ATP rate index representing the ratio of ATP production by mitochondria and glycolysis for Cal33 and UPCI-SCC131 (b). LFC values of GSVA MSigDB hallmarks scores of MPS1 vs. MPS2 (c). Gene signatures (p-EMT, HNSCC cancer stem cell signature) were quantified likewise and compared between MPS1 vs. MPS2 (e). UPCI-SCC-131 and Cal33 xenografts were MPS classified (using RNAseq data thereof and NSC), and human-aligned data (tumor cells) KEGG metabolic GSVA scores were visualized (a). Using human and mouse genome-aligned (host cells, TME) data, hallmarks GSVA scores were compared MPS1 vs. MPS2 (d), and accordingly, human-aligned gene signatures were compared between MPSs (f). Mouse genome-aligned gene expression data were utilized in cell type deconvolution of the TME using the SSMD tool, and relative proportions of cell types were compared between MPS1 and MPS2 (g). LFC log2 fold change, HSC hematopoietic stem cell.

References

    1. Johnson DE, et al. Head and neck squamous cell carcinoma. Nat. Rev. Dis. Prim. 2020;6:1–22. - PMC - PubMed
    1. Lawrence MS, et al. Comprehensive genomic characterization of head and neck squamous cell carcinomas. Nature. 2015;517:576–582. doi: 10.1038/nature14129. - DOI - PMC - PubMed
    1. Chen SMY, et al. Tumor immune microenvironment in head and neck cancers. Mol. Carcinog. 2020;59:766–774. doi: 10.1002/mc.23162. - DOI - PMC - PubMed
    1. Schrank TP, et al. Noncanonical HPV carcinogenesis drives radiosensitization of head and neck tumors. Proc. Natl Acad. Sci. 2023;120:e2216532120. doi: 10.1073/pnas.2216532120. - DOI - PMC - PubMed
    1. Peltanova B, Raudenska M, Masarik M. Effect of tumor microenvironment on pathogenesis of the head and neck squamous cell carcinoma: a systematic review. Mol. Cancer. 2019;18:63. doi: 10.1186/s12943-019-0983-5. - DOI - PMC - PubMed