. 2024 Oct;31(10):1625-1639.
doi: 10.1038/s41594-024-01313-7. Epub 2024 May 23.

TET activity safeguards pluripotency throughout embryonic dormancy

Affiliations

TET activity safeguards pluripotency throughout embryonic dormancy

Maximilian Stötzel et al. Nat Struct Mol Biol. 2024 Oct.

Abstract

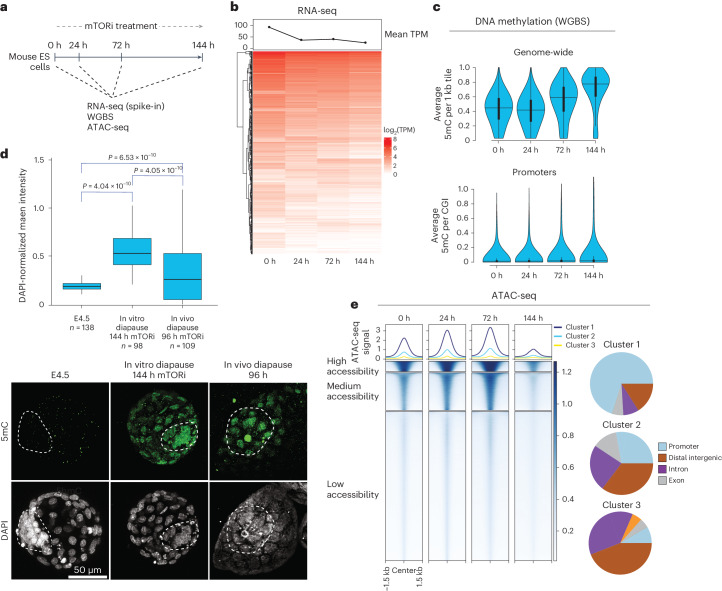
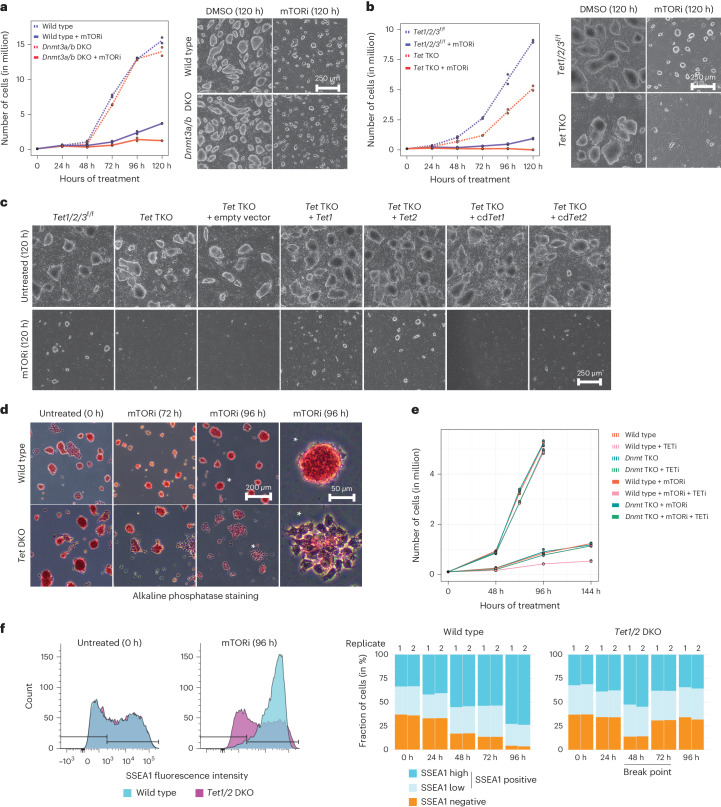
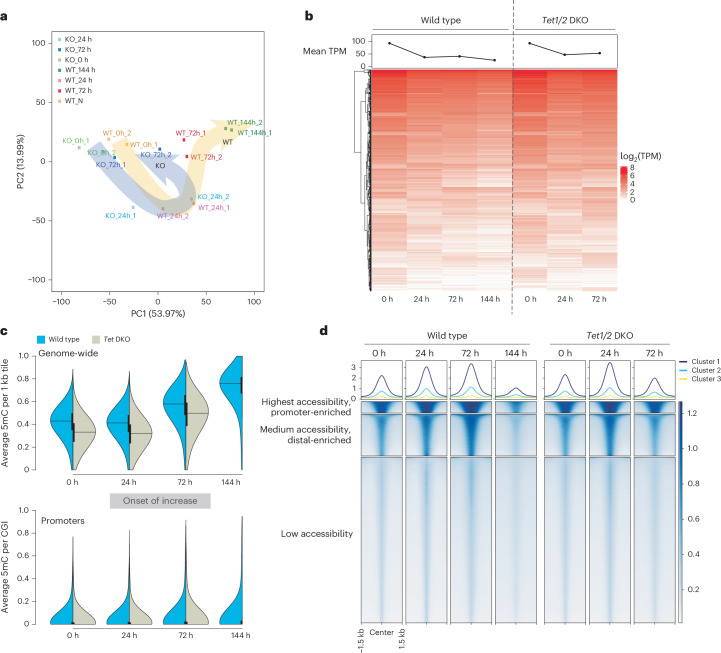
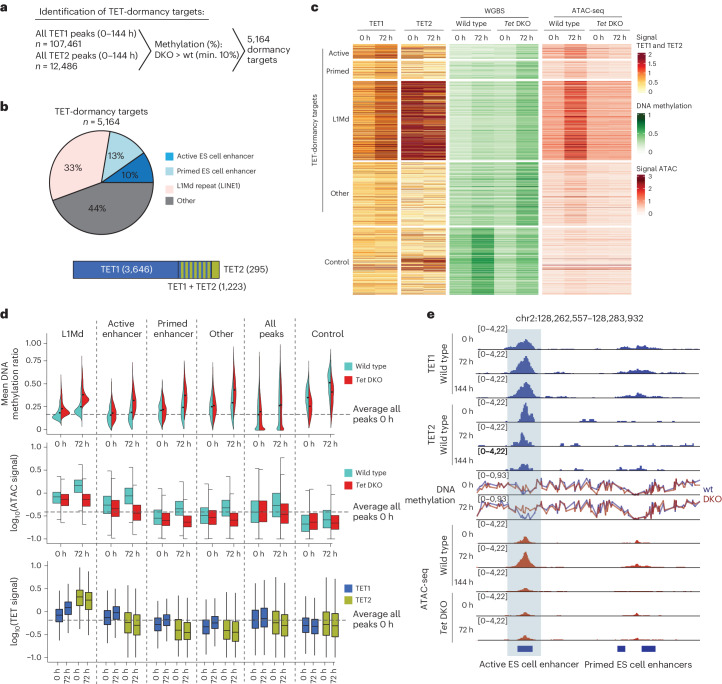
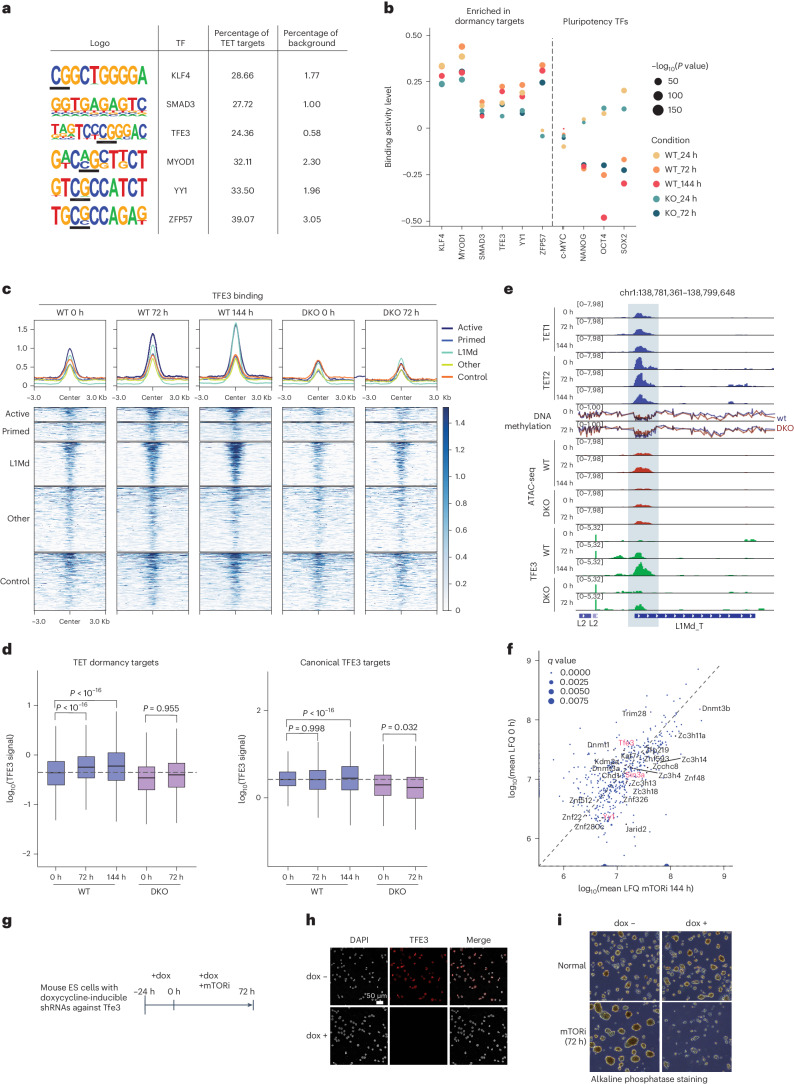
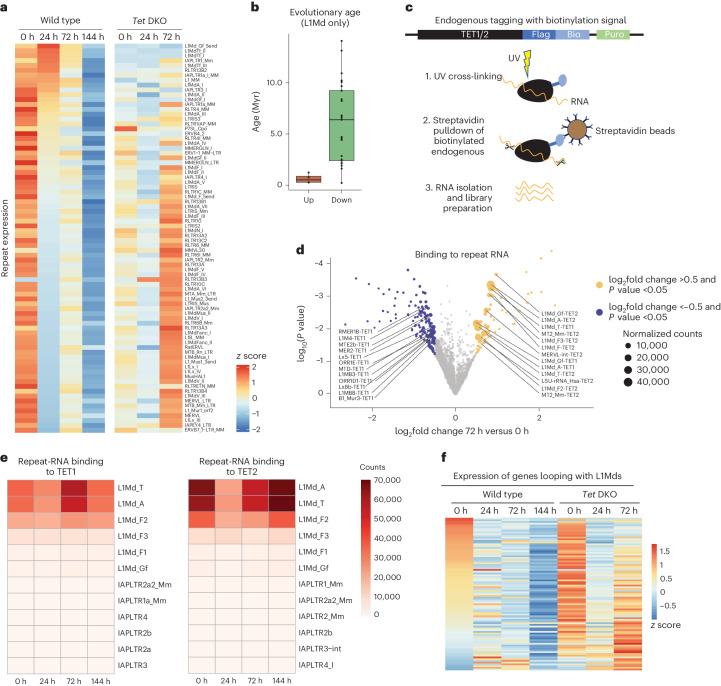
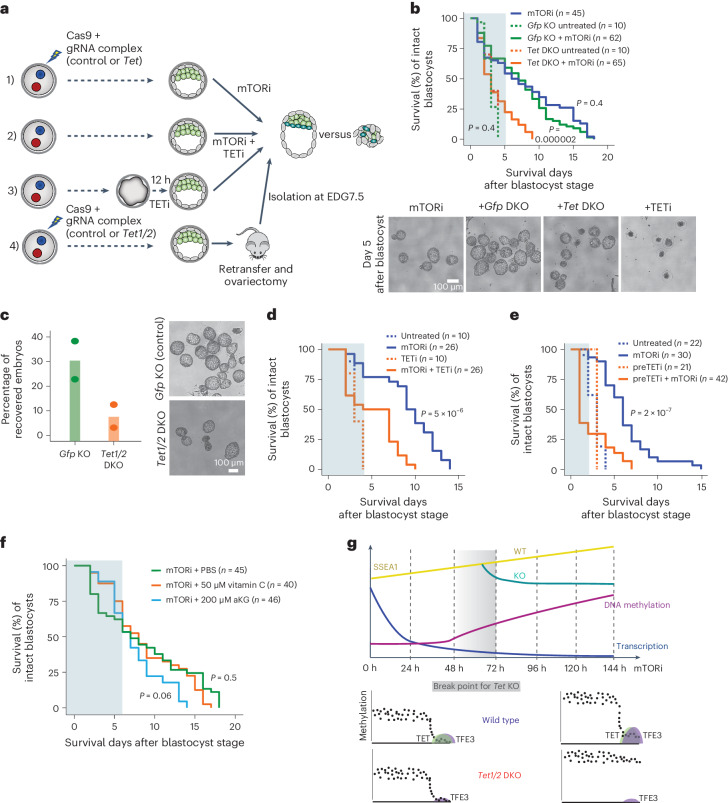
Dormancy is an essential biological process for the propagation of many life forms through generations and stressful conditions. Early embryos of many mammals are preservable for weeks to months within the uterus in a dormant state called diapause, which can be induced in vitro through mTOR inhibition. Cellular strategies that safeguard original cell identity within the silent genomic landscape of dormancy are not known. Here we show that the protection of cis-regulatory elements from silencing is key to maintaining pluripotency in the dormant state. We reveal a TET-transcription factor axis, in which TET-mediated DNA demethylation and recruitment of methylation-sensitive transcription factor TFE3 drive transcriptionally inert chromatin adaptations during dormancy transition. Perturbation of TET activity compromises pluripotency and survival of mouse embryos under dormancy, whereas its enhancement improves survival rates. Our results reveal an essential mechanism for propagating the cellular identity of dormant cells, with implications for regeneration and disease.


Conflict of interest statement

I.A.I. and T.A. are inventors on a patent application (no. EP3325621B1, European Patent Office) regarding the s-oligo design used in FLASH experiments. The other authors declare no competing interests.

Figures

Fig. 1
Fig. 1. Time-resolved genomic analysis of the transition of ES cells into dormancy.
a, Experimental workflow to profile transcriptional and chromatin features of ES cells entering mTORi-induced dormancy. Two replicates were performed for all experiments. Sequencing depth and quality control parameters can be found in Extended Data Fig. 1a. b, Bulk RNA-seq heatmap showing expression of all genes over time in ES cells treated with mTORi. All samples are normalized to ERCC spike-in RNAs to accurately reflect global changes. The line plot on top shows mean TPM at each time point. c, DNA methylation levels in ES cells as mapped by whole genome bisulfite sequencing (WGBS). Top: average DNA methylation levels of the entire genome in 1 kb tiles. Bottom: DNA methylation levels of CpG islands (CGI). Horizontal lines show the median; vertical box plots within violin plots show interquartile range (IQR), and the whiskers show 1.5 IQR. d, Bottom: IF of E4.5, in vitro and in vivo-diapaused mouse blastocysts for 5mC methylation. Top: single-nucleus quantifications of mean 5mC intensity, normalized to DAPI. The horizontal line shows the median, the box spans the IQR and whiskers span 1.5 IQR. n, number of cells. Statistical test is a one-way ANOVA. The dashed lines mark the inner cell mass (ICM). Note that the ICM of diapaused embryos sometimes polarizes, as reported before. Accompanying stainings can be found in Extended Data Fig. 2. e, The accessibility of regulatory elements in ES cells as mapped by ATAC-seq. All accessible regions were determined by peak calling, then clustered into three groups showing high, medium and low accessibility (clusters 1, 2 and 3, respectively). Right panels show the genomic composition of each cluster. Cluster 1 is enriched for promoters; clusters 2 and 3 are enriched for distal regulatory elements. No new peaks were gained during the treatment. Source data
Fig. 2
Fig. 2. Catalytic activities of TET DNA demethylases are indispensable for the maintenance of pluripotency during dormancy.
a, Proliferation curves and brightfield images of wild-type and Dnmt3a/b DKO ES cells (devoid of de novo methyltransferase activity) treated with the mTOR inhibitor INK128 for 120 h. Data are from two biological replicates. Individual data points are shown; lines denote the mean. b, Same as in a for Tet1/2/3flox/flox versus Tet1/2/3 TKO iPS cells. Tet TKO cells lose pluripotent colony morphology over time under dormancy conditions. c, Rescue of Tet TKO dormancy defect via overexpression of wild-type, but not catalytic-dead (cd), Tet1 or Tet2. The catalytic-dead mutations can be found in Methods and Extended Data Fig. 3d. Images are representative of two biological replicates. d, Alkaline phosphatase staining of an independently generated, feeder-independent Tet1/2 DKO ES cell line in normal and mTORi conditions. See Extended Data Fig. 3e–g for details of the deletions and accompanying proliferation curves. Tet1/2 DKO ES cells lose pluripotent colony morphology and marker (alkaline phosphatase) expression during mTORi treatment. The rightmost images are magnifications of the asterisk-marked colonies. Images are representative of two biological replicates. e, Rescue of Tet TKO dormancy defect in the absence of DNMT activity. Wild-type or Dnmt TKO ES cells were treated with the TET inhibitor (TETi) Bobcat339 with or without mTORi. TETi-treated cells are depleted specifically under mTORi treatment in wild-type but not Dnmt TKO ES cells. Individual data points are shown; lines denote the mean. f, Flow cytometry analysis of SSEA1 expression levels (a pluripotency marker) in wild-type and Tet1/2 DKO cells in normal and mTORi conditions. Left: overlays of SSEA1 expression at 0 h versus 96 h in wild-type or Tet1/2 DKO cells. Right: stacked bar plots showing quantification of SSEA1 expression levels at all quantified time points. All flow cytometry plots are shown in Extended Data Fig. 4a. Data from two biological replicates are shown. Source data
Fig. 3
Fig. 3. Tet1/2 DKO ES cells fail to correctly rewire chromatin and install the transcriptional program of paused pluripotency.
a, Principal components (PC) analysis (based on 5,000 most variable genes between 0 h and 144 h wild type) of all RNA-seq samples. Tet1/2 DKO cells were collected until 72 h before differentiation of colonies. Two replicates were performed for all experiments. Sequencing depth and quality control parameters can be found in Extended Data Fig. 1a. Tet1/2 DKO cells initiate the dormancy program but fail to fully establish it. b, Spike-in normalized bulk RNA-seq heatmap showing expression of all genes over time in wild-type versus Tet1/2 DKO ES cells treated with mTORi. The line plot on top shows mean TPM at each time point. c, DNA methylation levels in wild-type versus Tet1/2 DKO ES cells as mapped by whole genome bisulfite sequencing. Average DNA methylation levels of the entire genome in 1 kb tiles (top) or CpG islands (CGI) (bottom) are shown. Horizontal lines show the median; box plots within violin plots show interquartile range (IQR), and the whiskers show 1.5 IQR. d, The accessibility of regulatory elements in wild-type versus Tet1/2 DKO ES cells as mapped by ATAC-seq. All accessible regions as determined by peak calling were clustered into three groups showing high, medium and low accessibility (clusters 1, 2 and 3, respectively).
Fig. 4
Fig. 4. TETs counteract DNA methylation at ES cell enhancers and young LINE1 elements.
a, Identification of TET-dormancy targets. Sites that are bound by TET1 and/or TET2 in the wild type (wt) and that are kept demethylated by TET activity (that is, methylation is increased only in the Tet1/2 DKO at a minimum (min.) of 10%) are specified as targets. b, Pie chart showing the distribution of different genomic features within TET-dormancy targets. The bar plot shows TET1- and/or TET2-bound targets as determined by CUT&Tag. The ‘Other’ cluster contains a variety of repetitive elements other than L1Md family LINE1 repeats, with no specific enrichment. c, A heatmap showing mean levels of TET occupancy, DNA methylation and chromatin accessibility at TET-dormancy targets in wild-type versus Tet1/2 DKO ES cells over time during mTORi treatment. Control: 2,000 random sites with increased DNA methylation in wild-type cells at 72 h compared to 0 h. Accompanying heatmaps showing signal distirubution can be found in Extended Data Fig. 6a. d, Quantification of data shown in c versus all TET peaks. The dashed lines show the median signal at all TET peaks in wild-type ES cells at 0 h. The horizontal lines show the median; the box plot within violin plots shows interquartile range (IQR), and the whiskers show 1.5 IQR. e, Genome browser view of an example TET-dormancy target active enhancer and a neighboring nontarget primed enhancer.
Fig. 5
Fig. 5. TET activity at dormancy targets mediates TF binding.
a, TF motif enrichment analysis at TET-dormancy targets. The presented motifs are all significant with P value <0.0001. b, TF footprinting analysis of predicted TET-activity-coupled TFs versus classical pluripotency TFs. ATAC-seq signal from wild-type and Tet1/2 DKO cells was used. TFE3, YY1 and ZFP57 footprints are elevated and remain high at 144 h in wild-type cells compared to Tet1/2 DKO cells. In contrast, footprints of pluripotency-associated TFs are reduced. Significance (P values) of the binding activity of TFs was derived with the BINDetect function of the TOBIAS package. c, Levels of TFE3 binding at TET-dormancy targets versus controls, mapped by CUT&Tag. TFE3 occupancy increases over time specifically at sites that are kept demethylated by TETs, and particularly at L1Md repeats and active enhancers. Accompanying quantifications are in d and Extended Data Fig. 6b. d, Quantification of data shown in c versus canonical TFE3 targets (as identified by peak calling at t = 0 h). The dashed lines show the median TFE3 signal in wild-type (WT) ES cells at 0 h. Statistical test is a one-way ANOVA with Tukey’s multiple comparison test. Horizontal lines denote the median, and lower and upper hinges denote the first and third quartiles. The whiskers denote 1.5 times the interquartile range. e, Genome browser view of an example TET-dormancy L1Md repeat showing TET and TFE3 occupancy, DNA methylation and genome accessibility. f, Proteins co-precipitated with TET1, as identified by IP–MS. Label-free quantification (LFQ) values are plotted. g, The experimental outline of inducible TFE3 knockdown (Tfe3 iKD) and mTORi treatment. h, IF images showing efficient knockdown of TFE3 expression after 24 h of doxycycline (dox) treatment. The images are representative of two biological replicates. i, Alkaline phosphatase staining of control or Tfe3 iKD ES cells with or without mTORi treatment. Tfe3 iKD ES cells lose pluripotent colony morphology and marker expression after 72 h of mTORi culture. The images are representative of two biological replicates. Source data
Fig. 6
Fig. 6. Expression and TET binding of young LINE1 elements in ES cells during the transition into dormancy.
a, The expression levels of repetitive elements in wild-type and Tet1/2 DKO ES cells at indicated time points of mTORi treatment. Reads were mapped to the consensus sequence of each repeat retrieved from RepBase. L1Md repeats are transiently upregulated at 24 h of mTORi treatment. b, The evolutionary age of LINE1 repeats that are upregulated versus downregulated at 24 h of mTORi in wild-type cells. The horizontal lines denote the median, and lower and upper hinges denote the first and third quartiles. The whiskers denote 1.5 times the interquartile range. The dots show individual values. c, Schematics of the FLASH experiment to map TET-bound RNAs. The protocol allows stringent washes due to streptavidin-mediated capture. d, A volcano plot showing RNAs that are differentially bound to TET1/2 at 72 h compared to 0 h of mTORi versus 0 h. Both TET1 and TET2 bind L1Md repeats. Differential binding at 24 and 144 h is shown in Extended Data Fig. 7c. P values and log2 fold changes were derived using DEseq2. e, Binding of L1Md and IAPLTR repeat RNAs to TET1/2 at all time points. Note that IAPLTRs are also transiently upregulated (shown in a) but do not bind TETs. f, The expression levels of genes in putative contact with L1Md promoters. Contact was determined by analysis of published HiC datasets (Methods) with a contact probability >15. TET activity at L1Md elements is uncoupled from transcription during dormancy. Source data
Fig. 7
Fig. 7. Chromatin dynamics at TET-dormancy targets during dormancy entry and exit.
a, Levels of the indicated histone marks at TET-target active enhancers and L1Mds as well as control regions in wild-type and Tet1/2 DKO cells over a 144 h time course of mTORi-mediated pausing and release. Tet1/2 DKO cells were paused for 72 h and then released to avoid loss of pluripotent colonies. The lines show mean values, and the shading shows the confidence interval. The dashed lines denote levels of each mark at 0 h in the color-corresponding genetic background. Extended Data Figs. 8 and 9 contain extended overviews of other TET-dormancy targets and pausing durations up to 15 days. b, Genome browser view of chromatin dynamics at the same active ES cell enhancer shown in Fig. 4e. The enhancer fails to accumulate H3K4me1 and H3K27ac as well as TFE3 in Tet1/2 DKO cells during pausing and at release. c, Levels of shown enhancer marks in all active ES cell enhancers excluding TET-dormancy targets. H3K27ac levels decline below 0 h after 96 h and only reach original levels at 120 h of release. The lines show mean values, and the shading shows the confidence interval. d, Quantifications of the shown enhancer marks in all versus TET-target active enhancers. The dashed lines denote levels of each mark at 0 h in the color-corresponding genetic background. TET targets acquire acetylation earlier than all enhancers in released wild-type (wt) cells and show larger deficit in Tet1/2 DKO. The vertical lines of box plots denote the median, and lower and upper hinges the first and third quartiles, respectively. Whiskers extend no further than 1.5 times the interquartile range from the lower and upper hinge, respectively. e, Flow cytometry analysis of the pluripotency marker SSEA1 during pausing and after release in wild-type and Tet1/2 DKO cells. At 48 h of pausing, Tet1/2 DKO cells appear similar to wild type in SSEA1 expression pattern, but already show defective reactivation.
Fig. 8
Fig. 8. Loss- and gain-of-function perturbations underline the requirement for TET activity in diapause.
a, Workflow of genetic and pharmacological TET loss-of-function experiments. b, Top: survival curves of Tet DKO and control blastocysts in culture. n, number of embryos used in each experiment. Statistical test is log-rank test (R package survdiff) comparing each condition to mTORi-only pausing. The time window in which wild-type and Tet loss-of-function embryos show the most divergent response is highlighted. Bottom: brightfield images of representative embryos captured on indicated days of pausing. The same criteria are applied in df. c, Left: in vivo diapause efficiency of retransferred control or Tet1/2 DKO blastocysts. TET deficiency significantly reduces the recovery rate after in vivo diapause. Right: representative brightfield images. d, Survival curves of control, TETi- and TETi + mTORi-treated blastocysts in culture. n, number of embryos used in each experiment. e, The same as in d but with pretreatment of embyos with TETi for 12 h before blastocyst stage. f, Survival curves of mTORi-treated blastocysts supplemented with TET cofactors. g, Model summarizing the global changes in transcription, DNA methylation and pluripotency status during the transition into dormancy. Bottom panels illustrate the locus-specific regulation at TET-dormancy targets and include DNA methylation levels, TET and TFE3 binding in wild-type and Tet1/2 DKO cells. Source data
Extended Data Fig. 1
Extended Data Fig. 1. Further characterization of genomic features of paused pluripotency.
a. Summary of read depth and quality control parameters of RNA-seq, WGBS, and ATAC-seq experiments. b. Plots showing the linearity of ERCC spike-ins in all RNA-seq samples. Correction factor was extracted by calculating the ratio of reads mapped to ERCCs and the mouse genome. c. Global clustering of ATAC-seq samples.
Extended Data Fig. 2
Extended Data Fig. 2. DNA methylation dynamics during diapause and reactivation.
a. Global clustering of WGBS samples. b. DNA methylation levels of different genomic features in wild-type ESCs over time during mTORi treatment. White dots show the median; vertical box plots within violin plots show interquartile range (IQR) and the whiskers show 1.5 IQR. c. Immunofluorescence of untreated or mTORi treated ESCs for 5mC and 5hmC methylation. Bottom, single-nucleus quantifications of 5mC and 5hmC intensities normalized to DAPI. n, number of cells. Statistical test is two-tailed t-test. d. Immunofluorescence of E4.5, in vivo diapaused, and reactivated (48 h post in vivo diapause) mouse blastocysts for 5mC methylation. Right, single-nucleus quantifications of 5mC intensity normalized to DAPI. Horizontal line shows the median, box spans the IQR and whiskers span 1.5 IQR. n, number of cells. Statistical test is a one-way Anova with Tukey’s multiple comparison test. Dashed lines mark the ICM. Source data
Extended Data Fig. 3
Extended Data Fig. 3. Characterization of Tet KO and Dnmt KO ESC.
a. Bulk RNA-seq heatmap showing expression of all genes over time in wild-type vs Dnmt3a/b DKO ESCs treated with mTORi. All samples are normalized to ERCC spike-in RNAs to accurately reflect global changes. Line plot on top shows mean TPM at each time point. b. Principal components analysis (based on 5000 most variable genes between 0 h and 144 h wild-type) of RNA-seq samples. Two replicates were performed for all experiments. c. Genomic PCR of Tet1/2/3 TKO iPSCs. Parental Tet1/2/3flox/flox cells were transiently transfected with a plasmid carrying the Cre recombinase. Single cells were sorted on 96-well plates and individual clones were genotyped. Clone 18 (indicated with asterisks) was used for follow-up experiments. d. DNA sequence of catalytic-dead (cd) Tet1 and Tet2 overexpression constructs. Mutated sequences are highlighted in red. e. Strategy for generating Tet1/2 DKO ESCs. Blue lines indicate gRNAs and red lines indicate PCR primers. f. Genotyping PCR of Tet1/2 DKO ESCs with indicated primers. g. Western blot results showing depletion of TET1 and TET2 in Tet1/2 DKO (C36) ESCs. h. Bright field images and survival curves of wild-type and Tet1/2 DKO ESCs (E14 cells, feeder-independent) treated with the mTOR inhibitor INK128. Images are representative for two biological replicates. Individual data points shown, lines denote the mean. Source data
Extended Data Fig. 4
Extended Data Fig. 4. Detailed characterization of wild-type and Tet1/2 DKO ESCs’ response to mTORi-induced dormancy.
a. Flow cytometry analysis of SSEA1 expression levels (a pluripotency marker) in wild-type and Tet1/2 DKO cells in normal and mTORi conditions. b. Flow cytometry analysis of apoptosis levels in wild-type and Tet1/2 DKO cells in normal and mTORi conditions. Annexin V was used as an apoptosis marker. c. Quantification of Annexin V-positive and -negative cells at each time point. Data is shown for two biological replicates. Source data
Extended Data Fig. 5
Extended Data Fig. 5. Further characterization of Tet1/2 DKO ESCs’ response to mTORi-induced dormancy.
a. Correlation of pathway expression in wild-type and Tet1/2 DKO ESCs at 24 h and at 72 h of mTORi treatment. Significance of correlation was tested by a linear regression t-test (two-tailed). b. Differentially expressed genes in Tet1/2 DKO vs. wild-type at 72 h of mTORi treatment. P-values and log2 fold changes were derived using DEseq2. c. DNA methylation levels of different genomic features in wild-type vs Tet1/2 DKO ESCs. White dots show the median; vertical box plots within violin plots show interquartile range (IQR) and the whiskers show 1.5 IQR. d. RNA expression levels of Tet and Dnmt enzymes in untreated vs mTORi treated wild-type ESCs over time. TPM, transcripts per kilobase million. e. Expression of TET1 and TET2 proteins in untreated vs mTORi treated (144 h) wild-type ESCs. N: nuclear, C: cytoplasmic extract. Three biological replicates were performed. Source data
Extended Data Fig. 6
Extended Data Fig. 6. Further analysis of TFE3 binding levels at TET-target and control regions.
a. Heatmaps showing TET occupancy (TET1), DNA methylation (WGBS), and genome accessibility (ATAC-Seq) at TET-dormancy-targets vs control regions. b. RNA expression levels (TPM) of the transcription factors shown in Fig. 5a and b. c. Boxplots showing TFE3 binding levels at TET-dormancy-targets and control regions. Horizontal lines denote the median, lower and upper hinges denote the first and third quartiles. Whiskers show 1.5 times the interquartile range. d. Western blot showing Flag-immunoprecipitated material from Tet1-Flag and wild-type ESCs. Three biological replicates were performed. Source data
Extended Data Fig. 7
Extended Data Fig. 7. Further analysis of TET-RNA binding.
a. Schematics of FLASH tag insertion into the Tet1 and Tet2 loci. b. Western blots showing successful pull-down of the tagged TET1 and TET2 proteins. c. Differential binding levels of TET1 to repeat RNAs at 24 h and 144 h compared to 0 h. Gray indicates no significant differences between the time points. P-values and log2 fold changes were derived using DEseq2. d. Expression levels of top genes that contact TET-target active enhancers (ABC-score>0.02) as determined by analysis of published HiC and H3K27ac datasets. TET activity at enhancers is largely uncoupled from transcription under dormancy conditions. Source data
Extended Data Fig. 8
Extended Data Fig. 8. Further investigation of chromatin dynamics of pausing.
a. Levels of the indicated histone marks at TET-target primed enhancers, the Other category (see Fig. 4c), and at all TET-bound peaks in wild-type and Tet1/2 DKO cells over 144 h time course of mTORi-mediated pausing and release. Tet1/2 DKO cells were paused for 72 h to avoid loss of pluripotent colonies. Lines show mean values, shade shows the confidence interval. Dashed lines denote levels of each mark at 0 h in each genetic background. b. Levels of the indicated histone marks at the shown regions during longer-term pausing. Time points up to 15 days were collected in wild-type cells. Lines show mean values, shade shows the confidence interval.
Extended Data Fig. 9
Extended Data Fig. 9. Histone marks at TET-dormancy target and control regions.
a-c. Distribution of H3K27ac (a), H3K4me3 (b), H3K4me1 (c) over pause and release time points in wild-type and Tet1/2 DKO cells. Plots are centered at peaks and 2 kb flanking regions on each side are shown. Histone marks show feature-appropriate patterns (for example no H3K4me3 at enhancers).
Extended Data Fig. 10
Extended Data Fig. 10. Characterization of Tet KO embryos.
a. Schematics of Cas9-assisted Tet deletions via zygotic electroporation. b. RT-qPCR showing expression levels of Tet1/2/3 RNAs in control vs. targeted embryos. Each data point represents an embryo. 3 out of 8 embryos carry homozygous KOs for all Tet genes. Statistical test is a two-way ANOVA with Sidak-test for multiple comparison, comparing the means of Tet-expression of wild-type versus Tet-TKO embryos. Error bars represent the standard deviation. c. Phenotype of Tet TKO vs control embryos collected at E8.5 after retransfer. Scale bar = 500 µm. Three biological replicates were performed. A: anterior, P posterior. d. Survival curves of Tet TKO embryos under mTORi-induced dormancy conditions. Statistical test is log-rank test (R package survdiff) comparing Tet TKO with control under mTORi conditions. e. 5hmC dot blot for control and Bobcat339-treated ESCs. Source data

References

    1. Renfree, M. B. & Fenelon, J. C. The enigma of embryonic diapause. Development144, 3199–3210 (2017). - PubMed
    1. van der Weijden, V. A. & Bulut-Karslioglu, A. Molecular regulation of paused pluripotency in early mammalian embryos and stem cells. Front. Cell Dev. Biol.9, 708318 (2021). - PMC - PubMed
    1. Fu, Z. et al. Integral proteomic analysis of blastocysts reveals key molecular machinery governing embryonic diapause and reactivation for implantation in mice. Biol. Reprod.90, 1–11 (2014). Article 52. - PubMed
    1. Iyer, D. P. et al. Combinatorial microRNA activity is essential for the transition of pluripotent cells from proliferation into dormancy. Preprint at bioRxiv10.1101/2023.12.20.572612 (2023). - PMC - PubMed
    1. Collignon, E. et al. m6A RNA methylation orchestrates transcriptional dormancy during paused pluripotency. Nat. Cell Biol.25, 1279–1289 (2023). - PMC - PubMed