. 2024 Aug;31(8):1085-1098.
doi: 10.1038/s41418-024-01314-5. Epub 2024 May 23.

MLKL promotes hepatocarcinogenesis through inhibition of AMPK-mediated autophagy

Affiliations

MLKL promotes hepatocarcinogenesis through inhibition of AMPK-mediated autophagy

Xianjun Yu et al. Cell Death Differ. 2024 Aug.

Abstract

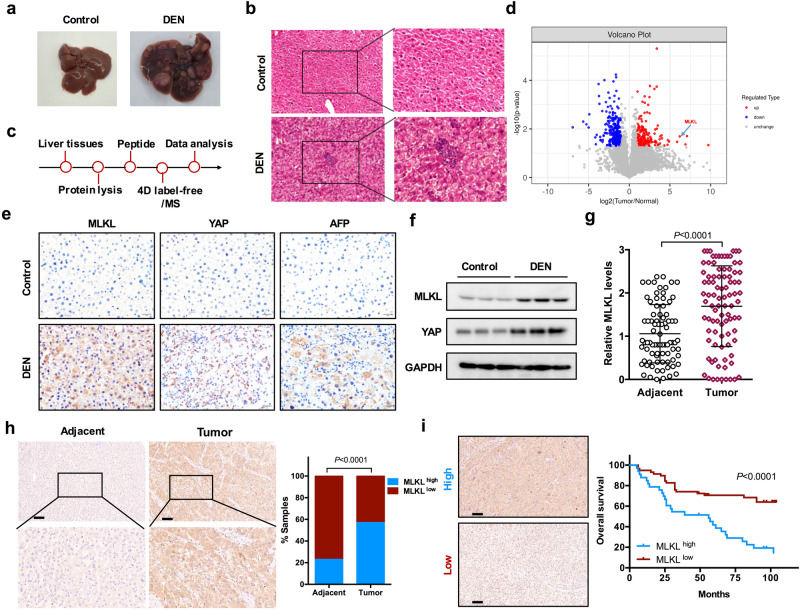
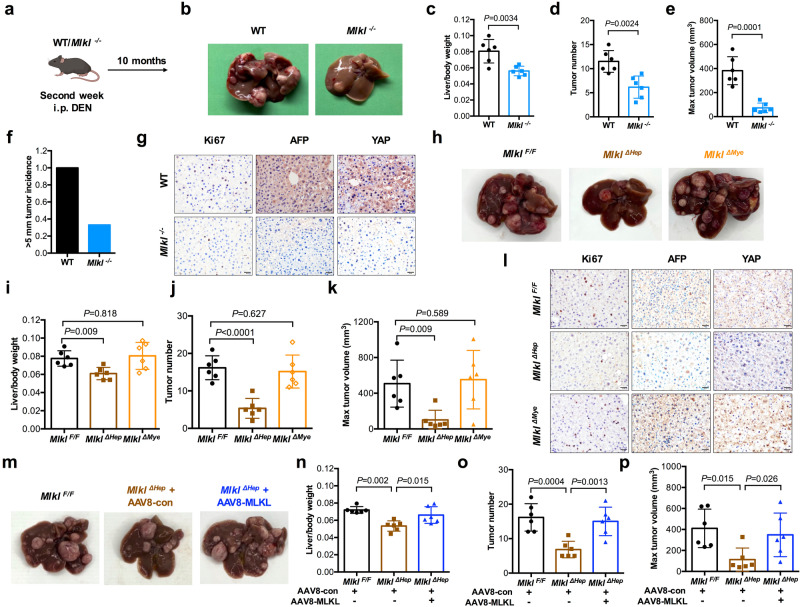
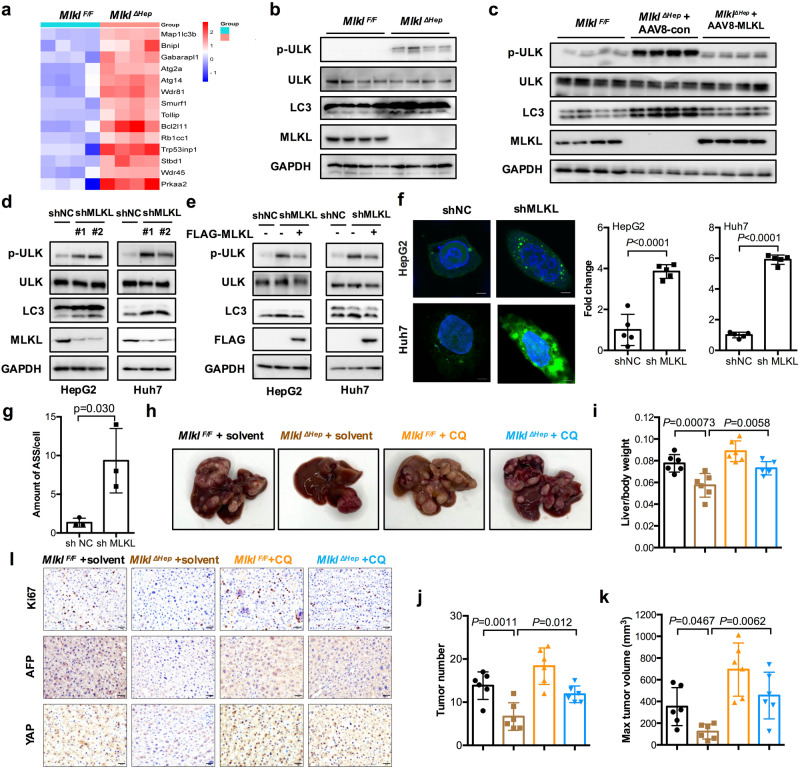
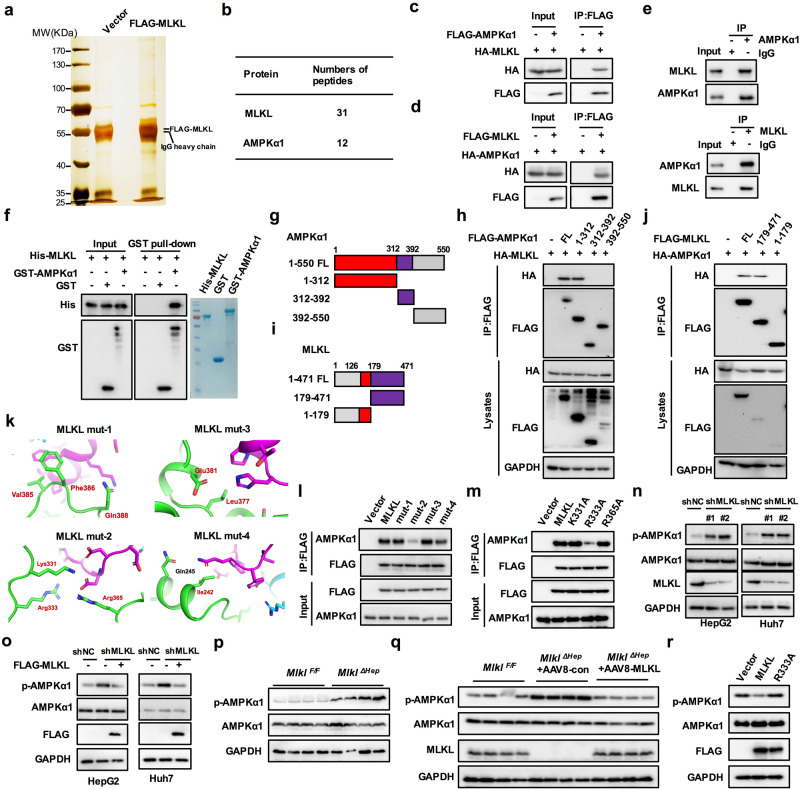
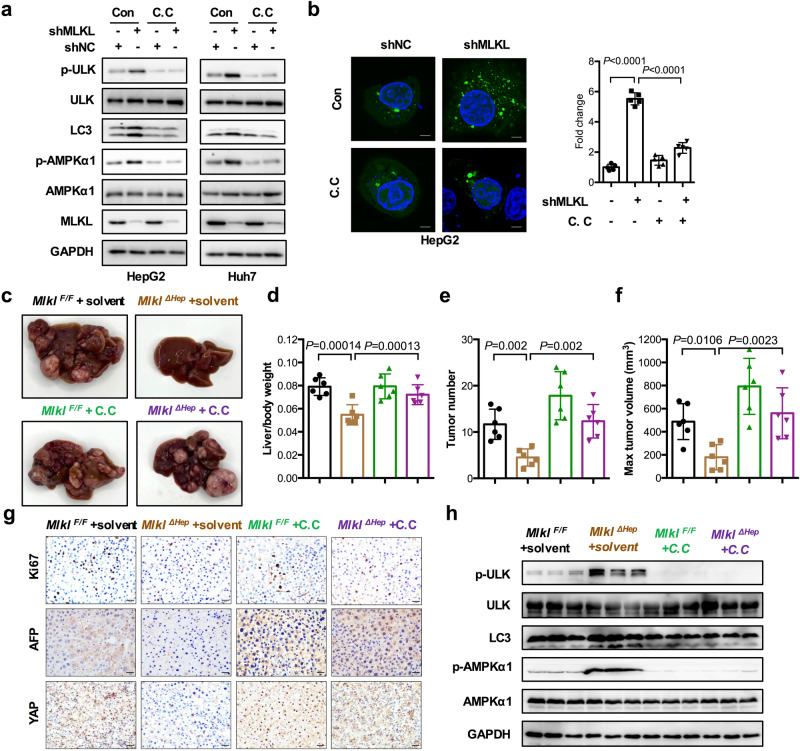
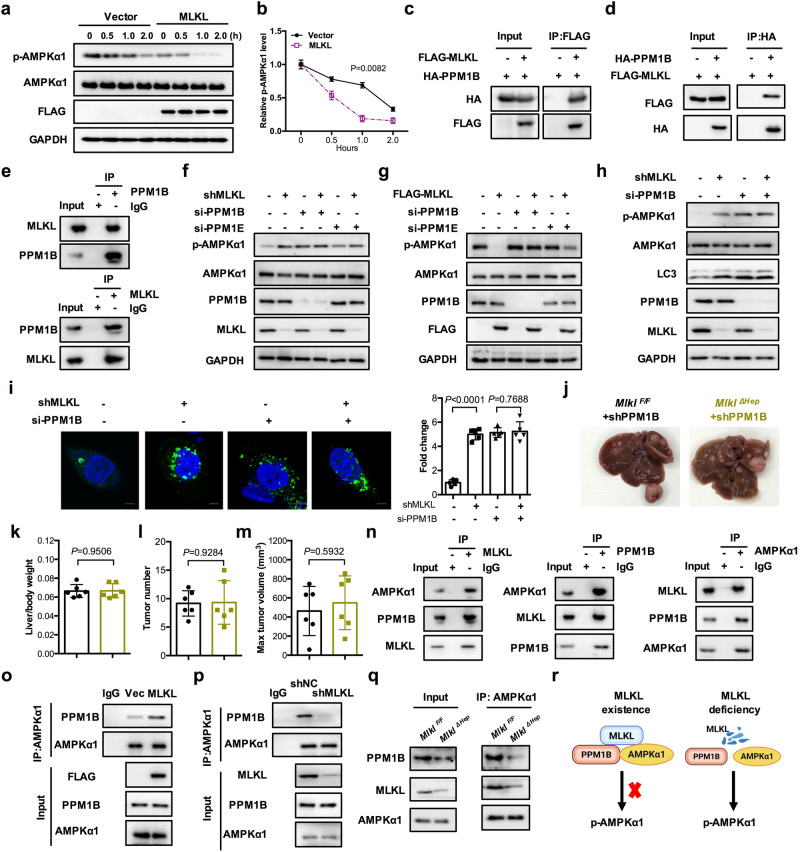
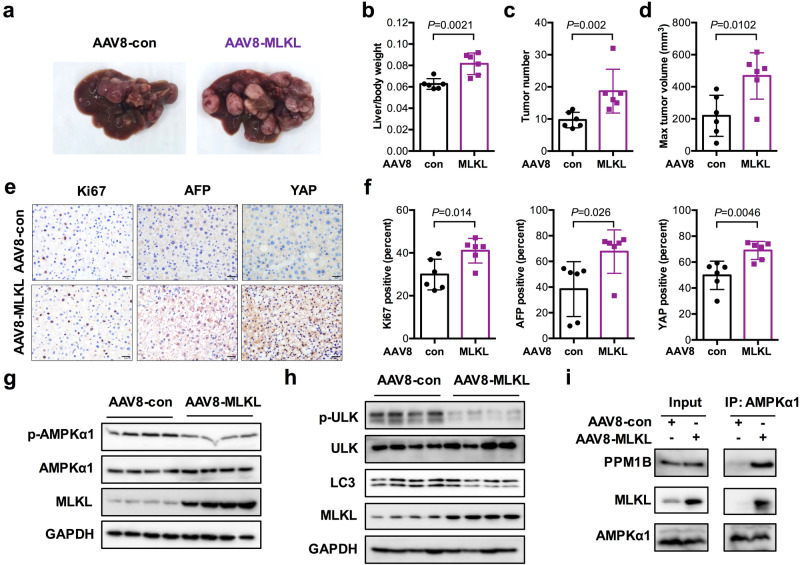
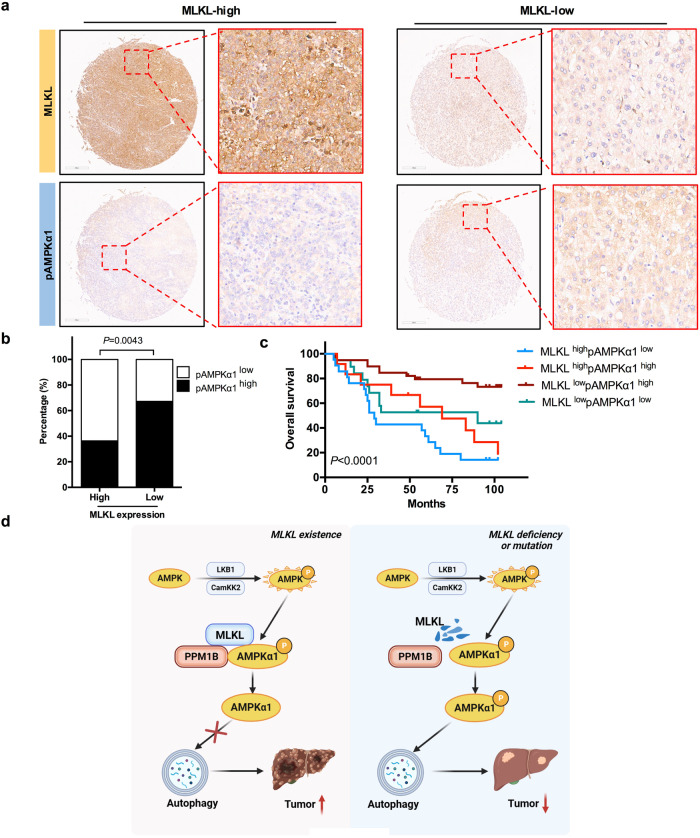
The pseudokinase mixed lineage kinase domain-like (MLKL) is an essential component of the activation of the necroptotic pathway. Emerging evidence suggests that MLKL plays a key role in liver disease. However, how MLKL contributes to hepatocarcinogenesis has not been fully elucidated. Herein, we report that MLKL is upregulated in a diethylnitrosamine (DEN)-induced murine HCC model and is associated with human hepatocellular carcinomas. Hepatocyte-specific MLKL knockout suppresses the progression of hepatocarcinogenesis. Conversely, MLKL overexpression aggravates the initiation and progression of DEN-induced HCC. Mechanistic study reveals that deletion of MLKL significantly increases the activation of autophagy, thereby protecting against hepatocarcinogenesis. MLKL directly interacts with AMPKα1 and inhibits its activity independent of its necroptotic function. Mechanistically, MLKL serves as a bridging molecule between AMPKα1 and protein phosphatase 1B (PPM1B), thus enhancing the dephosphorylation of AMPKα1. Consistently, MLKL expression correlates negatively with AMPKα1 phosphorylation in HCC patients. Taken together, our findings highlight MLKL as a novel AMPK gatekeeper that plays key roles in inhibiting autophagy and driving hepatocarcinogenesis, suggesting that the MLKL-AMPKα1 axis is a potential therapeutic target for HCC.


Conflict of interest statement

The authors declare no competing interests.

Figures

Fig. 1
Fig. 1. MLKL is overexpressed in DEN-induced murine HCC model and is associated with poor prognosis in HCC.
a Representative images of livers from the control and DEN groups. b Representative histopathology image of livers from the control and DEN groups (scale bars, 20 μm). c Schematic diagram of the 4-dimensional label-free quantitative proteomic analysis of mouse liver tissues (n = 3 per group). d Volcano plot (DEN vs. control) of differentially expressed proteins; upregulated (red) and downregulated (blue) proteins are labeled. e Representative images of liver sections from the control and DEN groups of mice stained for MLKL, AFP, and YAP (scale bars, 20 μm). f Western blotting analysis of MLKL and YAP expression in control and DEN-induced liver tissues (n = 3 per group). g Levels of MLKL proteins assessed in HCC tumor (n = 91) and adjacent tissues (n = 82). Statistical significance was determined by Mann-Whitney’s U test. h Expression of low and high MLKL was assessed in HCC tumors and adjacent tissues. Statistical significance was determined by chi-square test. i Kaplan–Meier analysis of overall survival in HCC patients with low or high MLKL expression. Statistical significance was determined by log-rank test. Data is showed as the mean ± SD.
Fig. 2
Fig. 2. MLKL in hepatocytes promotes hepatocarcinogenesis.
a Design and establishment of a DEN-induced HCC mouse model of global MLKL deficiency (Mlkl−/−). b Gross morphology of the livers of WT and Mlkl−/− mice 10 months after DEN treatment. ce Statistical analysis of the liver-to-body weight ratio (c), number of tumors (d) and maximum tumor volume (e) in the livers of the WT and Mlkl−/− mice at 10 months after DEN treatment (n = 6 per group). Statistical significance was determined by two-tailed unpaired Student’s t test. f Statistical analysis of the incidence of tumors >5 mm in length in WT and Mlkl−/− mice 10 months after DEN treatment (n = 6 per group). g Representative images of liver sections from WT and Mlkl−/− mice (n = 6 per group) stained for AFP, YAP, and Ki67 (scale bars, 20 μm). h Gross morphology of MlklF/F, MlklΔHep and MlklΔMye livers 10 months after DEN treatment. ik Statistical analysis of the liver-to-body weight ratio (i), number of tumors (j) and maximum tumor volume (k) in the MlklF/F, MlklΔHep and MlklΔMye livers at 10 months after DEN treatment (n = 6 per group). Statistical significance was determined by Mann–Whitney’s U test (i, k) and one-way ANOVA test (j). l Representative images of liver sections from MlklF/F, MlklΔHep and MlklΔMye mice (n = 6 per group) stained for AFP, YAP, and Ki67 at 10 months after DEN treatment (scale bars, 20 μm). m Gross morphology of the liver in MlklF/F + AAV8 control (black), MlklΔHep + AAV8 control (brown), and MlklΔHep + MLKL AAV8 (blue) mice after DEN treatment. n–p Statistical analysis of the liver-to-body weight ratio (n), number of tumors (o) and maximum tumor volume (p) in the indicated groups of mice (n = 6 per group) after DEN treatment. Statistical significance was determined by Mann–Whitney’s U test (n, p) and one-way ANOVA test (o). Data is showed as the mean ± SD.
Fig. 3
Fig. 3. MLKL regulates autophagy in hepatocytes to control hepatocarcinogenesis.
a Heatmap summarizing the differential gene expression of RNA-seq data related to the autophagy process (n = 4 per group). b Western blot analysis of LC-3, phosphorylated ULK1 (p-ULK1) and total ULK1 expression in the livers of MlklF/F and MlklΔHep mice with DEN-induced HCC (n = 4 per group). c Western blotting analysis of LC-3, p-ULK1, and ULK1 expression in liver tumors from MlklF/F + AAV8 control, MlklΔHep + AAV8 control, and MlklΔHep + MLKL AAV8 mice in DEN-induced HCC models (n = 4 per group). d Western blotting analysis of LC-3, p-ULK1, and ULK1 expression in MLKL-silenced and control HepG2 and Huh7 cells. e Western blotting analysis of LC-3, p-ULK1, and ULK1 expression in MLKL-KD HepG2 and Huh7 cells transfected with FLAG-MLKL. f GFP-LC3 fluorescence assay in MLKL-silenced and control HepG2 and Huh7 cells. Statistical significance was determined by two-tailed unpaired Student’s t test. g Autophagic vacuoles were measured in MLKL-silenced and control HepG2 cells by transmission electron microscopy. Statistical significance was determined by Mann–Whitney’s U test. h Gross morphology of the liver in MlklF/F + solvent mice (black), MlklΔHep+ solvent mice (brown), MlklF/F + CQ mice (orange), and MlklΔHep + CQ mice (blue) after DEN treatment. i-k Statistical analysis of the liver-to-body weight ratio (i), number of tumors (j) and maximum tumor volume (k) in the indicated groups of mice after DEN treatment (n = 6 per group). Statistical significance was determined by one-way ANOVA test (i, j, k). l Representative images of liver sections of AFP, YAP, and Ki67-stained MlklF/F + solvent mice, MlklΔHep+ solvent mice, MlklF/F + CQ mice, and MlklΔHep + CQ mice (scale bars, 20 μm) after DEN treatment (n = 6 per group). Data is showed as the mean ± SD.
Fig. 4
Fig. 4. MLKL directly interacts with AMPKα and negatively regulates its activity.
a MLKL-overexpressing cells were lysed and purified with anti-FLAG affinity beads. The FLAG-MLKL-associated proteins were analyzed by silver staining. b Mass spectrometry analysis of MLKL-associated proteins indicated that AMPKα1 is a candidate protein that interacts with MLKL. The peptide coverage of MLKL and AMPKα1 is shown. c Western blotting analysis of immunoprecipitates from HEK293T cells transfected with HA-MLKL or Flag-AMPKα1 plasmids. d Western blotting analysis of immunoprecipitates from HEK293T cells transfected with FLAG-MLKL or HA-AMPKα1 plasmids. e Western blotting analysis of lysates and immunoprecipitates from HepG2 cells. f GST, GST-AMPKα, and His-MLKL were produced from bacteria, and western blotting of GST was used to evaluate the interaction between His-tagged MLKL and GST-tagged AMPKα1. g Schematic diagram of fragments of AMPKα1. h Western blotting analysis of immunoprecipitates from HEK293T cells transfected with the indicated plasmids. i Schematic diagram of fragments of MLKL. j Western blot analysis of immunoprecipitates from HEK293T cells transfected with the indicated plasmids. k Graphical representation showing the predicted binding sites of the MLKL protein with AMPKα1, including residues Val385/Phe386/Gln388 (mut 1), Lys331/Arg333/Arg365 (mut 2), Leu377/Glu381 (mut 3), and Ile242/Gln245 (mut 4). l Western blot analysis of lysates and immunoprecipitates from HepG2 cells transfected with the indicated plasmids. m Western blotting analysis of immunoprecipitates from HEK293T cells transfected with the indicated plasmids. n Western blot analysis of T172-phosphorylated AMPKα1 (p-AMPKα1) and total AMPKα1 expression in MLKL-silenced and control HepG2 and Huh7 cells. o Western blotting analysis of p-AMPKα1 and AMPKα1 expression in MLKL-silenced HepG2 and Huh7 cells transfected with FLAG-MLKL. p Western blotting of p-AMPKα1 and AMPKα1 in the livers of MlklF/F and MlklΔHep model mice (n = 4 per group) with DEN-induced HCC. q Western blot analysis of p-AMPKα1 and AMPKα1 expression in liver tumors from DEN-induced HCC model mice treated with MlklF/F + AAV8 control, MlklΔHep + AAV8 control, or MlklΔHep + MLKL AAV8 (n = 4 per group). r Western blotting analysis of p-AMPKα1 and AMPKα1 expression in MLKL-KD HepG2 cells transfected with full-length MLKL or R333A MLKL.
Fig. 5
Fig. 5. MLKL negatively regulates autophagy and promotes hepatocarcinogenesis through AMPK.
a Western blotting analysis of p-AMPKα1, AMPKα1, p-ULK1, ULK1 and LC3 expression in MLKL-silenced and control HepG2 and Huh7 cells treated with and without Compound C (C.C.). b Confocal fluorescence assay of GFP-LC3 puncta in MLKL-silenced and control HepG2 cells with and without C.C. Statistical significance was determined by one-way ANOVA test. c Gross morphology of the liver in MlklF/F + solvent mice (black), MlklΔHep+ solvent mice (brown), and MlklF/F + C. C mice (green); MlklΔHep + C. C mice (purple) after DEN treatment. df Statistical analysis of the liver-to-body weight ratio (d), number of tumors (e) and maximum tumor volume (f) in the four groups of mice (n = 6 per group) after DEN treatment. Statistical significance was determined by one-way ANOVA test (d, f) and Mann–Whitney’s U test (e). g Representative images of liver sections showing AFP, YAP, and Ki67 staining in MlklF/F + solvent mice, MlklΔHep+ solvent mice, and MlklF/F + C. C mice and MlklΔHep + C. C mice (n = 6 per group) after DEN treatment. (scale bars, 20 μm). h Western blotting analysis of p-AMPKα1, AMPKα1, p-ULK1, ULK1 and LC3 expression in liver tumors from the indicated groups of mice (n = 6 per group) in the DEN-induced HCC model. Data is showed as the mean ± SD.
Fig. 6
Fig. 6. MLKL suppresses AMPKα1 activation by promoting PPM1B-dependent dephosphorylation.
a MLKL-overexpressing and control HepG2 cells were cultured in nonglucose medium to induce AMPKα1 activation for 6 h. Then, the cells were cultured in medium supplemented with glucose for different durations. Western blotting analysis of p-AMPKα1 was performed. b The level of p-AMPKα1 was quantitated after three independent experiments in Fig. 6a. Statistical significance was determined by two-way repeated-measures ANCOVA. c, d Western blotting analysis of immunoprecipitates from HEK293T cells transfected with the MLKL and PPM1B plasmids. e Western blotting analysis of lysates and immunoprecipitates from HepG2 cells. f Western blotting analysis of MLKL-silenced and control HepG2 cells transfected with PPM1B siRNA or PPM1E siRNA. g Western blotting analysis of MLKL-overexpressing and control HepG2 cells transfected with PPM1B siRNA or PPM1E siRNA. h Western blotting analysis of MLKL-silenced and control HepG2 cells transfected with PPM1B siRNA. i Confocal fluorescence assay of GFP-LC3 puncta from MLKL-silenced and control HepG2 cells transfected with PPM1B siRNA. Statistical significance was determined by one-way ANOVA test. j Gross morphology of the liver in MlklF/F + shPPM1B and MlklΔHep+ shPPM1B mice in the DEN-induced HCC mouse model at 10 months. km Statistical analysis of the liver-to-body weight ratio (k), number of tumors (l) and maximum tumor volume (m) in the MlklF/F + shPPM1B and MlklΔHep+ shPPM1B mice after DEN treatment (n = 6 per group). Statistical significance was determined by two-tailed unpaired Student’s t test. n Western blotting analysis of lysates and immunoprecipitates from HepG2 cells. op Western blot analysis of lysates and immunoprecipitates from MLKL-overexpressing (o) and MLKL-knockdown (p) HepG2 cells. q Western blot analysis of lysates and immunoprecipitates of MlklF/F and MlklΔHep tumors. r Working model showing that MLKL acts as a bridging factor between AMPKα1 and the phosphatase PPM1B to suppress AMPKα1 activity. Data is showed as the mean ± SD. ns indicates not significant.
Fig. 7
Fig. 7. MLKL overexpression increased DEN-induced hepatocarcinogenesis.
a Gross morphology of the liver in 8-month-old AAV8-con and AAV8-MLKL mice in the DEN-induced HCC mouse model. bd Statistical analysis of the liver-to-body weight ratio (b), number of tumors (c) and maximum tumor volume (d) in the AAV8-con and AAV8-MLKL mice (n = 6 per group). Statistical significance was determined by two-tailed unpaired Student’s t test. e Representative images of liver sections of AFP, YAP, and Ki67-stained tissues from AAV8-con and AAV8-MLKL mice (n = 6 per group) (scale bars, 20 μm). f Quantification of AFP, YAP and Ki67 staining in the AAV8-con and AAV8-MLKL mice at 8 months. Statistical significance was determined by two-tailed unpaired Student’s t test (Ki67, YAP) and Mann-Whitney’s U test (AFP). g Western blotting of p-AMPKα1 and AMPKα1 in liver tumors from 8-month-old AAV8-con and AAV8-MLKL mice in the DEN-induced HCC mouse model. h Western blotting of p-ULK1, ULK1 and LC3 in AAV8-con and AAV8-MLKL tumors. i Western blotting analysis of immunoprecipitates from AAV8-con and AAV8-MLKL tumors. Data is showed as the mean ± SD.
Fig. 8
Fig. 8. High MLKL expression is related to low pAMPKα1 expression in HCC.
a Representative images of HCC tumor tissues stained with MLKL or p-AMPKα1. b IHC staining analysis indicating the inverse correlation between MLKL and p-AMPKα1. Statistical significance was determined by chi-square test. c KM analysis of HCC specimens with MLKL or p-AMPKα1 expression. Statistical significance was determined by log-rank test. d A schematic model showing that MLKL depletion suppresses hepatocarcinogenesis by promoting AMPK activity. MLKL stabilizes the MLKL-AMPKα1-PPM1B complex and enhances PPM1B-mediated dephosphorylation of AMPKα1 to inhibit AMPK activity; loss of MLKL causes destabilization of the AMPKα1-PPM1B complex and increases AMPK activity, leading to activation of autophagy to inhibit hepatocarcinogenesis.

Similar articles

Cited by

References

    1. Siegel RL, Miller KD, Fuchs HE, Jemal A. Cancer statistics, 2022. CA Cancer J Clin. 2022;72:7–33. 10.3322/caac.21708 - DOI - PubMed
    1. Pinyol R, Torrecilla S, Wang H, Montironi C, Piqué-Gili M, Torres-Martin M, et al. Molecular characterisation of hepatocellular carcinoma in patients with non-alcoholic steatohepatitis. J Hepatol. 2021;75:865–78. 10.1016/j.jhep.2021.04.049 - DOI - PMC - PubMed
    1. Qian H, Chao X, Williams J, Fulte S, Li T, Yang L, et al. Autophagy in liver diseases: a review. Mol Aspects Med. 2021;82:100973. 10.1016/j.mam.2021.100973 - DOI - PMC - PubMed
    1. Alim Al-Bari A, Ito Y, Thomes PG, Menon MB, García-Macia M, Fadel R, et al. Emerging mechanistic insights of selective autophagy in hepatic diseases. Front Pharmacol. 2023;14:1149809. 10.3389/fphar.2023.1149809 - DOI - PMC - PubMed
    1. Yao J, Tang S, Shi C, Lin Y, Ge L, Chen Q, et al. Isoginkgetin, a potential CDK6 inhibitor, suppresses enhancer activity to induce AMPK-ULK1-mediated cytotoxic autophagy in hepatocellular carcinoma. Autophagy. 2023;19:1221–38. 10.1080/15548627.2022.2119353 - DOI - PMC - PubMed

MeSH terms

LinkOut - more resources