. 2024 Jul;31(7):897-909.
doi: 10.1038/s41418-024-01313-6. Epub 2024 May 23.

The importance of murine phospho-MLKL-S345 in situ detection for necroptosis assessment in vivo

Affiliations

The importance of murine phospho-MLKL-S345 in situ detection for necroptosis assessment in vivo

Konstantinos Kelepouras et al. Cell Death Differ. 2024 Jul.

Abstract

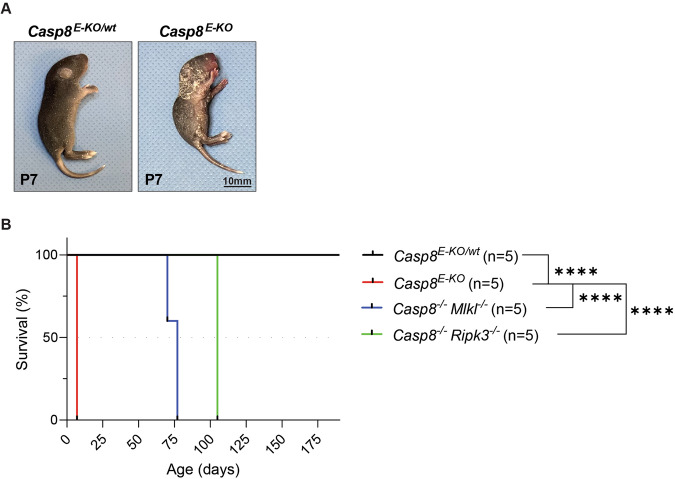
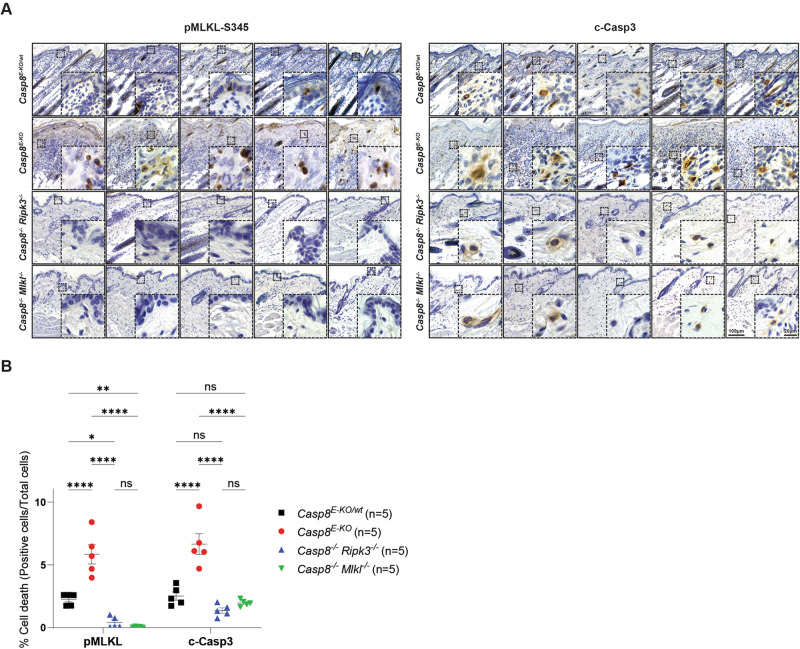
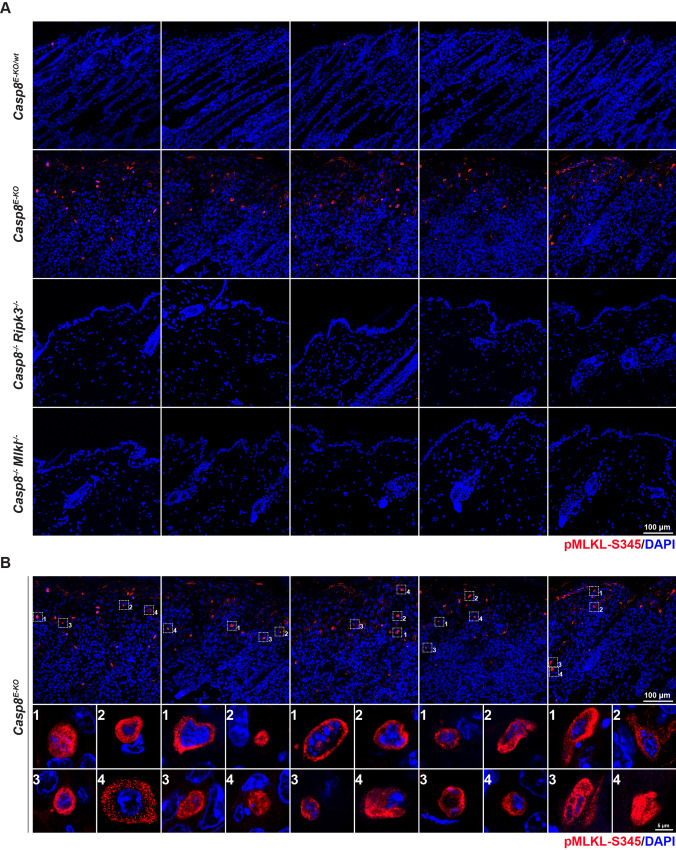
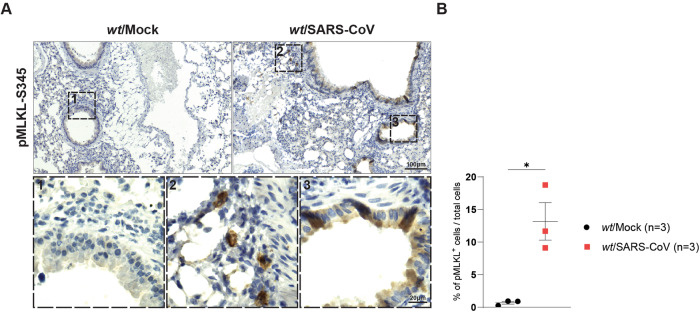
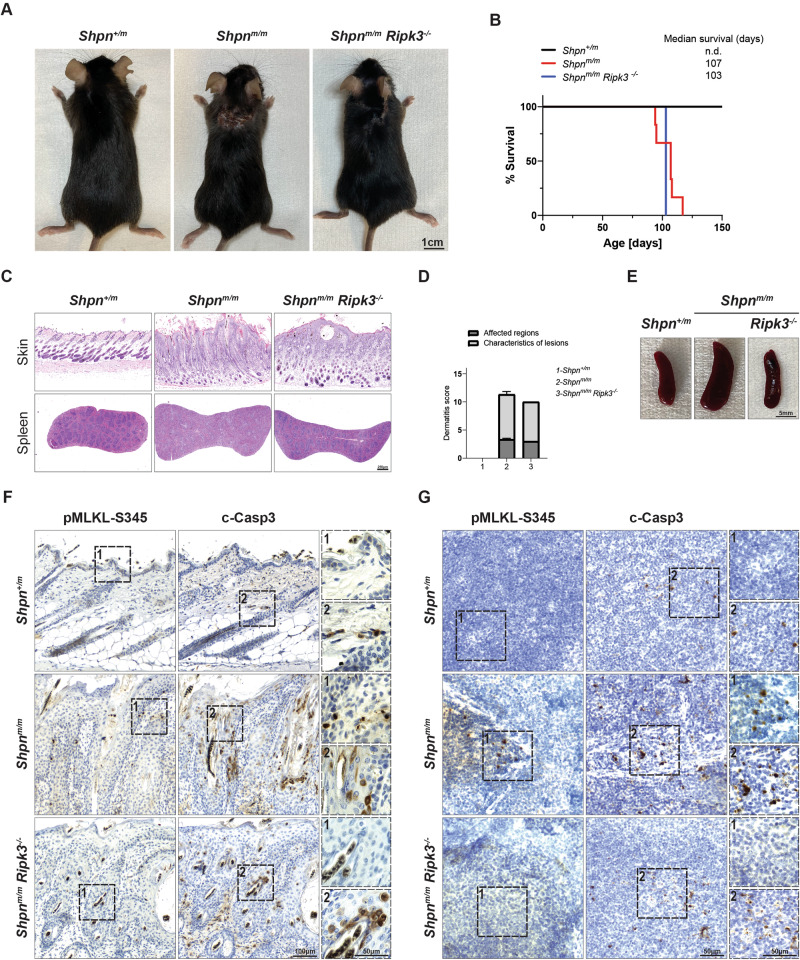
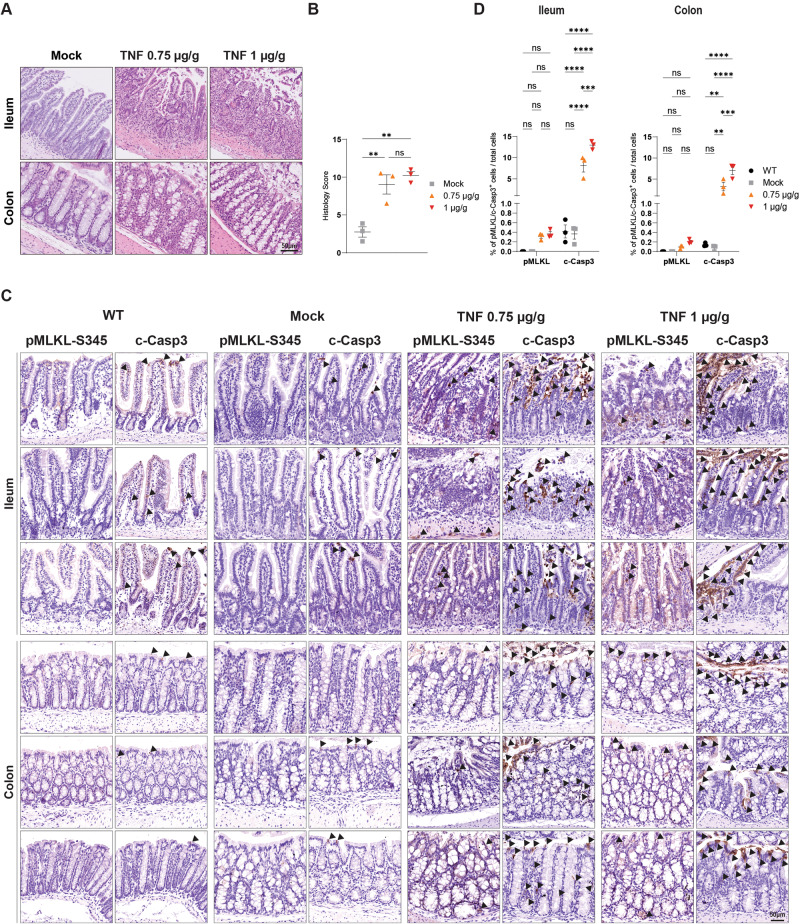
Necroptosis is a caspase-independent modality of cell death implicated in many inflammatory pathologies. The execution of this pathway requires the formation of a cytosolic platform that comprises RIPK1 and RIPK3 which, in turn, mediates the phosphorylation of the pseudokinase MLKL (S345 in mouse). The activation of this executioner is followed by its oligomerisation and accumulation at the plasma-membrane where it leads to cell death via plasma-membrane destabilisation and consequent permeabilisation. While the biochemical and cellular characterisation of these events have been amply investigated, the study of necroptosis involvement in vivo in animal models is currently limited to the use of Mlkl-/- or Ripk3-/- mice. Yet, even in many of the models in which the involvement of necroptosis in disease aetiology has been genetically demonstrated, the fundamental in vivo characterisation regarding the question as to which tissue(s) and specific cell type(s) therein is/are affected by the pathogenic necroptotic death are missing. Here, we describe and validate an immunohistochemistry and immunofluorescence-based method to reliably detect the phosphorylation of mouse MLKL at serine 345 (pMLKL-S345). We first validate the method using tissues derived from mice in which Caspase-8 (Casp8) or FADD are specifically deleted from keratinocytes, or intestinal epithelial cells, respectively. We next demonstrate the presence of necroptotic activation in the lungs of SARS-CoV-infected mice and in the skin and spleen of mice bearing a Sharpin inactivating mutation. Finally, we exclude necroptosis occurrence in the intestines of mice subjected to TNF-induced septic shock. Importantly, by directly comparing the staining of pMLKL-345 with that of cleaved Caspase-3 staining in some of these models, we identify spatio-temporal and functional differences between necroptosis and apoptosis supporting a role of RIPK3 in inflammation independently of MLKL versus the role of RIPK3 in activation of necroptosis.


Conflict of interest statement

The authors declare no competing interests.

Figures

Fig. 1
Fig. 1. Casp8E-KO is a reliable and robust model to study necroptosis.
A Representative images of Casp8E-KO mice at the indicated time point (P7). Control mice included littermates with the Casp8E-KO/wt genotype. B Kaplan–Meier survival graph of mice of the indicated genotypes (n = 5 in each group). P values were calculated by Gehan–Breslow–Wilcoxon test. ****P ≤ 0.0001.
Fig. 2
Fig. 2. Reliable detection of pMLKL-S345 in situ distinguishes necroptosis from apoptosis.
A Representative bright field images of skin sections from mice with the indicated genotypes immunostained with pMLKL-S345 and c-Casp3. Consecutive skin sections from the same mice were utilised for each marker and are shown in the same order (n = 5 in each group). Scale bars: 100 µm (representative field) and 20 µm (magnified selected area). B Graph showing quantification of each immunostaining obtained via QuPath after slides were digitalised in a digital slide scanner as described in the Supplementary Methods section. For each marker, total skin section was analysed and total numbers of cells were obtained to calculate the percentage of positive cells over the total amount of cells detected. Data are presented as mean + SEM and each dot represents one mouse. P values were calculated via two-way Anova. *P ≤ 0.05, **P ≤ 0.01, ****P ≤ 0.0001, ns not significant.
Fig. 3
Fig. 3. In situ detection of pMLKL-S345 is applicable to immunofluorescence staining.
A, B Representative images of skin sections from mice with the indicated genotypes immunostained with Alexa fluor 594 streptavidin (red) to detect pMLKL-S345 and with DAPI (blue) to detect nuclei (n = 5 in each group). Dashed squares indicate 4 representative pMLKL-S345-positive cells per image. Scale bars: 100 µm. B Representative images (single slice 0.4 μm) of pMLKL-S345 positive cells (n = 4 cells per mouse in a total of n = 5 mice). Scale bar: 5 µm.
Fig. 4
Fig. 4. SARS-CoV infection induces apoptotic and necroptotic cell death.
A Representative bright field images of lung sections of wt mice infected intranasally with 106 TCID50/ml SARS-CoV MA15 virus at 3 days post-infection (dpi) immunostained with pMLKL-S345 (n = 3 for mock-infected and MA15-infected mice). Scale bars: 100 µm (representative field) and 50 µm (magnified selected area). B Graph showing quantification of pMLKL-S345 immunostaining obtained via QuPath after slides were digitalised in a digital slide scanner as described in the Supplementary Methods section. Total lung sections were analysed and total numbers of cells were obtained to calculate the percentage of positive cells over the total amount of cells detected. Data are presented as mean + SEM and each dot represents one mouse. P values were calculated via one-way Anova, Tukey’s multiple comparisons test. *P ≤ 0.05.
Fig. 5
Fig. 5. pMLKL-S345 staining distinguishes between RIPK3-mediated necroptosis and RIPK3-mediated inflammation.
A Representative images of mice of indicated genotypes at the endpoint (14–15 weeks). Control mice included littermates with the Shpn+/m genotype. B Kaplan–Meier survival graph of mice with the indicated genotypes (n = 7 for Shpn+/m, 6 for Shpnm/m, 1 for Shpnm/m; Ripk3−/− mice). C Representative images of skin and spleen sections from mice with the indicated genotypes stained with H&E. Slides were digitalised in a digital slide scanner and images were acquired in QuPath. D Graph of severity score of dermatitis assessment in 14–15 weeks old mice of the indicated genotypes. Shpn+/m mice (14–21 weeks old) served as controls (n = 5 for Shpn+/m, 6 for Shpnm/m, 1 for Shpnm/m; Ripk3/ mice). E Representative bright field images of spleens from mice of the indicated genotypes. F, G Representative bright field images of skin (F) and spleen (G) sections from mice with the indicated genotypes immunostained with pMLKL-S345 and c-Casp3. Consecutive skin sections from the same mice were utilised for each marker and displayed according to their order (n = 3 for Shpn+/m, 3 for Shpnm/m and 1 for Shpnm/m; Ripk3−/− mice). Scale bars: skin (F) 100 µm (representative field) and 50 µm (magnified selected area), spleen (G) 50 µm for both representative field and magnified selected area.
Fig. 6
Fig. 6. Systemic inflammatory response syndrome drives apoptosis and not necroptosis in intestinal epithelial cells.
Co-housed 10–12 week old female C57Bl6/N wt mice were injected with 0.75 µg/g or 1 µg/g of ice-cold recombinant, LPS-free mouse TNF intravenously. Control mice received a corresponding volume of ice-cold LPS-free PBS. Mice were sacrificed 6 h post-injection. Untreated wt mice were additionally analysed (n = 3 in each group). A Representative images of small intestine and colon sections (Swiss-rolls) of wt mice as indicated were stained with H&E. Slides were digitalised in a digital slide scanner and pictures were acquired in QuPath. Scale bars: 50 µm. B Graph showing histology score in whole intestine. Data are presented as mean + SEM and each dot represents one mouse. P values were calculated via one-way Anova, Tukey’s multiple comparisons test. **P ≤ 0.01, ns not significant. C Representative images of ileum and colon sections (Swiss-rolls) of wt mice as indicated immunostained with pMLKL-S345 and c-Casp3. Slides were digitalised in a digital slide scanner and pictures were acquired in QuPath. Scale bars: 50 µm. Arrowheads indicate pMLKL-S345-positive cells and c-Casp3-positive areas. D Graph showing quantification of illustrated pictures for each immunostaining obtained via QuPath after slides were digitalised in a digital slide scanner as described in the Supplementary Methods section. Total numbers of cells were obtained to calculate the percentage of positive cells over the total amount of cells detected. Data are presented as mean + SEM and each dot represents one mouse. P values were calculated via two-way Anova, Tukey’s multiple comparisons test. **P ≤ 0.01, ***P ≤ 0.001, ****P ≤ 0.0001, ns not significant.

References

    1. Liccardi G, Annibaldi A. MLKL post-translational modifications: road signs to infection, inflammation and unknown destinations. Cell Death Differ. 2023;30:269–78. doi: 10.1038/s41418-022-01061-5. - DOI - PMC - PubMed
    1. Vanden Berghe T, Linkermann A, Jouan-Lanhouet S, Walczak H, Vandenabeele P. Regulated necrosis: the expanding network of non-apoptotic cell death pathways. Nat Rev Mol Cell Biol. 2014;15:135–47. doi: 10.1038/nrm3737. - DOI - PubMed
    1. Zhang DW, Shao J, Lin J, Zhang N, Lu BJ, Lin SC, et al. RIP3, an energy metabolism regulator that switches TNF-Induced cell death from apoptosis to necrosis. Science. 2009;325:332–6. doi: 10.1126/science.1172308. - DOI - PubMed
    1. He SD, Wang L, Miao L, Wang T, Du FH, Zhao LP, et al. Receptor interacting protein kinase-3 determines cellular necrotic response to TNF-alpha. Cell. 2009;137:1100–11. doi: 10.1016/j.cell.2009.05.021. - DOI - PubMed
    1. Walczak H. Death receptor-ligand systems in cancer, cell death, and inflammation. Cold Spring Harb Perspect Biol. 2013;5:a008698. doi: 10.1101/cshperspect.a008698. - DOI - PMC - PubMed

LinkOut - more resources