. 2024 Jul 8;52(12):6945-6963.
doi: 10.1093/nar/gkae426.

The p21CIP1-CDK4-DREAM axis is a master regulator of genotoxic stress-induced cellular senescence

Affiliations

The p21CIP1-CDK4-DREAM axis is a master regulator of genotoxic stress-induced cellular senescence

Ariane Schmidt et al. Nucleic Acids Res. .

Abstract

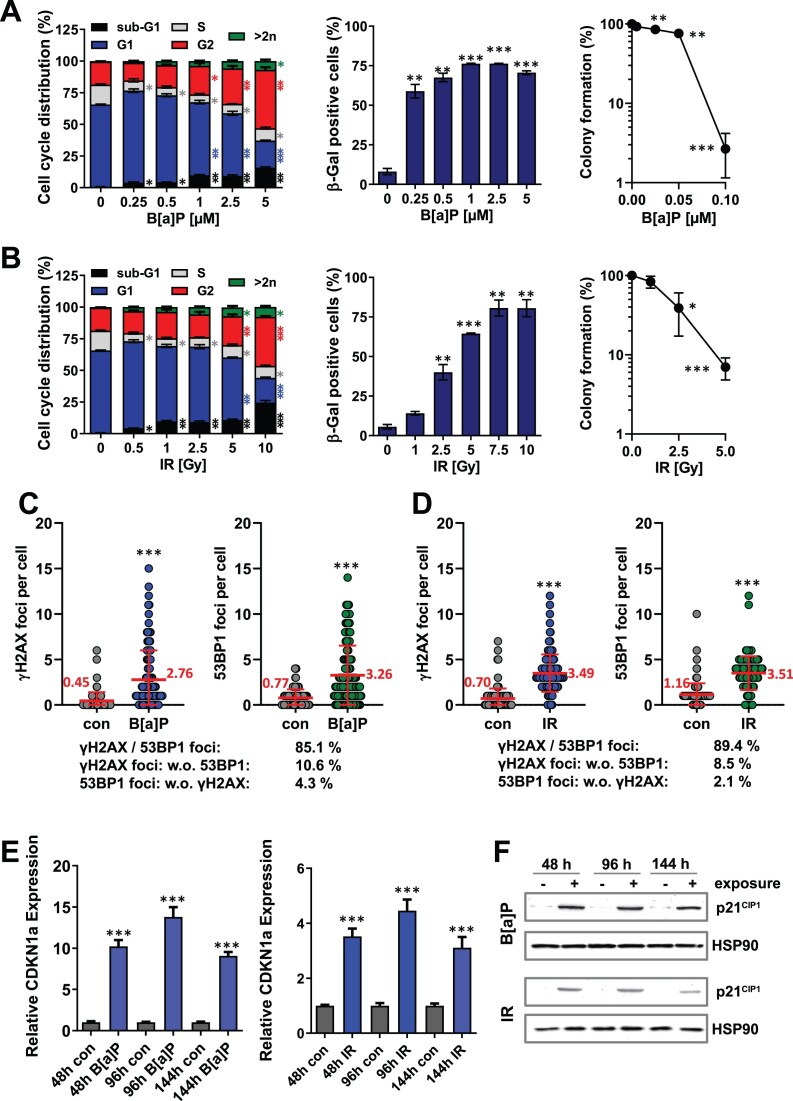
Cellular senescence, a major driver of aging, can be stimulated by DNA damage, and is counteracted by the DNA repair machinery. Here we show that in p16INK4a-deficient cells, senescence induction by the environmental genotoxin B[a]P or ionizing radiation (IR) completely depends on p21CIP1. Immunoprecipitation-based mass spectrometry interactomics data revealed that during senescence induction and maintenance, p21CIP1 specifically inhibits CDK4 and thereby activates the DREAM complex. Genome-wide transcriptomics revealed striking similarities in the response induced by B[a]P and IR. Among the top 100 repressed genes 78 were identical between B[a]P and IR and 76 were DREAM targets. The DREAM complex transcriptionally silences the main proliferation-associated transcription factors E2F1, FOXM1 and B-Myb as well as multiple DNA repair factors. Knockdown of p21CIP1, E2F4 or E2F5 diminished both, repression of these factors and senescence. The transcriptional profiles evoked by B[a]P and IR largely overlapped with the profile induced by pharmacological CDK4 inhibition, further illustrating the role of CDK4 inhibition in genotoxic stress-induced senescence. Moreover, data obtained by live-cell time-lapse microscopy suggest the inhibition of CDK4 by p21CIP1 is especially important for arresting cells which slip through mitosis. Overall, we identified the p21CIP1/CDK4/DREAM axis as a master regulator of genotoxic stress-induced senescence.


Figures

Graphical Abstract
Graphical Abstract
Figure 1.
Figure 1.
(A, B) MCF7 cells were exposed to different concentrations of B[a]P (A) or different doses of IR (B) for 120 h (left and middle panel) or for 2 weeks (right panel). Experiments were performed in triplicates. Cell death and cell cycle distribution were measured by flow cytometry using PI staining (left graph). Frequency of senescent cells was detected microscopically by SA-β-Gal staining (middle panel). Proliferation and clonogenic survival were measured by colony formation assay (right panel). (C, D) MCF7 cells were exposed to 1 μM B[a]P (C) or 5 Gy IR (D) for 120 h. Formation of γH2AX and 53BP1 foci was measured by confocal laser scanning microscopy (LSM). Foci were counted in 200 cells. Numbers of foci/cell and co-localization events are shown. (E, F) Expression of CDNK1a upon B[a]P or IR exposure was measured by qPCR (E) or immunoblotting (F). For qPCR, ACTB and GAPDH, and for immunodetection, HSP90 were used as internal loading control. Experiments were performed in triplicates. (A–E) Differences between treatment and control were statistically analysed using Student's t test (non labelled = non significant, *P< 0.1 **P< 0.01, ***P< 0.001).
Figure 2.
Figure 2.
(A, B) p21CIP1 was silenced using siRNA and MCF7 cells were exposed to B[a]P or IR. Frequency of senescent cells was detected microscopically by β-Gal staining. Experiments were performed in triplicates. Differences between treatment and control, as well as between treatment and treatment + siRNA were statistically analysed using Student's t test (non labelled = non significant, *P< 0.1 **P< 0.01, ***P< 0.001). (C, D) MCF7 cells were exposed to 1 μM B[a]P (C) or 5 Gy IR (D) and binding of p21CIP1 to CDK1, CDK2 and CDK4 was identified by Co-IP. (E, F) MCF7 cells were exposed to 1 μM B[a]P (E) or 5 Gy IR (F) and the expression of p21CIP1, CDK1, CDK2 and CDK4 was immunodetected. HSP90 was used as internal loading control, quantification of band intensities from two blots is shown. (G) MCF7 cells were exposed to 1 μM B[a]P and p21CIP1 binding partners were identified using interactomics. Interaction with cell cycle associated factors is shown in the left panel (Expression (log2_Ratio) above input control is shown).
Figure 3.
Figure 3.
MCF7 cells were exposed to 1 μM B[a]P (A, C) or 5 Gy IR (B, D). Expression of E2F1, E2F4, E2F5, CCNA1, CCNA2, CCNB1, CCNB2, CCND1 and CCND2 was analysed by qPCR (A, B). ACTB and GAPDH were used as internal loading control, differences between treatment and control were statistically analysed using Student's t test (non labelled = non significant, *P< 0.1 **P< 0.01, ***P< 0.001). Expression of E2F4, pRB, RB, pp130 and p130 was analysed by immunodetection (C, D). β-Actin or HSP90 were used as internal loading control, quantification of band intensities from two blots is shown.
Figure 4.
Figure 4.
MCF7 cells were exposed to 1 μM B[a]P or 5 Gy IR for 120 h. RNA was isolated and subjected to RNA-Seq. (A) Amount of genes commonly up-regulated (upper panel) or down-regulated (lower panel) upon B[a]P and IR exposure are displayed as Venn diagrams. (B) Significantly regulated pathways were identified by the Reactome pathway browser (https://reactome.org/PathwayBrowser/). (A, B) For B[a]P up and down-regulated genes with BH adjusted P-values <0.001 and log2 fold change > 2 are included, for IR up-regulated genes with BH adjusted P-values <0.001 and log2 fold change >2 are included, for IR down-regulated genes with BH adjusted P-values <0.001 and log2 fold change >1.5 are included. (C) Amount of genes commonly up- or down-regulated upon B[a]P and IR exposure are displayed as Venn diagrams. (D) Amount of genes commonly up- or down-regulated upon B[a]P and IR exposure and overlap with DREAM or p53 targets are displayed as Venn diagrams. (E) List of p53 targets up-regulated by B[a]P and IR, as well as DREAM targets down-regulated by B[a]P and IR. (F) Amount of genes commonly down-regulated upon B[a]P and IR exposure and overlap with FOXM1, MYBL2 and E2F1-RB targets are displayed as Venn diagrams. (C–F) Top 100 most significantly induced or repressed genes were included.
Figure 5.
Figure 5.
(A) Expression of E2F4 and E2F5 was detected 48 and 72 h after siRNA-mediated knockdown by immunodetection; β-Actin was used as internal loading control; quantification of band intensities indicates knock-down efficiency. (B, C) MCF7 cells were treated with E2F4-, E2F5- or non-specific siRNA for 24 h and thereafter exposed to B[a]P or IR for 120 h. (B) Senescence was measured microscopically by β-Gal staining. (C) Expression of CDK1, FOXM1, MYBL2, HMGB2, CCNB1, LMNB1, PLK1, CENPF, TK1 and ASPM was measured by qPCR; ACTB and GAPDH were used as internal loading control. (B, C) Experiments were performed in triplicates, differences between treatment in absence or presence of siRNA were statistically analysed using Student's t test (non labelled = non significant, *P< 0.1 **P< 0.01, ***P< 0.001).
Figure 6.
Figure 6.
(A, B) MCF7 cells were treated with different concentrations of the CDK4/6 inhibitor Palbociclib for 120 h. (A) Cell death and cell cycle distribution were measured by flow cytometry using PI staining (left graph). Proliferation and clonogenic survival were measured by colony formation assay (middle panel). Frequency of senescent cells was detected microscopically by SA-β-Gal staining (right panel). (B) Expression of CDK1, FOXM1, MYBL2, HMGB2, CCNB1, LMNB1, PLK1, CENPF, TK1 and ASPM were measured by qPCR; ACTB and GAPDH were used as internal loading control. (A, B) Experiments were performed in triplicates, differences between treatment and control were statistically analysed using Student's t test (non labelled = non significant, *P< 0.1 **P< 0.01, ***P< 0.001). (C–F) MCF7 cells were exposed to 1 μM Palbociclib. RNA was isolated and subjected to RNA-Seq. (C) Amounts of genes commonly up- or down-regulated upon B[a]P, IR and Palbociclib exposure are displayed as Venn diagrams. (D) Pathways regulated by Palbociclib were identified by the Reactome pathway browser (https://reactome.org/PathwayBrowser/). (E) Amount of genes commonly down-regulated upon B[a]P, IR and Palbociclib and overlap with DREAM targets are displayed as Venn diagrams. (F) Amount of G1/S (left panel) and G2/M (right panel) specific genes commonly down-regulated upon B[a]P, IR and Palbociclib are displayed as Venn diagrams. (C–F) For B[a]P and Palbociclib, genes with BH adjusted P-values <0.001 and log2 fold change >2 are included, for IR down-regulated genes with BH adjusted P-values <0.001 and log2 fold change >1.5 are included. (E, F) Only the 200 most significantly down-regulated genes were included.
Figure 7.
Figure 7.
(A) Scheme of the fluorescent cell cycle indicator (FUCCI) system. (B) MCF7-FUCCI cells were imaged unperturbed for 72 h. As an example, normalized trajectories of mClover-GMNN (green) and mKO2-CDT1 (red) levels are shown for a selected cell. The size of the nuclear area is shown in the lower graph (black). Cell divisions are identified by sudden drops in nuclear area and indicated as vertical dashed lines in the upper graph. (C) Cumulative cell divisions of MCF7-FUCCI cells treated with 1 μM B[a]P, 5 Gy IR or left untreated (control) for a period of 72 h. (D, E) MCF7-FUCCI cells were treated with 1 μM B[a]P and imaged for 72 h. Cells were categorized into cells that divided (64% of all cells, (D) and those that did not divide (36% of all cells, (E). For each category, further cell cycle progressions were determined and their frequencies indicated as bar graphs. Cells showing both elevated GMNN and CDT1 levels were classified as undefined. Error bars indicate standard error of the proportion. Normalized trajectories of mClover-GMNN (green) and mKO2-CDT1 (red) levels are shown for selected cells representing the most common type of cell cycle progression for each subgroup. (F, G) MCF7-FUCCI cells were treated with 5 Gy IR and imaged for 72 h. Cells were categorized into cells that divided (78% of all cells, (F) and those that did not divide (22% of all cells, (G). Further cell cycle progression and exemplary trajectories are shown as above. (H) Model summarizing the role of p21CIP1/DREAM in DNA damage-induced senescence.

References

    1. Hayflick L. The limited in vitro lifetime of Human diploid cell strains. Exp. Cell. Res. 1965; 37:614–636. - PubMed
    1. d’Adda di Fagagna F. Living on a break: cellular senescence as a DNA-damage response. Nat. Rev. Cancer. 2008; 8:512–522. - PubMed
    1. Muller M. Cellular senescence: molecular mechanisms, in vivo significance, and redox considerations. Antioxid. Redox Signal. 2009; 11:59–98. - PubMed
    1. Fridman A.L., Tainsky M.A.. Critical pathways in cellular senescence and immortalization revealed by gene expression profiling. Oncogene. 2008; 27:5975–5987. - PMC - PubMed
    1. Cichowski K., Hahn W.C.. Unexpected pieces to the senescence puzzle. Cell. 2008; 133:958–961. - PMC - PubMed

MeSH terms