. 2024 Jul;25(7):2914-2949.
doi: 10.1038/s44319-024-00150-5. Epub 2024 May 23.

naRNA-LL37 composite DAMPs define sterile NETs as self-propagating drivers of inflammation

Affiliations

naRNA-LL37 composite DAMPs define sterile NETs as self-propagating drivers of inflammation

Francesca Bork et al. EMBO Rep. 2024 Jul.

Abstract

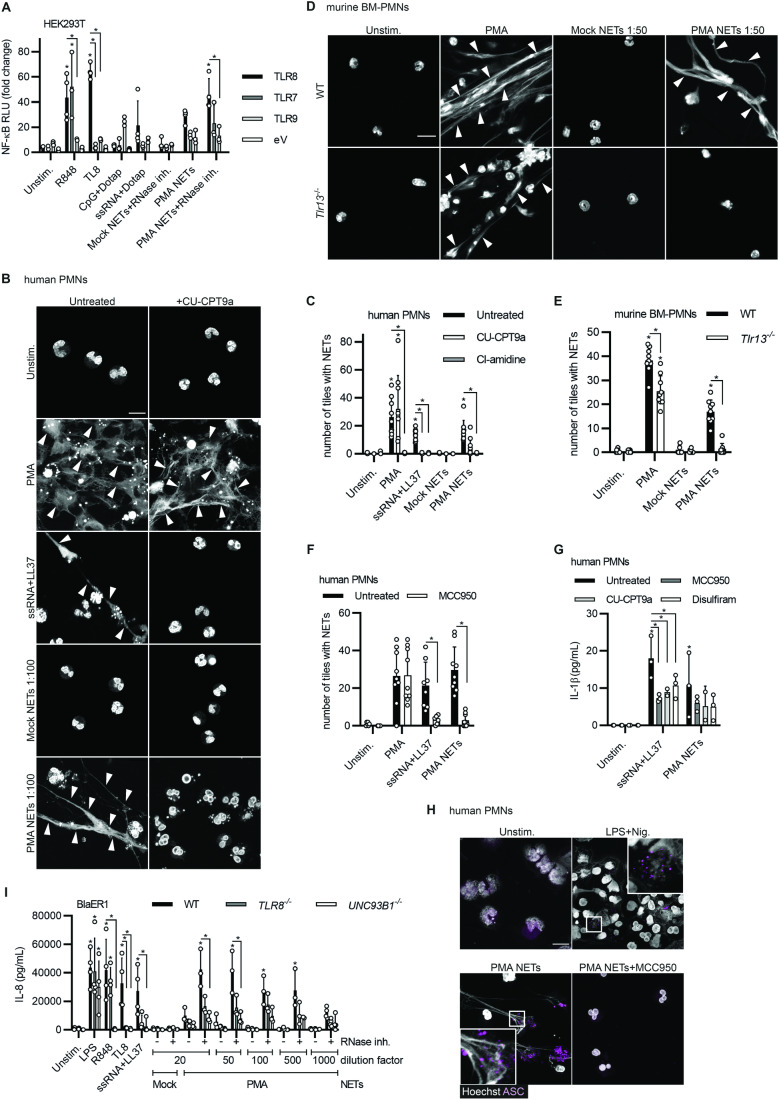
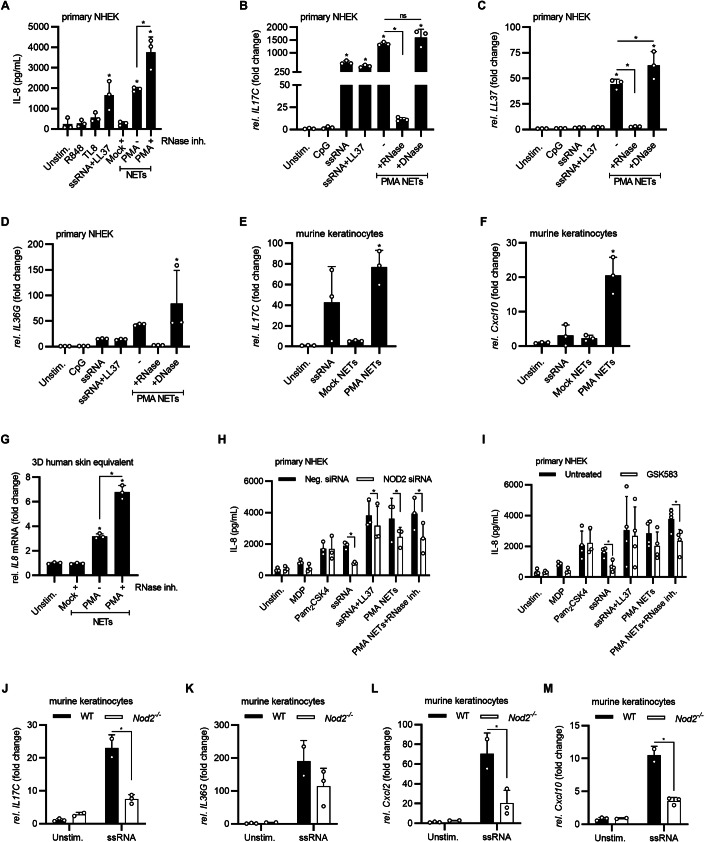
Neutrophil extracellular traps (NETs) are a key antimicrobial feature of cellular innate immunity mediated by polymorphonuclear neutrophils (PMNs). NETs counteract microbes but are also linked to inflammation in atherosclerosis, arthritis, or psoriasis by unknown mechanisms. Here, we report that NET-associated RNA (naRNA) stimulates further NET formation in naive PMNs via a unique TLR8-NLRP3 inflammasome-dependent pathway. Keratinocytes respond to naRNA with expression of psoriasis-related genes (e.g., IL17, IL36) via atypical NOD2-RIPK signaling. In vivo, naRNA drives temporary skin inflammation, which is drastically ameliorated by genetic ablation of RNA sensing. Unexpectedly, the naRNA-LL37 'composite damage-associated molecular pattern (DAMP)' is pre-stored in resting neutrophil granules, defining sterile NETs as inflammatory webs that amplify neutrophil activation. However, the activity of the naRNA-LL37 DAMP is transient and hence supposedly self-limiting under physiological conditions. Collectively, upon dysregulated NET release like in psoriasis, naRNA sensing may represent both a potential cause of disease and a new intervention target.

Keywords: DAMP; NLRP3 Inflammasome; Neutrophil Extracellular Trap; RNA; Toll-like Receptors.


Conflict of interest statement

NKA has received previous grant support from Pfizer and Boehringer Ingelheim and was a paid consultant for Janssen Pharmaceuticals. MWL is an inventor of patents owned by Immatics Biotechnologies and has acted as a speaker and paid consultant for Boehringer Ingelheim. All other authors declare no competing interests.

Figures

Figure 1
Figure 1. naRNA is a canonical component of NETs.
(A, B) Confocal microscopy of primary human PMNs stimulated as indicated for 3 h and stained for naRNA (anti-rRNA Y10b, magenta) and DNA (Hoechst 33342, white, n = 3 biological replicates, scale bar: 10 μm, arrowheads point to selected NET strands; representative images in (A) were quantified in (B) (each dot represents the number of NET-positive tiles in one image quantified from three images/condition). (C) Scanning electron microscopy of human primary PMNs treated as indicated and using anti-rRNA primary and immunogold (white arrow)-labeled secondary antibodies and silver enhancement (n = 3 biological replicates, representative images, scale bars as indicated; the two rightmost images show composite images with signals from secondary electron and backscattered electron detectors for topography and additional material information, respectively). (D) RNAseq of PMA NET naRNA (n = 4 biological replicates) and whole PMN RNA (n = 1 biological replicate, combined data). (E) Quantification of confocal microscopy of primary human PMNs, which were stimulated with NET content (harvested with/without RNase inhibitor and diluted 1:50 or 1:500), and then stained for NETs/DNA using DNA (Hoechst 33342) signal to quantify NET formation (n = 3 biological replicates, combined data, each dot represents the number of NET-positive tiles in one image quantified from three images/condition). (F) as in (E) but with/without pre-digestion of NET content with RNase A (n = 3 biological replicates, representative images, scale bar: 10 μm). (G) Quantification of (F) (n = 3 biological replicates, combined data, each dot represents the number of NET-positive tiles in one image quantified from three images/condition). (H) As in (E) but using purified naRNA (cf. Fig. EV1I) alone or in complex with exogenously added LL37 (n = 3 biological replicates, representative images, scale bar: 10 μm). Data information: In (B), (E), and (G), data are presented as mean + SD. *p < 0.05 according to one-way ANOVA. Data shown in (D) have been deposited in the NCBI Gene Expression Omnibus under accession number GSE253440. Source data are available online for this figure.
Figure 2
Figure 2. naRNA drives TLR8 and NLRP3-dependent NET propagation in human PMN and TLR8-dependent macrophage activation.
(A) NF-κB dual luciferase assay in HEK293T cell transiently transfected and stimulated as indicated (eV = empty vector, n = 3–5 biological replicates, combined data). (B) Confocal microscopy of human primary PMNs, which were stimulated as indicated in the presence or absence of the TLR8-inhibitor CU-CPT9a (100 nM) and stained for NETs/DNA (Hoechst 33342, white, n = 3 biological replicates, representative images, scale bar: 10 μm, white arrows indicate NETs). (C) Quantification of (B) using DNA (Hoechst 33342) signal to quantify NET formation (n = 3 biological replicates, combined data, each dot represents the number of NET-positive tiles in one image, three images/condition). (D) Confocal microscopy analysis of primary C57BL/6 WT or Tlr13−/− murine BM-PMNs stimulated as indicated and stained for NETs/DNA (Hoechst 33342, white, n = 3 biological replicates, representative images, scale bar: 10 μm, white arrows indicate NETs). (E) Quantification of (D) as in (C) (n = 3 biological replicates, combined data). (F) Quantification of confocal microscopy as in (B, C) but using the NLRP3-inhibitor MCC950 (10 μM; n = 3 biological replicates, combined data, each dot represents the number of NET-positive tiles in one image, three images/condition,). (G) Levels of IL-1β, as measured by triplicate ELISA from human PMN stimulated as in (F) in the presence or absence of MCC950 (10 μM), CU-CPT9a (100 nM) or disulfiram (25 μM; n = 3 biological replicates, combined data). (H) Confocal microscopy of primary human PMNs stimulated for 3 h as indicated (PMA NETs, 1:50 dilution) or primed for 3 h with LPS (10 ng/mL), subsequently stimulated for 2 h (nigericin, 5 μM) in the presence or absence of MCC950 (10 μM) and stained for ASC (magenta) and DNA (Hoechst 33342, white, n = 3 biological replicates, scale bar: 10 μm, representative images). (I) Levels of IL-8, as measured by ELISA, from WT, TLR8−/− and UNC93B1−/− BlaER1 macrophage-like cells stimulated as indicated for 18 h (n = 3–4 biological replicates, combined data, each dot represents one biological replicate). Data information: In (A), (C), (EG), and (I), data are presented as mean + SD. In (A), (EG), and (I), *p < 0.05 according to one-way ANOVA. In (C), *p < 0.05 according to non-parametric one-way ANOVA. Please note that selected panels in (B), (D), and (H) also appear in Fig. EV3A, B, and D, respectively, as these two experiments were carried out simultaneously or were part of the same experiment, and hence control conditions (e.g., unstimulated) are identical. Source data are available online for this figure.
Figure 3
Figure 3. NETs induce naRNA and NOD2-dependent activation of keratinocytes.
(A) Levels of IL-8, as measured by triplicate ELISA upon release by primary normal human epidermal keratinocytes (NHEK) stimulated as indicated for 24 h (n = 3 biological replicates, combined data, each dot represents one biological replicate). (BD) Fold changes in the expression of (B) IL17C, (C) LL37, or (D) IL36G in NHEK stimulated as indicated for 24 h. qPCR was performed in triplicate and fold changes calculated relative to unstimulated condition (n = 3 biological replicates, representative of one biological replicate is shown, each dot represents one technical replicate). (E, F) qPCR as in (B) but for IL17C (E) and Cxcl10 (F) in murine C57BL/6 WT keratinocytes stimulated for 1 h (n = 3 biological replicates, combined data, each dot represents one biological replicate). (G) Triplicate qPCR as in B but for IL8 in NHEK 3D human skin equivalent constructs stimulated as indicated for 24 h (n = 3 biological replicates, representative of one biological replicate is shown, each dot represents one technical replicate). (H) As in A but with or without NOD2 siRNA (3.5 nM; n = 3 biological replicates, combined data, each dot represents one biological replicate). (I) As in (H) but in the presence or absence of the RIPK2 inhibitor GSK583 (1 μM; n = 3–4 biological replicates, combined data, each dot represents one biological replicate). (JM) Triplicate qPCR as in (B) but for IL17C (J), IL36G (K), Cxcl2 (L), or Cxcl10 (M) in murine C57BL/6 WT or Nod2 KO keratinocytes stimulated as indicated for 1 h (n = 3 biological replicates, combined data, each dot represents one biological replicate). Data information: In (AM), data are presented as mean + SD. In (AG) and (JM), *p < 0.05 according to one-way ANOVA. In (H) and (I), *p < 0.05 according to two-way ANOVA. Source data are available online for this figure.
Figure 4
Figure 4. naRNA is a driver of NET-associated in vivo inflammation.
(A) Ear thickness quantified daily in WT C57BL6 mice injected intradermally on day 0 as indicated (n = 5 biological replicates per group, combined data from 3 experiments). (B) Fluorescence imaging monitored hourly in LysMEGFP/+ mice injected intradermally at t = 0 as indicated (n = 10 biological replicates per group, combined data from 2 experiments). (C) as in (A) but also using Tlr13−/− mice (n = 7 biological replicates each, combined data from 2 experiments). (D) as in (C) but instead of intradermal injection, topical imiquimod application was performed on day 0–4 (C57BL/6 n = 7, Tlr13−/− n = 7 biological replicates, combined data from 2 experiments). (E) Measurement of epidermal thickness of Hematoxylin and Eosin (H&E)-stained ear skin specimens of (D) (C57BL/6 n = 8 biological replicates, Tlr13−/− n = 10 biological replicates, combined data from 2 experiments). (F) Histological analysis of H&E-stained ear skin specimens of (D) (d5 samples, C57BL/6 n = 8 biological replicates, Tlr13−/− n = 10 biological replicates, representative of one biological replicate is shown; dashed line delineates epidermal-dermal border; scale bar: 100 μm). (G) Immunofluorescence analysis of (E/F) using Hoechst (DNA, blue), anti-MPO (PMN, green) and anti-citH3 (NETs, red) staining (day 5 samples, C57BL/6 n = 7 biological replicates, Tlr13−/− n = 7 biological replicates, one biological replicate is shown; dashed line delineates epidermal edge; scale bar: 10 µm in close-up or 50 μm). (H) Quantification of (G) (C57BL/6 n = 7 biological replicates, Tlr13−/− n = 7 biological replicates, combined data from 2 experiments). Data information: In (AE) and (H), data are presented as mean + SD. In (AD), *p < 0.05 according to two-way ANOVA. In (E) and (H), *p < 0.05 according to Student’s t-test. Source data are available online for this figure.
Figure 5
Figure 5. naRNA and LL37 are pre-associated in resting neutrophils.
(A) Confocal microscopy of primary human PMNs stimulated as indicated for 3 h and stained for naRNA (anti-rRNA Y10b, magenta), LL37 (anti-hLL37-DyLight550, yellow), and DNA (Hoechst 33342, white, n = 3 biological replicates, representative images, scale bar 2 or 10 μm as indicated). (B) Pearson’s correlation coefficient (co-localization) analysis of (A) (n = 3 biological replicates, combined data, each dot represents one image, three images/condition). (C) Line plot analysis of LL37, RNA, and DNA staining of primary human PMNs stimulated as indicated in (A) was performed using ZenBlue3 software (n = 3 biological replicates, representative graph, scale bar 2 µm). White arrows indicate co-localization of RNA and LL37. (D) As C but staining with SYTO RNAselect instead of anti-rRNA (n = 3 biological replicates, representative graph, scale bar 10 µm). White arrows indicate co-localization of RNA and LL37. (E) As in (D) but showing x,z and y,z projections from multiple z-stacks. White arrows indicate co-localization of RNA and LL37. (F) As in (A/C) but on 50–60 nm ultrathin sections of unstimulated PMNs (n = 3 biological replicates, representative image, scale bar 2 µm). Line plot analysis was performed using ImageJ-Win64 software (n = 3 biological replicates, representative graph). White arrows indicate co-localization of RNA and LL37. (G) Transmission electron microscopy of unstimulated human primary PMNs using anti-rRNA and anti-hLL-37 primary and immunogold (6 nm (black arrow) and 12 nm (white arrow), respectively)-labeled secondary antibodies (n = 3 biological replicates, representative images, scale bars as indicated). (H) Quantification of confocal microscopy of primary human PMNs stimulated as indicated with fresh or old NETs generated by incubation in PMN culture medium or human serum treatment, respectively, stained for DNA (Hoechst 33342) and quantified as before (n = 2 biological replicates, each dot represents the number of NET-positive tiles in one image quantified from three images/condition). (I) Levels of IL-8, as measured by triplicate ELISA upon release from primary normal human epidermal keratinocytes (NHEK) stimulated for 24 h as indicated in (F) (n = 8 biological replicates, combined data, each dot represents one biological replicate). Data information: In (B), (H), and (I), data are presented as mean + SD. In (B) and (I), *p < 0.05 according to one-way ANOVA. In (H), *p < 0.05 according to Kruskal–Wallis test with Dunn’s correction. Please note that selected panels in (C) and (E) also appear in Fig. EV5D as these two experiments were carried out simultaneously or were part of the same experiment, and hence control conditions (e.g., unstimulated) are identical. Source data are available online for this figure.
Figure EV1
Figure EV1. Controls, IF microscopy of murine bone marrow-derived neutrophils and of stem cell-derived PMNs, 3D reconstruction of naRNA in NETs, controls of electron microscopy and analysis of isolated naRNA.
(A) Confocal microscopy of unstimulated or PMA (600 nM) stimulated primary human PMNs after 3 h and stained for naRNA (anti-rRNA Y10b, magenta) and DNA (Hoechst 33342, white). Complete staining and secondary antibody controls only (n = 3 biological replicates, representative images, scale bar: 10 μm, white arrows indicate NETs). (B) Confocal microscopy of unstimulated primary human PMNs (control to Fig. 1A) after 3 h and stained for naRNA (anti-rRNA Y10b, magenta) and DNA (Hoechst 33342, white, n = 3 biological replicates, representative images, scale bar: 10 μm, white arrows indicate NETs). (C) Confocal microscopy of primary murine BM-PMNs of C57BL/6 WT mice stimulated as indicated for 16 h and stained as in (B) (n = 3 biological replicates, representative images, scale bar: 10 μm, white arrows indicate NETs). (D) Confocal microscopy of primary human stem cells differentiated in vitro with/without 100 μM 5-ethynyluridine (5-EU), click-labeled with a fluorescent dye (yellow, total RNA), and stained for naRNA (anti-rRNA Y10b, magenta) and DNA (Hoechst 33342, white, n = 3 biological replicates, representative images, scale bar: 10 μm, 2 μm in cropped image, white arrows indicate NETs). (E) Brightfield microscopy analysis of control cytospun of primary human stem cell-derived PMNs shown in (A) (n = 3 biological replicates, representative images, scale bar: 10 μm). (F) FACS analysis of cells shown in (D) and (E) (n = 3 biological replicates, representative data of one biological replicate shown). (G) As in (B) showing 3D image reconstruction of NETs from z-stacks created with ZenBlue3 (n = 3 biological replicates, representative images, scale bar as indicated). (H) Scanning electron microscopy of PMA-treated human primary PMNs showing only secondary antibody staining (no primary antibody) control of Fig. 1C (n = 1 biological replicate, representative data; the image on the right is a composite image with signals from secondary electron and backscattered electron detectors for topography and additional material information, respectively). (I) Agilent TapeStation quantification of naRNA isolated from mock or PMA NETs (from n = 4–6 biological replicates, combined data, each dot represents one biological replicate). Data information: In (I), data are presented as mean + SD. *p < 0.05 according to Mann–Whitney test. Please note that the panel shown in B also appears in Fig. EV2C as these two experiments were carried out simultaneously or were part of the same experiment, and hence control conditions (e.g., unstimulated) are identical. Source data are available online for this figure.
Figure EV2
Figure EV2. Antibacterial effect of NETs on live S. aureus, isolation of NET content and controls of IF microscopy.
(A) Extracellular bactericidal activity of human PMNs/NETs after infection with S. aureus and treatment with RNase A and DNase I during or after formation of PMA-induced NETs (n = 8 biological replicates, combined data). (B) Workflow for NET content preparation from one donor and transfer to naive human primary PMNs from a second donor (created with BioRender.com). (C) Confocal microscopy of primary human PMNs stimulated for 3 h with PMA (600 nM) or NET content (harvested with/without RNase inhibitor and diluted 1:50 or 1:500), and then stained for NETs/DNA (Hoechst 33342, n = 9 biological replicates, representative images, scale bar: 10 μm, white arrows indicate NETs). (F) As in (C) but with/without pre-digestion of NET content with RNase A (controls to Fig. 1F, n = 3 biological replicates, representative images, scale bar: 10 μm, white arrows indicate NETs). (E) Confocal microscopy of unstimulated or PMA-stimulated (3 h) primary human PMNs (controls to Fig. 1H), subsequently stained for DNA (Hoechst 33342, white, n = 9 biological replicates, representative images, scale bar: 10 μm, white arrows indicate NETs). Data information: In (A), data are presented as mean + SD. *p < 0.05 according to one-way ANOVA. Please note that the panel shown in (C) also appears in Fig. EV1B as these two experiments were carried out simultaneously or were part of the same experiment, and hence control conditions (e.g., unstimulated) are identical. Source data are available online for this figure.
Figure EV3
Figure EV3. Inhibition of PAD4 in human PMNs during NET formation assay, Unc93b1−/− and Tlr9−/− BM-PMN stimulation with human NETs and inhibition of NLRP3 in human PMNs during NET formation assay.
(A) Confocal microscopy of primary human PMNs, stimulated for 3 h in the presence or absence of the pan-PAD-inhibitor Cl-amidine (200 μM), and subsequently stained for DNA (Hoechst 33342, white) (n = 3 biological replicates, representative images; scale bar 10 μm, white arrows indicate NETs). (B) Confocal microscopy of primary C57BL/6 WT or Unc93b1−/− murine BM-PMNs stimulated for 16 h as indicated in (A) (n = 3 biological replicates WT, n = 1 Unc93b1−/− biological replicate, representative images, scale bar: 10 μm, white arrows indicate NETs). (C) Confocal microscopy of primary C57BL/6 WT or Tlr9−/− murine BM-PMNs stimulated for 16 h as indicated in (A) (n = 3 biological replicates, representative images, scale bar: 10 μm, white arrows indicate NETs). (D) As in (A) in the presence or absence of the NLRP3-inhibitor MCC950 (10 μM, n = 3 biological replicates, representative images; scale bar 50 μm for 40× and 10 μm for 63×, white arrows indicate NETs). Data information: Please note that selected panels in (A), (B), and (D) also appear in Fig. E2B, (D) and (H), respectively, as these two experiments were carried out simultaneously or were part of the same experiment, and hence control conditions (e.g., unstimulated) are identical. Source data are available online for this figure.
Figure EV4
Figure EV4. Immune responses of PBMCs and human and murine keratinocytes to NETs.
(A) Levels of IL-8, as measured by triplicate ELISA in WT, TLR8−/−, and TLR7−/− THP-1 cells stimulated as indicated for 18 h. Values were normalized to PMA+ionomycin control (n = 4 biological replicates, combined data, each dot represents one biological replicate). (BD) Levels of TNF (B, n = 4 biological replicates), IL-6 (C, n = 3 biological replicates), and IL-8 (D, n = 3 biological replicates), as measured by triplicate ELISA in primary human PBMCs stimulated as indicated with/without CU-CPT9a for 24 h (combined data, each dot represents one biological replicate). (E) Levels of IFN-γ, as measured by triplicate upon release from NK-92 MI cells stimulated as indicated for 24 h (n = 3 biological replicates, combined data, each dot represents one biological replicate). (F) Levels of IL-8, as measured by triplicate ELISA upon release from N/TERT-1 keratinocytes stimulated as indicated for 24 h (n = 3 biological replicates, combined data, each dot represents one biological replicate). (GI) Fold changes in the expression of (G) Cxcl1, (H) Cxcl2, or (I) Cxcl5 in murine C57BL/6 WT keratinocytes stimulated as indicated for 1 h. qPCR was performed in triplicate and fold changes were calculated relative to untreated control (n = 3 biological replicates, combined data, each dot represents one biological replicate). (J) Levels of IL-8 as measured by triplicate ELISA upon release from NHEK 3D human skin equivalent constructs stimulated as indicated for 24 h (n = 3 biological replicates, representative of one biological replicate is shown, each dot represents one technical replicate). (K) Levels of IL-8, as measured by triplicate ELISA in N/TERT-1 keratinocytes stimulated as indicated with/without MyD88 siRNA knockdown for 24 h (n = 1 biological replicate, each dot represents one technical replicate). (LO) Levels of IL-8 (LN) or IL-1β (O), as measured by ELISA upon release from primary human normal keratinocytes (NHEK) stimulated as indicated with/without TRIF (L), MAVS (M) or NLRP1 (N, O) siRNA knockdown for 24 h (n = 1 biological replicate, each dot represents one technical replicate). (P) Fold changes in the expression of NOD2 in primary human normal keratinocytes (NHEK) after NOD2 siRNA knockdown. qPCR was performed in triplicate and fold changes were calculated relative to unstimulated control (control to Fig. 3G, n = 3 biological replicates, combined data, each dot represents one biological replicate). (Q) In vitro colonization assay (CFU) of primary human keratinocytes primed as indicated for 24 h and subsequently exposed to S. aureus for 1 h (n = 4 biological replicates, combined data, each dot represents one technical replicate). Data information: In (AQ), data are presented as mean + SD. In (AP), *p < 0.05 according to one-way ANOVA. In (Q), *p < 0.05 according to Student’s t-test. Source data are available online for this figure.
Figure EV5
Figure EV5. Pre-association of naRNA and LL37 in resting and NET-releasing healthy donor neutrophils and graphical abstract.
(A) Confocal microscopy of primary human PMNs left untreated and stained for RNA only (mouse anti-human rRNA Y10b + anti-mouse AF647, magenta), secondary antibody control for RNA and staining for LL37 (anti-mouse AF647 (magenta) + rabbit anti-human LL37-Dylight550 (yellow)) or counterstaining for rRNA Y10b and LL37 (mouse anti-human rRNA Y10b-AF647 (magenta) + rabbit anti-human LL37-Dylight550 (yellow)) and DNA (Hoechst 33342, white, n = 3 biological replicates, representative images, scale bar 10 μm). Controls for Figs. 5A,C and EV5B. (B) Confocal microscopy with line plot analysis of primary human PMNs stimulated as indicated for 3 h and stained for naRNA (anti-rRNA Y10b, magenta), LL37 (anti-hLL37-DyLight550, yellow) and DNA (Hoechst 33342, white, n = 3 biological replicates, representative images). The line plot analysis of LL37, RNA, and DNA staining was performed using ZenBlue3 software. One to two different line plots from the same representative image are shown. Additional examples of images shown in Fig. 5C. (C) Confocal microscopy of primary human PMNs left untreated and stained for naRNA (SYTO RNAselect, magenta), LL37 (anti-hLL37-DyLight550, yellow), and DNA (Hoechst 33342, white, n = 3 biological replicates, representative images, scale bar 10 μm). (D) Line plot analysis of LL37, RNA, and DNA staining of (A). The analysis was performed using ZenBlue3 software. Three different line plots from the same representative image are shown (scale bar 10 μm). Areas of intensity overlap show up as white. (E) 3D reconstructions of z-stacks from (A). (F) Confocal microscopy of PMA-induced NETs from primary human PMNs incubated for 30 min or 4 h with human serum and stained for DNA (Hoechst 33342, white) and naRNA (anti-rRNA Y10b, magenta or red). Lower magnification (left, scale bar = 50 µm) and higher magnification (right, scale bar = 20 µm) for one presentative of n = 2 biological replicates shown. Data information: Please note that selected panels in (D) also appear in Fig. 5C and D, respectively, as these two experiments were carried out simultaneously or were part of the same experiment. Source data are available online for this figure.

References

    1. Abtin A, Eckhart L, Mildner M, Ghannadan M, Harder J, Schroder JM, Tschachler E. Degradation by stratum corneum proteases prevents endogenous RNase inhibitor from blocking antimicrobial activities of RNase 5 and RNase 7. J Invest Dermatol. 2009;129:2193–2201. doi: 10.1038/jid.2009.35. - DOI - PubMed
    1. Adase CA, Borkowski AW, Zhang LJ, Williams MR, Sato E, Sanford JA, Gallo RL. Non-coding double-stranded RNA and antimicrobial peptide LL-37 induce growth factor expression from keratinocytes and endothelial cells. J Biol Chem. 2016;291:11635–11646. doi: 10.1074/jbc.M116.725317. - DOI - PMC - PubMed
    1. Altincicek B, Stotzel S, Wygrecka M, Preissner KT, Vilcinskas A. Host-derived extracellular nucleic acids enhance innate immune responses, induce coagulation, and prolong survival upon infection in insects. J Immunol. 2008;181:2705–2712. doi: 10.4049/jimmunol.181.4.2705. - DOI - PubMed
    1. Balak DM, van Doorn MB, Arbeit RD, Rijneveld R, Klaassen E, Sullivan T, Brevard J, Thio HB, Prens EP, Burggraaf J, Rissmann R. IMO-8400, a toll-like receptor 7, 8, and 9 antagonist, demonstrates clinical activity in a phase 2a, randomized, placebo-controlled trial in patients with moderate-to-severe plaque psoriasis. Clin Immunol. 2017;174:63–72. doi: 10.1016/j.clim.2016.09.015. - DOI - PubMed
    1. Barnes BJ, Adrover JM, Baxter-Stoltzfus A, Borczuk A, Cools-Lartigue J, Crawford JM, Dassler-Plenker J, Guerci P, Huynh C, Knight JS, et al. Targeting potential drivers of COVID-19: neutrophil extracellular traps. J Exp Med. 2020;217:e20200652. doi: 10.1084/jem.20200652. - DOI - PMC - PubMed

MeSH terms