. 2024 Jun;16(6):1284-1309.
doi: 10.1038/s44321-024-00079-1. Epub 2024 May 23.

Diabetes drugs activate neuroprotective pathways in models of neonatal hypoxic-ischemic encephalopathy

Affiliations

Diabetes drugs activate neuroprotective pathways in models of neonatal hypoxic-ischemic encephalopathy

Laura Poupon-Bejuit et al. EMBO Mol Med. 2024 Jun.

Abstract

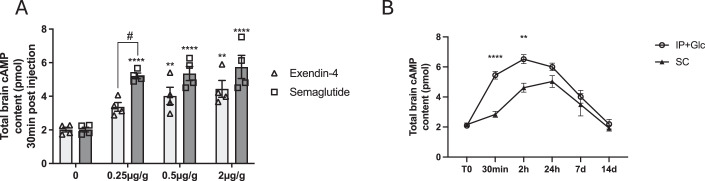
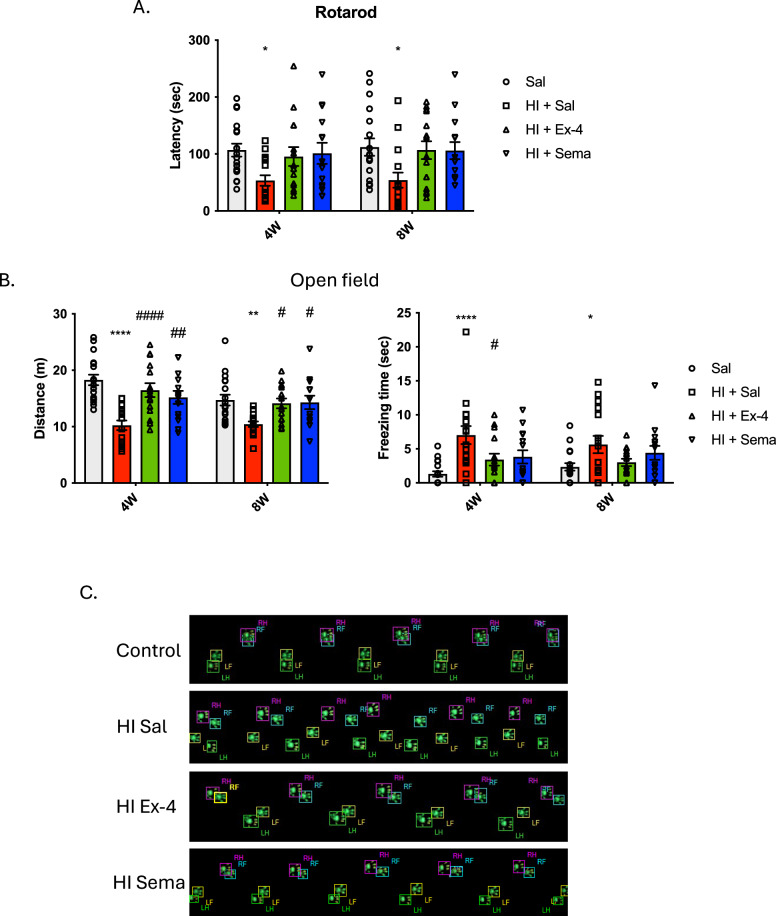
Hypoxic-ischaemic encephalopathy (HIE) arises from diminished blood flow and oxygen to the neonatal brain during labor, leading to infant mortality or severe brain damage, with a global incidence of 1.5 per 1000 live births. Glucagon-like Peptide 1 Receptor (GLP1-R) agonists, used in type 2 diabetes treatment, exhibit neuroprotective effects in various brain injury models, including HIE. In this study, we observed enhanced neurological outcomes in post-natal day 10 mice with surgically induced hypoxic-ischaemic (HI) brain injury after immediate systemic administration of exendin-4 or semaglutide. Short- and long-term assessments revealed improved neuropathology, survival rates, and locomotor function. We explored the mechanisms by which GLP1-R agonists trigger neuroprotection and reduce inflammation following oxygen-glucose deprivation and HI in neonatal mice, highlighting the upregulation of the PI3/AKT signalling pathway and increased cAMP levels. These findings shed light on the neuroprotective and anti-inflammatory effects of GLP1-R agonists in HIE, potentially extending to other neurological conditions, supporting their potential clinical use in treating infants with HIE.

Keywords: Exendin-4; GLP1-R Agonists; Neonatal Hypoxic-ischaemic Encephalopathy; Neuroprotective Mechanisms; Semaglutide.


Conflict of interest statement

The authors declare no competing interests.

Figures

Figure 1
Figure 1. Semaglutide and exendin-4 activate the GLP1 receptor in CHO-GLP1-R cells.
GLP1R/pCRE-luciferase/CHO-K1 cells treated with 1 µM of exendin-4 or semaglutide with or without antagonist, exendin9-39 (500 nM) compared with untreated cells (n = 6 wells/group). (A) Measurement of luciferase activity induced by GLP1-R activation with exendin-4 and semaglutide. (B) cAMP levels measured in cell lysate and media after treatment with GLP1-R agonists compared with untreated cells. Data information: Error bars indicate mean ± SEM. Statistical analysis was performed using an ordinary two-way analysis of variance (ANOVA) corrected for using (A) Tukey’s multiple comparisons test and (B) Sidak’s multiple comparison test. ***P < 0.001, ****P < 0.0001. Source data are available online for this figure.
Figure 2
Figure 2. Semaglutide provides similar protection as exendin-4 following OGD in vitro.
(A) GLP1-R agonists Exendin-4 and Semaglutide trigger GLP1-R signalling via cAMP and PI3K. Transcription of prosurvival genes and inhibition of apoptotic pathways may counteract the effect of hypoxia-mediated apoptosis. Incubation with GLP1-R antagonist Exendin 9 prevents GLP1-R activation. (B) Evaluation of neuroinflammatory marker HIF-1-α using qPCR in the in vitro neuronal cells exposed to OGD following treatment with exendin-4 or semaglutide, and in combination with exendin-9 (Ex-9) (n = 8 for all experimental groups). (C) Neuronal damage marker ATF-3 assessed using qPCR (n = 3 for all experimental groups). (D) Levels of the neuroprotective marker CREB were investigated using qPCR (n = 6 for all experimental groups). (E) Cell viability assessed after OGD and treatments with exendin-4, semaglutide, and combination with exendin-9 (n = 6 for all experimental groups). Evaluation of apoptosis in primary neuronal cell cultures exposed to OGD with measure of gene expression for (F) Bcl-xL (n = 4 for all experimental groups) and (G) Bcl-2 (n = 8 for all experimental groups). (H) Caspase 3 activity (n = 5 for all experimental groups). Data information: Error bars indicate mean ± SEM. Statistical analysis was performed using an ordinary one-way analysis of variance (ANOVA) corrected for using Tukey’s multiple comparisons test. * or # or $, p < 0.05; ** or ## or $$, p < 0.01; *** or ### or $$$, p < 0.001; **** or #### or $$$$, p < 0.0001. * to compare with control (Sal) and # to compare with OGD group (Sal + OGD). $ symbol used to compare GLP1-R agonists treatment with corresponding treatment in combination with exendin-9. Source data are available online for this figure.
Figure 3
Figure 3. Single dose semaglutide delivered IP crosses the BBB and provides activation of the GLP1-R.
(A) cyclic AMP (cAMP) content in the brain 30 min after IP delivery of exendin-4 and semaglutide to check their efficiency at crossing the blood-brain-barrier (BBB). * to compare to untreated mice, and # to compare between exendin-4 and semaglutide at the corresponding dose (n = 4 for all experimental groups). (B) Kinetics of cAMP content in the brain for validation of the IP route of administration, with glucose supplementation, and time taken to reach the brain in comparison to the standard subcutaneous route (n = 4 per time point for each experimental group). Data information: Error bars indicate mean ± SEM. Statistical analysis was performed using an ordinary two-way analysis of variance (ANOVA) corrected for using Sidak’s multiple comparisons test. * or #, p < 0.05; ** or ##, p < 0.01; **** or ####, p < 0.0001. Source data are available online for this figure.
Figure 4
Figure 4. Semaglutide provides single-dose, long-lasting protection after HI.
(A) Nissl staining 7 days post-HI in control (saline, n = 16), HI alone (HI+saline, n = 18) and HI treated with exendin-4 (4× 0.5 µg/g every 12 h, n = 18) or semaglutide (1× 0.25 µg/g, n = 17) supplemented with glucose (magnification ×10, ×40). Evaluation of (B) macroscopic score 7 days post-HI. (C) Survival curve for saline (n = 18), HI saline-treated (n = 19), HI treated with exendin-4 (4× 0.5 µg/g) (n = 18) or semaglutide (1× 0.25 µg/g) supplemented with glucose (n = 18) followed for 8 weeks after HI injury. (D) Nissl staining (magnification ×10, ×40) of the cortex and hippocampus 8 weeks following HI, and (E) the macroscopic score of infarct volume for saline (n = 22), HI saline-treated (n = 18), HI treated with exendin-4 (4× 0.5 µg/g) (n = 22) or semaglutide (1× 0.25 µg/g) supplemented with glucose (n = 22). Data information: Error bars indicate mean ± SEM. Statistical analysis was performed using an ordinary one-way analysis of variance (ANOVA) corrected for using Tukey’s multiple comparisons test. * or #, p < 0.05; ** or ##, p < 0.01; *** or ###, p < 0.001; **** or ####, p < 0.0001. * symbol indicates comparison with saline-treated controls, and # symbol indicates comparison with saline-treated HI group (HI + sal). Source data are available online for this figure.
Figure 5
Figure 5. Semaglutide limits the neuroinflammatory response following HI in vivo 7 days post-HI.
Quantitative immunoreactivity threshold measurements of markers for microglia (A) CD68, (B) Iba1, and (C) astrocytes (GFAP) in the cortex and the hippocampus 7 days post-HI in the 4 groups: saline, HI saline treated (HI+Sal), HI exendin-4 and HI semaglutide with cohort sizes of n = 16, n = 18, n = 18 and n = 17, respectively. Corresponding representative microscopic images taken at ×10 and ×40 magnification are included below the relevant graphs. Data information: Error bars indicate mean ± SEM. Statistical analysis was performed using an ordinary one-way analysis of variance (ANOVA) corrected for using Tukey’s multiple comparisons test. * or #, p < 0.05; ** or ##, p < 0.01; *** or ###, p < 0.001; **** or ####, p < 0.0001. * symbol indicates comparison with saline-treated controls, and # symbol indicates comparison with saline-treated HI group (HI + sal). Source data are available online for this figure.
Figure 6
Figure 6. Semaglutide limits the neuroinflammatory response following HI in vivo following long-term assessment.
Quantitative immunoreactivity threshold measurements of markers for (A) macrophages (CD68), (B) microglia (Iba1), and (C) astrocytes (GFAP) in the cortex and the hippocampus 8 weeks post-HI in the 4 groups: saline, HI saline treated (HI+Sal), HI exendin-4 and HI semaglutide with cohort sizes of n = 18, n = 19, n = 18 and n = 18, respectively. Corresponding representative microscopic images taken at ×10 and ×40 magnification are included below the relevant graphs. Data information: Error bars indicate mean ± SEM. Statistical analysis was performed using an ordinary one-way analysis of variance (ANOVA) corrected for using Tukey’s multiple comparisons test. * or #, p < 0.05; ** or ##, p < 0.01; *** or ###, p < 0.001; **** or ####, p < 0.0001. * symbol indicates comparison with saline-treated controls, and # symbol indicates comparison with saline-treated HI group (HI + sal). Source data are available online for this figure.
Figure 7
Figure 7. GLP1-R agonists improve behavioural outcomes following HI in vivo.
Locomotor functions evaluated at 4 and 8 weeks of age with (A) rotarod latency to fall in control (saline, n = 18), HI alone (HI+saline, n = 16) and HI animals treated with exendin-4 (4× 0.5 μg/g every 12 h, n = 15) or semaglutide (1× 0.25 μg/g, n = 14) supplemented with glucose. (B) open field distance travelled in control (saline, n = 18), HI alone (HI+saline, n = 16) and HI animals treated with exendin-4 (4× 0.5 μg/g every 12 h, n = 15) or semaglutide (1× 0.25 μg/g, n = 14) supplemented with glucose and (C) freezing time in control (saline, n = 18), HI alone (HI+saline, n = 16) and HI animals treated with exendin-4 (4× 0.5 μg/g every 12 h, n = 15) or semaglutide (1× 0.25 μg/g, n = 14) supplemented with glucose. (C) Representative images of paw prints captured using the Noldus CatWalk XT automated gait analyser. The individual paws are recognised using distinctive colours. Data information: Error bars indicate mean ± SEM. Statistical analysis was performed using an ordinary two-way analysis of variance (ANOVA) corrected for using Tukey’s multiple comparisons test. * or #, p < 0.05; ** or ##, p < 0.01; *** or ###, p < 0.001; **** or ####, p < 0.0001. * symbol indicates comparison with saline-treated controls, and # symbol indicates comparison with saline-treated HI group (HI + sal). Source data are available online for this figure.
Figure 8
Figure 8. GLP1-R agonists activate CREB and PI3K pathways following neonatal HI in vivo.
(A) GLP1-R agonists Exendin-4 and Semaglutide trigger GLP1-R signalling via cAMP and PI3K. Transcription of prosurvival genes and inhibition of apoptotic pathways may counteract the effect of hypoxia-mediated apoptosis. Incubation with GLP1-R antagonist Exendin 9 prevents GLP1-R activation. (B) GLP1-R gene expression levels assessed with qPCR (n = 6 for all experimental groups). (C) Evaluation of neuroprotection mechanisms with measurement of gene expression for CREB (n = 6 for all experimental groups) and (D, E) protein levels for phosphorylated-CREB (n = 4 for all experimental groups) and (D, F) phosphorylated-GSK3β (n = 4 for all experimental groups). Activation of the PI3/Akt pathway was also assessed by western blot (G) quantification of phospho-PI3K (H) and (G, I) phosphorylated-Akt protein levels (n = 4 for all experimental groups). Data information: Error bars indicate mean ± SEM. Statistical analysis was performed using an ordinary one-way analysis of variance (ANOVA) corrected for using Tukey’s multiple comparisons test. * or #, p < 0.05; ** or ##, p < 0.01; *** or ###, p < 0.001; **** or ####, p < 0.0001. * symbol indicates comparison with saline-treated controls, and # symbol indicates comparison with saline-treated HI group (HI + sal). Source data are available online for this figure.
Figure EV1
Figure EV1
In vivo HI and GLP1-R agonist short-term and long-term studies experimental design.
Figure EV2
Figure EV2. Complementary results for in vitro study post-OGD and in vivo study post-HIE.
(A) Evaluation of proinflammatory marker IL-1β using qPCR in the in vitro neuronal cells exposed to OGD following treatment with exendin-4 or semaglutide, and in combination with exendin-9 (Ex-9) (n = 3 for all experimental groups). (B) Apoptotic proteins caspase 8 (n = 5 for all experimental groups) and (C) caspase 9 (n = 6 for all experimental groups) were measured using caspase assays. (D) Luminescent images of GLP1R/pCRE-luciferase/CHO-K1 cells treated with 0–1 µM of exendin-4 or semaglutide with or without antagonist, exendin9-39 (500 nM). (E) Determination of optimal routes of administration for avoiding hypoglycaemia with glucose measurement after semaglutide IP, semaglutide SC and semaglutide + glucose regimens (n = 4 per experimental group for each time point). (F) Dosing experiment with evaluation of macroscopic score after HI and treatment to determine optimal dose for semaglutide in the 10 groups: Sal (n = 20), HI + Sal (n = 44), HI + Ex-4 (n = 20), HI + 0.5 µg/g semaglutide (n = 18), HI + 2× 0.5 µg/g semaglutide (n = 8), HI + 0.25 µg/g semaglutide (n = 16), HI + 2× 0.25 µg/g semaglutide (n = 7), HI + 0.175 µg/g semaglutide (n = 11), HI + 0.1 µg/g semaglutide (n = 5), HI + 2× 0.1 µg/g semaglutide (n = 11). Data information: Error bars indicate mean ± SEM. Statistical analysis was performed using an ordinary one-way (AC) or two-way (E, F) analysis of variance (ANOVA) corrected for using Tukey’s multiple comparisons test. * or # or $, p < 0.05; ** or ## or $$, p < 0.01; *** or ### or $$$, p < 0.001; **** or #### or $$$$, p < 0.0001. * to compare with control (Sal) and # to compare with OGD group (Sal + OGD). $ symbol used to compare GLP1-R agonists treatment with corresponding treatment in combination with exendin-9.
Figure EV3
Figure EV3. Toxicity assessment after semaglutide treatment.
(A, B) Representative images of Haematoxylin & Eosin staining showing no adverse effects observed in tissue architecture in naïve P10 mice following a single high dose of semaglutide (0.25 μg/g) in the brain or major visceral organs compared to controls. (C) CD68 staining and quantification revealed no macrophage activation or infiltration compared to controls. (D) Blood analysis also showed no significant changes in response to high dose semaglutide (n = 4 for all experimental groups). Scale bar: 0.1 cm (brain), 100 µm (Hippocampus), 60 µm (Cortex, Heart, Spleen, Liver, Lung, Kidney and all CD68 staining images in panel C). Data information: error bars indicate mean ± SD, Statistical analysis was performed using a t-test. *p < 0.05, **p < 0.01, ***p < 0.001, ****p < 0.0001. * to compare with control and group treated with semaglutide.
Figure EV4
Figure EV4. Complementary results for long-term in vivo study post HI.
(A, B) No significant microglia activation or infiltration was observed or measured in sections from organ harvested from saline controls (Sal, n = 18), HI non-treated (HINT, n = 16), HI treated with Exendin-4 (Ex-4, n = 15) and HI treated with Semaglutide animals (Sema, n = 14). Scale bar: 60 µm. Locomotor functions were evaluated at 1 and 2 months post-HI with Catwalk and revealed significant exendin-4 and semaglutide induced improvements at 4 weeks (CF) and 8 weeks (GJ) of age compared with the age-matched hypoxic-ischaemic group for various parameters: (C, G) run duration, (D, H) average speed, (E, I) regularity index, and (F, J) stride length (RF = right front, RH = right hind, LF = left front, LH = left hind) in saline controls (Control, 1 M n = 18, 2 M n = 15), HI non-treated (HINT, 1 M n = 16, 2 M n = 13), HI treated with Exendin-4 (Ex-4, 1 M n = 14, 2 M n = 12) and HI treated with Semaglutide (Sema, 1 M n = 21, 2 M n = 22). Data information: Each n represents an individual mouse. Error bars indicate mean ± SD. Statistical analysis performed using an ordinary one-way analysis of variance (ANOVA) with a Dunnett’s multiple comparisons test. * or #, p < 0.05; ** or ##, p < 0.01; *** or ###, p < 0.001; **** or ####, p < 0.0001. * to compare with control and # to compare with HI non-treated (NT) group.
Figure EV5
Figure EV5. Blood and plasma analysis 8 weeks post-insult.
(A) Blood analysis from the long-term 8 weeks study showed HI resulted in a significant increase in WBCs, platelets and haemoglobin distribution widths (HDWs) and a trend towards decreased RBCs, haemoglobin (HGB), increased red cell distribution widths (RDWs) and MCVs. Treatment with GLP1-R agonists improved the RBC, RDW, HGB, HDW and MCV counts (n = 4 per experimental group). (B) Analysis of plasma parameters (sodium, chloride, urea, creatinine, total cholesterol, glucose, triglycerides, glycerol levels) in saline controls (Saline, n = 9), saline-treated HI animals (HINT, n = 7), HI treated with Exendin-4 (Ex-4, n = 6) and HI treated with Semaglutide (Sema, n = 7), which showed no significant difference between groups except for a statistically significant increase in creatinine in all HI groups. Data information: Each n represents an individual mouse. Error bars indicate mean ± SD. Statistical analysis performed using an ordinary one-way analysis of variance (ANOVA) with a Dunnett’s multiple comparisons test. * or #, p < 0.05; ** or ##, p < 0.01; *** or ###, p < 0.001; **** or ####, p < 0.0001. * to compare with control and # to compare with HI non-treated (NT) group.
Figure EV6
Figure EV6. All qPCR control ct values are shown from the study.
The GAPDH Ct value for various markers investigated by qPCR in the in vitro neuronal cells exposed to OGD following treatment with exendin-4 or semaglutide, and in combination with exendin-9: HIF-1-α (n = 6 for all experimental group), ATF-3 (n = 3 for all experimental groups), Bcl-2 (n = 6 for all experimental groups), Bcl-xL (n = 4 for all experimental groups) and CREB (n = 6 for all experimental groups). In addition, the Ct values for qPCR into Glp1R and CREB in the HIE model are also shown(Sal n = 4, HINT n = 6, HI Ex-4 n = 5 and HI Sema n = 5). Data information: error bars indicate mean ± SEM. Each n represents an individual sample.

References

    1. Allen KA, Brandon DH. Hypoxic ischemic encephalopathy: pathophysiology and experimental treatments. Newborn Infant Nurs Rev. 2011;11:125–133. doi: 10.1053/j.nainr.2011.07.004. - DOI - PMC - PubMed
    1. Askenase MH, Sansing LH. Stages of the inflammatory response in pathology and tissue repair after intracerebral hemorrhage. Semin Neurol. 2016;36:288–297. doi: 10.1055/s-0036-1582132. - DOI - PMC - PubMed
    1. Athauda D, Maclagan K, Skene SS, Bajwa-Joseph M, Letchford D, Chowdhury K, Hibbert S, Budnik N, Zampedri L, Dickson J, et al. Exenatide once weekly versus placebo in Parkinson’s disease: a randomised, double-blind, placebo-controlled trial. Lancet. 2017;390:1664–1675. doi: 10.1016/S0140-6736(17)31585-4. - DOI - PMC - PubMed
    1. Basalay MV, Davidson SM, Yellon DM. Neuroprotection in rats following ischaemia-reperfusion injury by GLP-1 analogues-liraglutide and semaglutide. Cardiovasc Drugs Ther. 2019;33:661–667. doi: 10.1007/s10557-019-06915-8. - DOI - PMC - PubMed
    1. Beurel E, Grieco SF, Jope RS. Glycogen synthase kinase-3 (GSK3): regulation, actions, and diseases. Pharmacol Ther. 2015;148:114–131. doi: 10.1016/j.pharmthera.2014.11.016. - DOI - PMC - PubMed

MeSH terms