. 2024 May 23;24(1):625.
doi: 10.1186/s12885-024-12344-0.

Prospective associations of leucocyte subtypes and obesity with the risk of developing cutaneous malignant melanoma in the UK Biobank cohort

Affiliations

Prospective associations of leucocyte subtypes and obesity with the risk of developing cutaneous malignant melanoma in the UK Biobank cohort

Sofia Christakoudi et al. BMC Cancer. .

Abstract

Background: Obesity is associated with chronic low-grade inflammation, which is linked to cancer development. Abdominal obesity (a body mass index, ABSI), however, has unusually been associated inversely with cutaneous malignant melanoma (CMM), while general obesity (body mass index, BMI) is associated positively. Leucocytes participate in inflammation and are higher in obesity, but prospective associations of leucocytes with cutaneous malignant melanoma are unclear.

Methods: We examined the prospective associations of neutrophil, lymphocyte, and monocyte counts (each individually), as well as the prospective associations of ABSI and BMI, with cutaneous malignant melanoma in UK Biobank. We used multivariable Cox proportional hazards models and explored heterogeneity according to sex, menopausal status, age (≥ 50 years at recruitment), smoking status, ABSI (dichotomised at the median: ≥73.5 women; ≥79.8 men), BMI (normal weight, overweight, obese), and time to diagnosis.

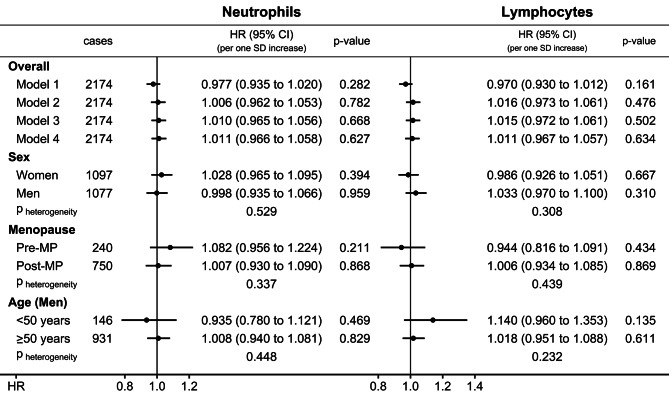
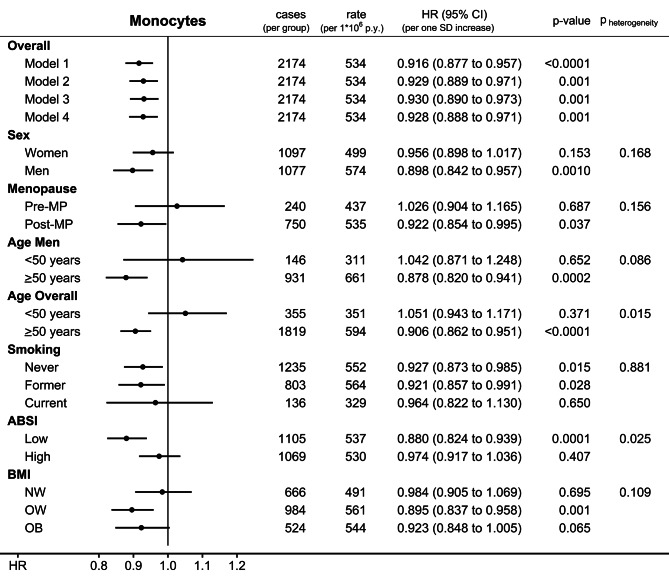
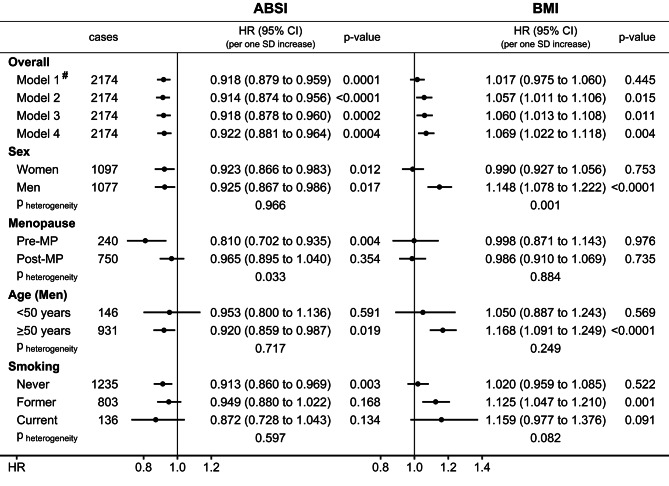
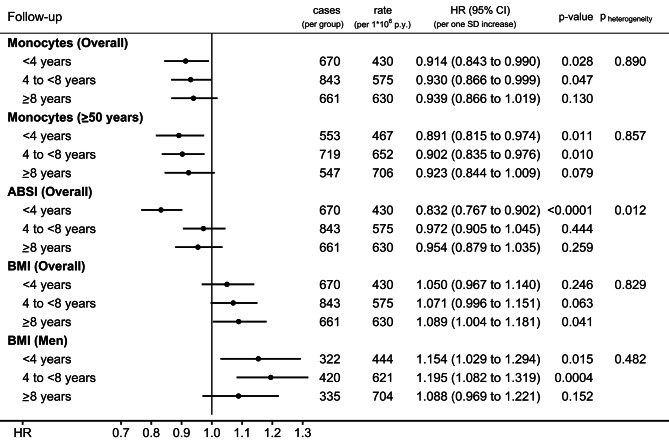
Results: During a mean follow-up of 10.2 years, 2174 CMM cases were ascertained in 398,450 participants. There was little evidence for associations with neutrophil or lymphocyte counts. Monocyte count, however, was associated inversely in participants overall (HR = 0.928; 95%CI: 0.888-0.971; per one standard deviation increase; SD = 0.144*109/L women; SD = 0.169*109/L men), specifically in older participants (HR = 0.906; 95%CI: 0.862-0.951), and more clearly in participants with low ABSI (HR = 0.880; 95%CI: 0.824-0.939), or with BMI ≥ 25 kg/m2 (HR = 0.895; 95%CI: 0.837-0.958 for overweight; HR = 0.923; 95%CI: 0.848-1.005 for obese). ABSI was associated inversely in pre-menopausal women (HR = 0.810; 95%CI: 0.702-0.935; SD = 4.95) and men (HR = 0.925; 95%CI: 0.867-0.986; SD = 4.11). BMI was associated positively in men (HR = 1.148; 95%CI: 1.078-1.222; SD = 4.04 kg/m2). There was little evidence for heterogeneity according to smoking status. The associations with monocyte count and BMI were retained to at least 8 years prior to diagnosis, but the association with ABSI was observed up to 4 years prior to diagnosis and not for longer follow-up time.

Conclusions: Monocyte count is associated prospectively inversely with the risk of developing CMM in older individuals, while BMI is associated positively in men, suggesting a mechanistic involvement of factors related to monocytes and subcutaneous adipose tissue in melanoma development. An inverse association with ABSI closer to diagnosis may reflect reverse causality or glucocorticoid resistance.

Keywords: ABSI; Abdominal obesity; BMI; Cutaneous malignant melanoma; Lymphocytes; Monocytes; Neutrophils; Obesity.


Conflict of interest statement

The authors declare no competing interests.

Figures

Fig. 1
Fig. 1
Prospective associations of neutrophil and lymphocyte counts with cutaneous malignant melanoma. CI – confidence interval; HR – hazard ratio; MP – menopause; p-value – Wald test for the individual term; SD – standard deviation. Model 1 – unstratified and unadjusted Cox proportional hazards model for participants overall, with exposure either neutrophil or lymphocyte count (sex-specific z-scores, value minus mean divided by SD), with mean (SD) for neutrophils: 4.186 (1.317) for women, 4.258 (1.355) for men; and mean (SD) for lymphocytes: 1.990 (0.587) for women, 1.865 (0.565) for men. Model 2 – like Model 1, stratified by age at recruitment, region, sex, and for analyses including women, menopausal status and hormone replacement therapy use, and adjusted for height (sex-specific z-scores), smoking status and intensity, alcohol consumption, Townsend deprivation index, family history of cancer, and use of antihypertensive drugs. Model 3 – like Model 2, additionally adjusted for sun-exposure-related factors (skin colour, ease of skin tanning, hair colour, childhood sunburns, solarium use, sun/UV protection, and time spent outdoors in summer). Model 4 – like Model 3, additionally adjusted for body mass index (BMI) and the allometric body shape index (ABSI) (sex-specific z-scores), used for all subgroup analyses. pheterogeneity – p-value obtained with the data augmentation method of Lunn and McNeil [16] for the comparison of HR estimates between the specified groups according to sex, menopausal status (women), and age (men)
Fig. 2
Fig. 2
Prospective associations of monocyte count with cutaneous malignant melanoma. ABSI – a body shape index; BMI – body mass index; cases – number of cutaneous malignant melanoma cases per group; CI – confidence interval; HR – hazard ratio; MP – menopause; NW – normal weight (BMI = 18.5 to < 25 kg/m2); OW – overweight (BMI = 25 to < 30 kg/m2); OB – obese (BMI = 30 to < 45 kg/m2); p-value – Wald test for the individual term; rate – number of cutaneous malignant melanoma cases per 1,000,000 person years of follow-up; SD – standard deviation. Model 1 – unstratified and unadjusted Cox proportional hazards model for participants overall with exposure monocyte count (sex-specific z-scores, value minus mean (0.436 for women; 0.513 for men) divided by SD (0.144 for women; 0.169 for men), unit *109/L). Model 2 – like Model 1, stratified by age at recruitment, region, sex, and for analyses including women, menopausal status and hormone replacement therapy use, and adjusted for height (sex-specific z-scores), smoking status and intensity, alcohol consumption, Townsend deprivation index, family history of cancer, and use of antihypertensive drugs. Model 3 – like Model 2, additionally adjusted for sun-exposure-related factors (skin colour, ease of skin tanning, hair colour, childhood sunburns, solarium use, sun/UV protection, and time spent outdoors in summer). Model 4 – like Model 3, additionally adjusted for BMI and ABSI (sex-specific z-scores), used for all subgroup analyses. pheterogeneity – p-value obtained with the data augmentation method of Lunn and McNeil [16] for the comparison of HR estimates between the specified groups according to sex, menopausal status (women), age (men and overall), smoking status, BMI (NW vs. OW/OB), and ABSI (dichotomised at the sex-specific median: ≥73.531 for women; ≥79.763 for men)
Fig. 3
Fig. 3
Prospective associations of obesity indices with cutaneous malignant melanoma. ABSI – a body shape index; BMI – body mass index; cases – number of cutaneous malignant melanoma cases per group; CI – confidence interval; HR – hazard ratio; MP – menopause; p-value – Wald test for the individual term; SD – standard deviation. Model 1 – unstratified and unadjusted Cox proportional hazards model for participants overall, including either ABSI or BMI as exposure (sex-specific z-scores, value minus mean divided by SD), with mean (SD) for ABSI: 73.779 (4.953) for women, 79.756 (4.107) for men; and mean (SD) for BMI: 26.917 (4.779) for women, 27.804 (4.037) for men (unit kg/m2). Model 2 – like Model 1, including jointly ABSI and BMI, stratified by age at recruitment, region, sex, and for analyses including women, menopausal status and hormone replacement therapy use, and adjusted for height (sex-specific z-scores), smoking status and intensity, alcohol consumption, Townsend deprivation index, family history of cancer, and use of antihypertensive drugs. Model 3 – like Model 2, additionally adjusted for sun-exposure-related factors (skin colour, ease of skin tanning, hair colour, childhood sunburns, solarium use, sun/UV protection, and time spent outdoors in summer). Model 4 – like Model 3, additionally adjusted for monocyte count (sex-specific z-scores), used for all subgroup analyses. pheterogeneity – p-value obtained with the data augmentation method of Lunn and McNeil [16] for the comparison of HR estimates between the specified groups according to sex, menopausal status (women), age (men), and smoking status. # – adjustment of BMI for smoking status and intensity alone made no material difference to association estimates (HR = 1.021; 95%CI = 0.978–1.065; p = 0.343)
Fig. 4
Fig. 4
Prospective associations of monocyte count and obesity indices with cutaneous malignant melanoma according to time to diagnosis. ABSI – a body shape index; BMI – body mass index; cases – number of cutaneous malignant melanoma cases; CI – confidence interval; rate – number of cutaneous malignant melanoma cases per 1,000,000 person years of follow-up within the corresponding period; HR – hazard ratio; Monocytes – monocyte count; p-value – Wald test for the individual term; SD – standard deviation. Cox proportional hazards models including jointly monocyte count, ABSI, and BMI as exposures (sex-specific z-scores, value minus mean divided by SD), with mean (SD) for monocyte count: 0.436 (0.144) for women, 0.513 (0.169) for men (unit *109/L); mean (SD) for ABSI: 73.779 (4.953) for women, 79.756 (4.107) for men; and mean (SD) for BMI: 26.917 (4.779) for women, 27.804 (4.037) for men (unit kg/m2). Cohort entry was considered the date at the beginning of the corresponding examined follow-up period and exit the earliest of the date at diagnosis of the first primary incident cancer, or death, or the end of the corresponding examined follow-up period, or the end of cancer follow-up (396,450 participants with follow-up < 4 years; 379,446 with follow-up 4 to < 8 years; 352,986 with follow-up ≥ 8 years). All models were stratified by age at recruitment, region, sex, and for analyses including women, menopausal status, and hormone replacement therapy use, and were adjusted for height (sex-specific z-scores), smoking status and intensity, alcohol consumption, Townsend deprivation index, family history of cancer, use of antihypertensive drugs, and sun-exposure-related factors (skin colour, ease of skin tanning, hair colour, childhood sunburns, solarium use, sun/UV protection, and time spent outdoors in summer). pheterogeneity – p-value obtained with the data augmentation method of Lunn and McNeil [16] for the comparison of HR estimates between the specified periods according to follow-up time

Similar articles

References

    1. Arnold M, Singh D, Laversanne M, Vignat J, Vaccarella S, Meheus F, et al. Global Burden of Cutaneous Melanoma in 2020 and projections to 2040. JAMA Dermatol. 2022;158(5):495–503. doi: 10.1001/jamadermatol.2022.0160. - DOI - PMC - PubMed
    1. Christakoudi S, Tsilidis KK, Evangelou E, Riboli E. A body shape index (ABSI), hip index, and risk of cancer in the UK Biobank cohort. Cancer Med. 2021;10(16):5614–28. doi: 10.1002/cam4.4097. - DOI - PMC - PubMed
    1. Krakauer NY, Krakauer JC. A new body shape index predicts Mortality Hazard independently of body Mass Index. PLoS ONE. 2012;7(7):e39504. doi: 10.1371/journal.pone.0039504. - DOI - PMC - PubMed
    1. Madelaine R, Ngo KJ, Skariah G, Mourrain P. Genetic deciphering of the antagonistic activities of the melanin-concentrating hormone and melanocortin pathways in skin pigmentation. PLoS Genet. 2020;16(12):e1009244. doi: 10.1371/journal.pgen.1009244. - DOI - PMC - PubMed
    1. Huszar D, Lynch CA, Fairchild-Huntress V, Dunmore JH, Fang Q, Berkemeier LR, et al. Targeted disruption of the melanocortin-4 receptor results in obesity in mice. Cell. 1997;88(1):131–41. doi: 10.1016/s0092-8674(00)81865-6. - DOI - PubMed

MeSH terms