. 2024 May 24;12(1):15.
doi: 10.1186/s40170-024-00343-5.

Disrupting Na+ ion homeostasis and Na+/K+ ATPase activity in breast cancer cells directly modulates glycolysis in vitro and in vivo

Affiliations

Disrupting Na+ ion homeostasis and Na+/K+ ATPase activity in breast cancer cells directly modulates glycolysis in vitro and in vivo

Aidan M Michaels et al. Cancer Metab. .

Abstract

Background: Glycolytic flux is regulated by the energy demands of the cell. Upregulated glycolysis in cancer cells may therefore result from increased demand for adenosine triphosphate (ATP), however it is unknown what this extra ATP turnover is used for. We hypothesise that an important contribution to the increased glycolytic flux in cancer cells results from the ATP demand of Na+/K+-ATPase (NKA) due to altered sodium ion homeostasis in cancer cells.

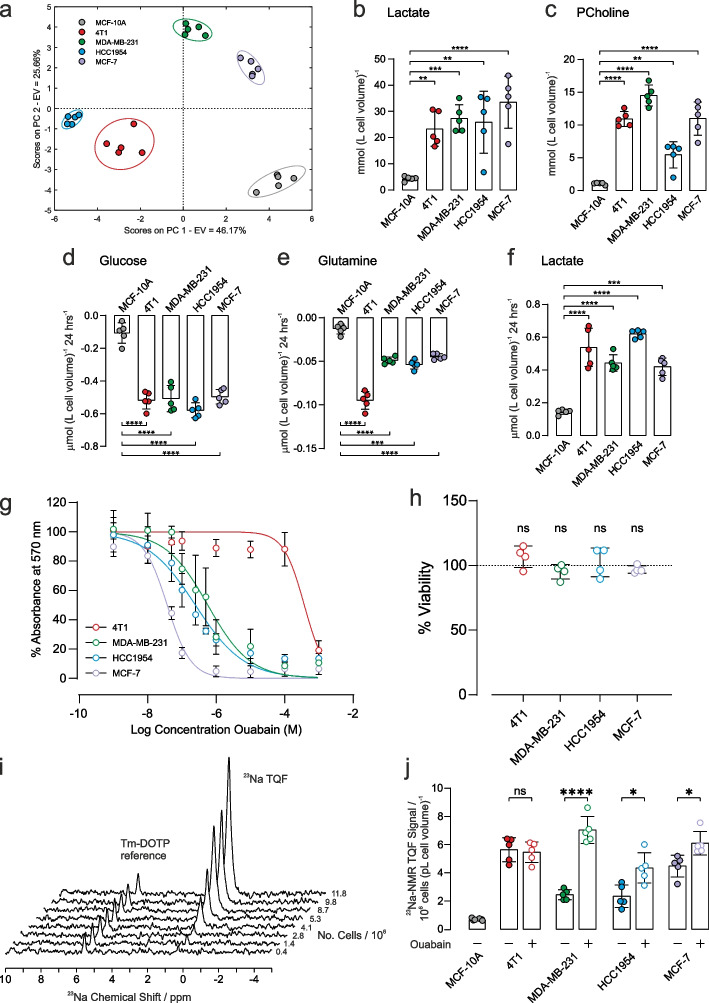
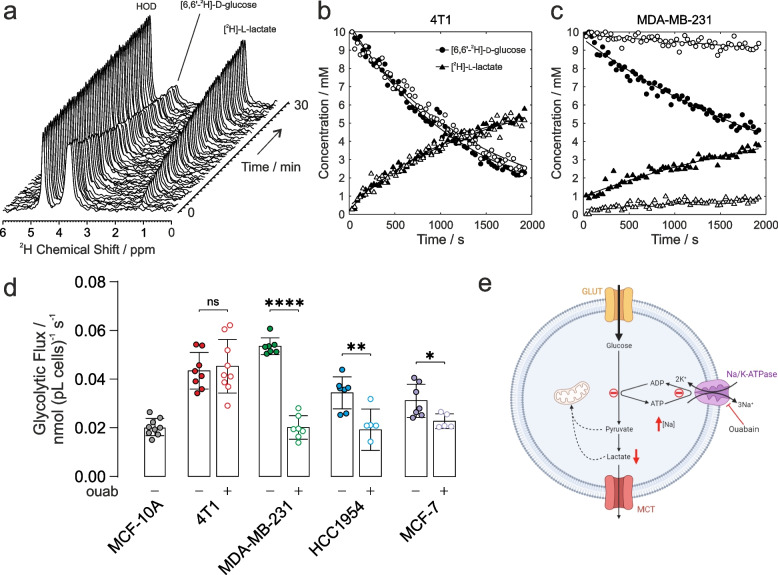
Methods: Live whole-cell measurements of intracellular sodium [Na+]i were performed in three human breast cancer cells (MDA-MB-231, HCC1954, MCF-7), in murine breast cancer cells (4T1), and control human epithelial cells MCF-10A using triple quantum filtered 23Na nuclear magnetic resonance (NMR) spectroscopy. Glycolytic flux was measured by 2H NMR to monitor conversion of [6,6-2H2]D-glucose to [2H]-labelled L-lactate at baseline and in response to NKA inhibition with ouabain. Intracellular [Na+]i was titrated using isotonic buffers with varying [Na+] and [K+] and introducing an artificial Na+ plasma membrane leak using the ionophore gramicidin-A. Experiments were carried out in parallel with cell viability assays, 1H NMR metabolomics of intracellular and extracellular metabolites, extracellular flux analyses and in vivo measurements in a MDA-MB-231 human-xenograft mouse model using 2-deoxy-2-[18F]fluoroglucose (18F-FDG) positron emission tomography (PET).

Results: Intracellular [Na+]i was elevated in human and murine breast cancer cells compared to control MCF-10A cells. Acute inhibition of NKA by ouabain resulted in elevated [Na+]i and inhibition of glycolytic flux in all three human cancer cells which are ouabain sensitive, but not in the murine cells which are ouabain resistant. Permeabilization of cell membranes with gramicidin-A led to a titratable increase of [Na+]i in MDA-MB-231 and 4T1 cells and a Na+-dependent increase in glycolytic flux. This was attenuated with ouabain in the human cells but not in the murine cells. 18FDG PET imaging in an MDA-MB-231 human-xenograft mouse model recorded lower 18FDG tumour uptake when treated with ouabain while murine tissue uptake was unaffected.

Conclusions: Glycolytic flux correlates with Na+-driven NKA activity in breast cancer cells, providing evidence for the 'centrality of the [Na+]i-NKA nexus' in the mechanistic basis of the Warburg effect.

Keywords: Breast cancer; Glycolysis; Intracellular sodium; NaK ATPase; Ouabain; Warburg effect.


Conflict of interest statement

The authors declare no competing interests.

Figures

Fig. 1
Fig. 1
Metabolic characterization and response to ouabain treatment on [Na+]i. a Principal component analysis of intracellular metabolites (mean values given in Supplementary Table S2). Intracellular concentrations of b lactate (left panel) and c phosphocholine (right panel) were significantly higher in all cancer cells with respect to control epithelial cells (n = 5). Extracellular metabolite concentrations of d glucose, e glutamine and f lactate after 24 h cell culture. Respective metabolite concentration from fresh media were subtracted such that negative concentrations refer to metabolite consumption while positive concentrations refer to production (n = 5). g MTT cytotoxicity assay dose response curves following 24 h treatment with ouabain. Measured EC50 values were: 4T1: 40 µM, MDA-MB-231: 0.4 µM, HCC1954: 0.2 µM, MCF-7: 0.04 µM. h Cell viability in response to 1 µM ouabain for 1 h measured by trypan blue exclusion assay measured no change in cell viability. i Representative TQF 23Na NMR spectra showing proportionality with cell number. The Tm-DOTP reference peak is from the internal standard. j Quantification of TQF 23Na NMR relative to cell number and cell volume. Baseline [Na+]i was higher in all cancer cells with respect to control epithelial cells (n = 5). Treatment with 1 µM ouabain for 1 h led to a significant increase in [Na+]i in all human cancer cell lines compared to vehicle control (n = 5). [Na+]i was unchanged in the murine 4T1 cell line following 1 h treatment with 1 µM ouabain, (p = 0.7, n = 5). Significance was assessed using a two-tailed unpaired t-test, ns p > 0.05, * p < 0.05, ** p < 0.01, *** p < 0.001, **** p < 0.0001. Data plotted as mean ± SD
Fig. 2
Fig. 2
Extracellular acidification rate with NKA inhibition. a Seahorse XFe24 glycolytic stress test of extracellular change in pH for the MDA-MB-231 cancer cells (± SEM representing biological reproducibility of n = 3 biological repeats where each n = 3 technical repeats were first averaged). Complete time courses for the other cell lines are given in Supplementary Fig. S8. The stress test comprised 10 mM glucose, 1 μM oligomycin, and 100 mM 2-deoxy-D-glucose indicated by arrows. b Oxygen consumption rate (OCR) measured simultaneously with the ECAR data in panel a. c Plot of the measured ECAR glycolytic rate vs OCR during the 10 mM glucose time window defined in Supplementary Fig. S6 (n = 3 biological repeats each with n = 3 technical repeats) showing a reduction in glycolytic rate and no change in OCR. Quantified extracellular acidification rate corresponding to glycolytic rates during the 10 mM glucose time window (left panels) and their corresponding OCR (right panels), in control and ouabain treated cells: d 4T1: ECAR (p = 0.24), OCR (p = 0.39); e MDA-MB-231: ECAR decreased by 52% (p = 0.006), OCR (p = 0.40); f HCC1954: ECAR decreased by 21% (p = 0.08), OCR (p = 0.66); g MCF-7: ECAR decreased by 38% (p = 0.015), OCR (p = 0.16). n = 3 biological repeats each with n = 3 technical repeats, significance was assessed using a nested unpaired t-test. ns p > 0.05, * p < 0.05, ** p < 0.01
Fig. 3
Fig. 3
Glycolytic flux measured with 2H-NMR. a Time-series of 2H-NMR spectra showing metabolism of [6,6-2H2]d-glucose to [3,3-2H2]l-lactate by 4T1 cells in suspension. No 2H label was lost to HOD, serving as an internal chemical shift and intensity standard at 16.7 mM. Time course and empirical fits performed in Matlab of the normalized peak integrals of the [6,6-2H2]d-glucose and [3,3-2H2]l-lactate spectral peaks: b 4T1 cells and c MDA-MB-231 cells for vehicle control (filled symbols) and ouabain treated (open symbols). d Quantified glycolytic flux in MCF-10A cells was 0.020 ± 0.003 nmol (pL cells)−1 s−1 (n = 9). 4T1 cells had a higher baseline glycolytic rate of 0.043 ± 0.007 nmol (pL cells)−1 s−1 (n = 8) and unchanged rate after ouabain treatment, 0.045 ± 0.010 nmol (pL cells)−1 s−1 (n = 9, p = 0.6949). Human breast cancer cells all showed higher baseline glycolytic rates than control epithelial cells, MDA-MB-231: 0.054 ± 0.003 nmol (pL cells)−1 s−1 (n = 7); HCC1954: 0.034 ± 0.006 nmol (pL cells)−1 s−1 (n = 7); MCF-7: 0.031 ± 0.006 nmol (pL cells)−1 s−1 (n = 7). Human cells showed a decreased glycolytic rate following ouabain-treatment vs vehicle control, MDA-MB-231: 0.020 ± 0.004 nmol (pL cells)−1 s−1 (n = 7; p < 0.0001); HCC1954: 0.019 ± 0.008 nmol (pL cells)−1 s−1 (n = 6; p = 0.004); MCF-7: 0.023 ± 0.003 nmol (pL cells)−1 s−1 (n = 5; p = 0.029). e Schematic of the proposed mechanism of the effect of ouabain inhibition of NKA on glycolytic flux (Figure created using BioRender.com). ns p > 0.05, * p < 0.05, ** p < 0.01, **** p < 0.0001. Data plotted as mean ± SD
Fig. 4
Fig. 4
Glycolytic flux affected by intracellular [Na]i and NKA function. a Schematic of the proposed mechanism of the effect of gramicidin-A on [Na+]i and glycolysis. Gramicidin introduces an artificial Na+ leak, increasing [Na+]i and glycolytic metabolism (Figure created using BioRender.com). b 23Na TQF spectra showing the intracellular [Na+]i peak relative to a reference capillary in MDA-MB-231 cells following membrane permeabilization with gramicidin and varying concentrations of titrated extracellular [Na+]e. c Quantification of TQF 23Na NMR spectra (proportional to [Na+]i) following exposure to isotonic solutions of titrated [Na+]e (n = 4), for 4T1 cells and MDA-MB-231 cells. d Quantification of glycolytic fluxes measured by the rate of [6,6-2H2]d-glucose to [3,3-2H2]l-lactate conversion at different concentrations of titrated [Na+]i in murine 4T1 and human MDA-MB-231 breast cancer cells (n = 4). e Glycolytic fluxes in panel d replotted as a function of pump current derived from the analytical expression given by Silverman et al. [43] f Glycolytic flux measured at the highest concentration of 70 mM [Na+]e following treatment with 1 µM ouabain treatment was not significantly altered in murine 4T1 cells but was significantly decreased in human MDA-MB-231 cells. ns p > 0.05, **** p < 0.0001. Data plotted as mean ± SD
Fig. 5
Fig. 5
Ouabain decreases 18F-FDG uptake in MDA-MB-231 tumour xenografts. Representative images of the biodistribution of 18F-FDG in a vehicle and b ouabain treated tumours acquired at 60 min scan time. The tumour and organs of interest are denoted by dotted circles, where T = tumour; K = kidney, M = myocardium, B = bladder. c The pharmacokinetics of 18F-FDG uptake were determined via the time-activity curves. A decreased avidity for 18F-FDG was observed in tumours following treatment with ouabain (6.75 µM final blood concentration). At 50 min post 18F-FDG injection, uptake was significantly lower in ouabain treated tumours 5.0 ± 0.6%ID/g (n = 5) compared to control tumours 6.7 ± 1.6%ID/g (n = 7), *p < 0.05, two-way ANOVA with Šidák’s multiple comparisons. d The area under the curve (AUC) derived from the time-activity curves at 40–60 min post injection of 18F-FDG revealed a significant decrease in the uptake of 18F-FDG in ouabain treated, AUC40-60 min = 100 ± 12 (n = 5) versus vehicle controls, AUC40-60 min = 130 ± 40 (n = 7), *p < 0.05, two-tailed unpaired t-test. Data plotted as mean ± SD

Similar articles

Cited by

References

    1. Warburg O, Wind F, Negelein E. The metabolism of tumors in the body. J Gen Physiol. 1927;8(6):519–530. doi: 10.1085/jgp.8.6.519. - DOI - PMC - PubMed
    1. Warburg O. On the origin of cancer cells. Science. 1956;123(3191):309–314. doi: 10.1126/science.123.3191.309. - DOI - PubMed
    1. Warburg O. Über den Stoffwechsel der Carcinomzelle. Naturwissenschaften. 1924;12(50):1131–1137. doi: 10.1007/BF01504608. - DOI
    1. Vyas S, Zaganjor E, Haigis MC. Mitochondria and cancer. Cell. 2016;166(3):555–566. doi: 10.1016/j.cell.2016.07.002. - DOI - PMC - PubMed
    1. Schell JC, Olson KA, Jiang L, Hawkins AJ, Van Vranken JG, Xie J, et al. A role for the mitochondrial pyruvate carrier as a repressor of the Warburg effect and colon cancer cell growth. Mol Cell. 2014;56(3):400–413. doi: 10.1016/j.molcel.2014.09.026. - DOI - PMC - PubMed

LinkOut - more resources