

Infant growth by INTERGROWTH-21st and Fenton Growth Charts: Predicting 1-year anthropometry in South African preterm infants
- PMID: 38783411
- PMCID: PMC11574635
- DOI: 10.1111/mcn.13663
Infant growth by INTERGROWTH-21st and Fenton Growth Charts: Predicting 1-year anthropometry in South African preterm infants
Abstract
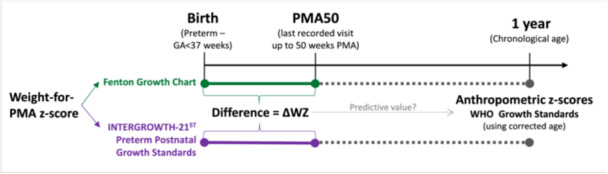
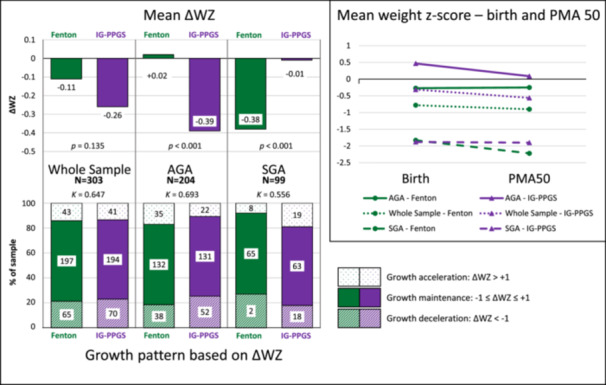
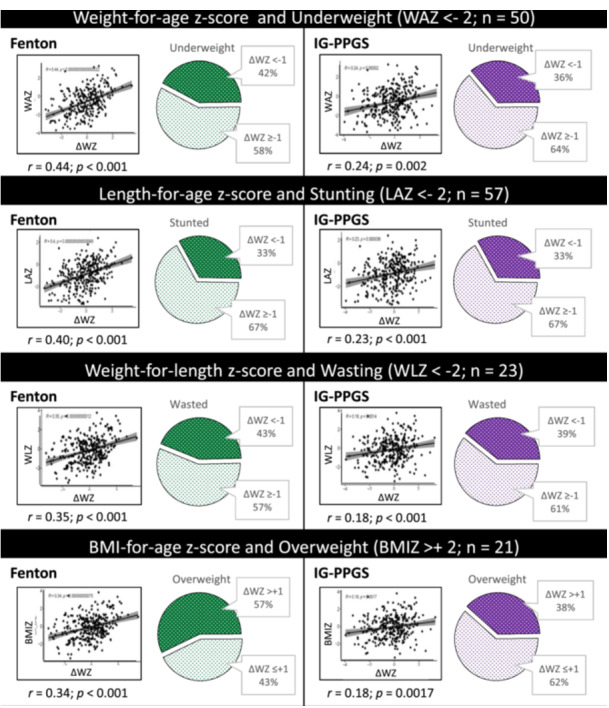
Post-natal growth influences short- and long-term preterm infant outcomes. Different growth charts, such as the Fenton Growth Chart (FGC) and INTERGROWTH-21st Preterm Post-natal Growth Standards (IG-PPGS), describe different growth curves and targets. This study compares FGC- and IG-PPGS-derived weight-for-postmenstrual age z-score (WZ) up to 50 weeks postmenstrual age (PMA50) for predicting 1-year anthropometry in 321 South African preterm infants. The change in WZ from birth to PMA50 (ΔWZ, calculated using FGC and IG-PPGS) was correlated to age-corrected 1-year anthropometric z-scores for weight-for-age (WAZ), length-for-age (LAZ), weight-for-length (WLZ) and BMI-for-age (BMIZ), and categorically compared with rates of underweight (WAZ < -2), stunting (LAZ < -2), wasting (WLZ < -2) and overweight (BMIZ > + 2). Multivariable analyses explored the effects of other early-life exposures on malnutrition risk. At PMA50, mean WZ was significantly higher on IG-PPGS (-0.56 ± 1.52) than FGC (-0.90 ± 1.52; p < 0.001), but ΔWZ was similar (IG-PPGS -0.26 ± 1.23, FGC -0.11 ± 1.14; p = 0.153). Statistically significant ΔWZ differences emerged among small-for-gestational age infants (FGC -0.38 ± 1.22 vs. IG-PPGS -0.01 ± 1.30; p < 0.001) and appropriate-for-gestational age infants (FGC + 0.02 ± 1.08, IG-PPGS -0.39 ± 1.18; p < 0.001). Correlation coefficients of ΔWZ with WAZ, LAZ, WLZ and BMIZ were low (r < 0.45), though higher for FGC than IG-PPGS. Compared with IG-PPGS, ΔWZ < -1 on FGC predicted larger percentages of underweight (42% vs. 36%) and wasting (43% vs. 39%) and equal percentages of stunting (33%), while ΔWZ > + 1 predicted larger percentages overweight (57% vs. 38%). Both charts performed similarly in multivariable analysis. Differences between FGC and IG-PPGS are less apparent when considering ΔWZ, highlighting the importance of assessing growth as change over time, irrespective of growth chart.
Keywords: (MeSH terms) Infant; birthweight; growth; growth charts; malnutrition; premature; weight gain.
© 2024 The Authors. Maternal & Child Nutrition published by John Wiley & Sons Ltd.
Conflict of interest statement
The authors declare no conflict of interest.
Figures
Similar articles
-
One-year anthropometric follow-up of South African preterm infants in kangaroo mother care: Which early-life factors predict malnutrition?Trop Med Int Health. 2024 Apr;29(4):292-302. doi: 10.1111/tmi.13973. Epub 2024 Feb 8. Trop Med Int Health. 2024. PMID: 38327260
-
Is the Intrauterine INTERGROWTH-21 Growth Curve Better Than Fenton's for the Classification at Birth and Prediction of Postnatal Growth in Preterm Infants?Matern Child Health J. 2020 Dec;24(12):1446-1453. doi: 10.1007/s10995-020-02988-2. Matern Child Health J. 2020. PMID: 32740751
-
The contribution of preterm birth and intrauterine growth restriction to childhood undernutrition in Tanzania.Matern Child Nutr. 2015 Oct;11(4):618-30. doi: 10.1111/mcn.12123. Epub 2014 Apr 10. Matern Child Nutr. 2015. PMID: 24720471 Free PMC article.
-
Critical appraisal of different anthropometric charts to evaluate postnatal growth of preterm infants.J Biol Regul Homeost Agents. 2012 Jul-Sep;26(3 Suppl):5-7. J Biol Regul Homeost Agents. 2012. PMID: 23158506 Review.
-
The INTERGROWTH-21st fetal growth standards: toward the global integration of pregnancy and pediatric care.Am J Obstet Gynecol. 2018 Feb;218(2S):S630-S640. doi: 10.1016/j.ajog.2018.01.011. Am J Obstet Gynecol. 2018. PMID: 29422205 Review.
References
-
- Altman, D. (1990). Practical statistics for medical research. Chapman and Hall/CRC.
-
- Ashorn, P. , Ashorn, U. , Muthiani, Y. , Aboubaker, S. , Askari, S. , Bahl, R. , Black, R. E. , Dalmiya, N. , Duggan, C. P. , Hofmeyr, G. J. , Kennedy, S. H. , Klein, N. , Lawn, J. E. , Shiffman, J. , Simon, J. , Temmerman, M. , Okwaraji, Y. , Krasevec, J. , Bradley, E. , … Hayashi, C. (2023). Small vulnerable newborns—Big potential for impact. The Lancet, 401(10389), 1692–1706. 10.1016/S0140-6736(23)00354-9 - DOI - PubMed
-
- Barreto, C. M. , Pereira, M. A. L. , Rolim, A. C. B. , Abbas, S. A. , Langhi Junior, D. M. , & Santos, A. M. N. (2021). Incidence of small for gestational age neonates, according to the Fenton and INTERGROWTH‐21st curves in a level II maternity. Revista Paulista de Pediatria, 39, 39. 10.1590/1984-0462/2021/39/2019245 - DOI - PMC - PubMed
MeSH terms
LinkOut - more resources
Full Text Sources
Medical
