. 2024 Nov 13;65(10):1674-1688.
doi: 10.1093/pcp/pcae056.

Mechanistic Insights into the Function of 14-3-3 Proteins as Negative Regulators of Brassinosteroid Signaling in Arabidopsis

Affiliations

Mechanistic Insights into the Function of 14-3-3 Proteins as Negative Regulators of Brassinosteroid Signaling in Arabidopsis

Elsa Obergfell et al. Plant Cell Physiol. .

Abstract

Brassinosteroids (BRs) are vital plant steroid hormones sensed at the cell surface by a membrane signaling complex comprising the receptor kinase BRI1 and a SERK family co-receptor kinase. Activation of this complex lead to dissociation of the inhibitor protein BKI1 from the receptor and to differential phosphorylation of BZR1/BES1 transcription factors by the glycogen synthase kinase 3 protein BIN2. Many phosphoproteins of the BR signaling pathway, including BRI1, SERKs, BKI1 and BZR1/BES1 can associate with 14-3-3 proteins. In this study, we use quantitative ligand binding assays to define the minimal 14-3-3 binding sites in the N-terminal lobe of the BRI1 kinase domain, in BKI1, and in BZR1 from Arabidopsis thaliana. All three motifs require to be phosphorylated to specifically bind 14-3-3s with mid- to low-micromolar affinity. BR signaling components display minimal isoform preference within the 14-3-3 non-ε subgroup. 14-3-3λ and 14-3-3 ω isoform complex crystal structures reveal that BKI1 and BZR1 bind as canonical type II 14-3-3 linear motifs. Disruption of key amino acids in the phosphopeptide binding site through mutation impairs the interaction of 14-3-3λ with all three linear motifs. Notably, quadruple loss-of-function mutants from the non-ε group exhibit gain-of-function BR signaling phenotypes, suggesting a role for 14-3-3 proteins as overall negative regulators of the BR pathway. Collectively, our work provides further mechanistic and genetic evidence for the regulatory role of 14-3-3 proteins at various stages of the BR signaling cascade.

Keywords: 14-3-3 proteins; Protein X-ray crystallography; Protein kinase; Receptor kinase; brassinosteroids; phosphopeptide.


Figures

Fig. 1
Fig. 1
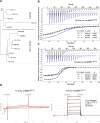
Short linear motifs in BRI1, BKI1 and BZR1 represent 14-3-3 binding sites. (A) In vitro transphosphorylation assay of BRI1 versus BSK1, with an autoradiograph shown on top and a Coomassie-stained SDS-PAGE gel shown below. A maltose-binding protein (MBP) fusion protein of the wild-type BRI1 cytoplasmic domain (residues 814–1196) can efficiently trans-phosphorylate a BSK1 fragment covering residues 55–512. BSK1 phosphorylation by BRI1 mainly involves BSK1 Ser230, as previously shown (Tang et al. 2011). (B) Isothermal titration calorimetry of 14-3-3κ versus a phosphorylated short linear motif located in the N-lobe of the BRI1 kinase domain (pBRI1869−874, continuous line). Shown are integrated heat peaks (upper panel) versus time and fitted binding isotherms versus molar ratio of peptide ligand (lower panel). No binding was detected for the unphosphorylated peptide (dotted line; n.d. no detectable binding). Table summaries for dissociation constants (KD) and binding stoichiometries (N) are shown (±fitting error). (C) Location of the 14-3-3 binding motif in the BRI1 kinase domain structure. Shown is a ribbon diagram of the N-lobe of the cytoplasmic kinase domain of BRI1 (in blue, PDB-ID 5lpb, residues 869–934) (Bojar et al. 2014), and the identified 14-3-3 binding motif (in yellow, residues 869–874) harboring phosphothreonine 872 (in bonds representation). (D) Table summaries of all ITC experiments performed with the 14-3-3κ isoform. Shown are dissociation constants (KD), binding enthalpy (ΔH) and entropy (ΔS). All binding stoichiometries were 2:2 with N ∼ 1. Experiments were repeated at least twice. (E) ITC experiments performed for 14-3-3κ versus the short linear motif in BKI1 (residues 265–272), plotted as in (B). (F) ITC experiments for 14-3-3κ versus the short (residues 169–175, continuous line) and extended (residues 169–184, dashed line) linear motifs in BZR1. No binding was observed for the unphosphorylated peptide (dotted line). (G) Relative positions of the 14-3-3 binding site (in yellow), the BIN2 interacting motif (in magenta) and the bzr1-D missense mutation (Pro234→Leu) (Wang et al. 2002) mapped onto a BZR1 AlphaFold (Jumper et al. 2021) model (https://search.foldseek.com with ID Q8S307). The experimental BZR1 DNA binding motif–DNA complex structure (PDB-ID 5zd4) (Nosaki et al. 2018) is shown as a structural superposition (blue ribbon diagram).
Fig. 2
Fig. 2
BR signaling components show no 14-3-3 isoform preference. (A) Phylogenetic tree of the 13 14-3-3 isoforms annotated in the Arabidopsis genome. The κ, λ and ω isoforms from the non-ε group used for biochemical and crystallographic experiments are highlighted in bold face. A dotted line separates the ε from the non-ε group. The tree was calculated with phyml (Guindon et al. 2010) from a multiple protein sequence alignment of all At14-3-3 isforms generated with MUSCLE (Edgar 2004) and plotted with the program NjPlot (Perrière and Thioulouse 1996). (B) Isothermal titration calorimetry of 14-3-3κ (continuous line), 14-3-3λ (dotted line) and 14-3-3 ω (blue line) versus the BKI1 minimal binding motif (residues 265–272). Shown are integrated heat peaks (upper panel) versus time and fitted binding isotherms versus molar ratio of peptide ligand (lower panel). Table summaries for dissociation constants (KD) and binding stoichiometries (N) are shown (±fitting error). (C) Binding of 14-3-3κ, 14-3-3λ and 14-3-3 ω to the minimal motif in BZR1 (residues 169–175, plotted as in (B)). (D) Grating coupled interferometry (GCI) binding kinetics of 14-3-3 ω versus BZR169−175. Shown are sensorgrams with raw data in red and their respective fits in black. Binding kinetics were analyzed by a 1-to-1 (2:2) binding model. Table summaries of kinetic parameters are shown alongside (ka, association rate constant; kd, dissociation rate constant; KD, dissociation constant).
Fig. 3
Fig. 3
Crystal structures of 14-3-3λ and 14-3-3 ω reveal type II motif binding modes for pBKI1 and pBZR1. (A) Front and rotated side view of a structural superposition of the 14-3-3λ and 14-3-3 ω homodimers, each bound to two pBZR1169−175 peptides. The two molecules (shown as Cα traces) forming the λ isoform dimer are colored in blue and orange, respectively, the 14-3-3 ω superimposes with an r.m.s.d. (root mean square deviation) of ∼1.6 Å comparing 485 corresponding Cα atoms (in gray). The pBZR1 peptides in the λ isoform are shown alongside (in bonds representation). (B) Size-exclusion chromatography coupled to right-angle light scattering (SEC-RALS) raw scattering trace of the apo 14-3-3 ω isoform (in green) and including the derived molecular masses (light green) of the homodimer. Table summaries report the observed molecular weight (MW), column retention volume (RV) and the dispersity (Mw/Mn). The calculated theoretical molecular weight for At14-3-3 ω is ∼58.3 kDa. (C) View of the 14-3-3 ω dimer interface (blue and orange ribbon diagrams) containing the previously reported Ser62 (in bonds representation), phosphorylation of which controls dimer-to-monomer transitions in Arabidopsis (Denison et al. 2014). Gray lines indicate potential steric clashes of the phosphorylated amino acid side chain with the α1-α2 loop in each protomer. (D) Structure of the pBKI1265−272 peptide (in yellow, in bonds representation) bound to 14-3-3λ with the final (2Fo—Fc) map contoured at 1.2σ. (E) Structure of pBZR1169−175 bound to 14-3-3 ω with the final (2Fo—Fc) map contoured at 1.5σ. (F) Structural superposition of pBZR1169−175 bound to 14-3-3λ (in gray, in bonds representation) or to 14-3-3 ω (in yellow). The 14-3-3λ and 14-3-3 ω isoform dimers superimpose with a r.m.s.d. of ∼0.7 Å comparing 402 corresponding Cα atoms. (G) Structural superposition of all pBKI1265−272 peptides bound to the 10 14-3-3ω molecules in the asymmetric unit with a r.m.s.d. of ∼0.5 Å over all atoms. Shown is a molecular surface view of the 14-3-3ω ligand binding site (in gray) with the pBKI1 peptides colored from yellow to green (in bonds representation). (H) Structural superposition of the different pBZR1 peptides in the 14-3-3ω—pBZR1169−175 complex (colors as in panel G). (I) Structural superposition of the 14-3-3ω pBKI1267−272 (in yellow, in bonds representation) and the Hs14-3-3ζ–type II peptide motif complex (in purple) from a synthetic library (PDB-ID 1qja, r.m.s.d is ∼0.5 Å comparing 195 corresponding Cα atoms. (Rittinger et al. 1999). (J) The same comparison as in (I) for the pBZR1169−172 peptide.
Fig. 4
Fig. 4
Mutations in the 14-3-3λ ligand binding site interfere with pBKI1, pBZR1 and pBRI1 binding. (A) Close-up view of pBZR1 (in yellow, in bonds representation) and pBKI1 (in gray) in the 14-3-3 binding groove. The side chains of Arg136, Tyr137 and Asn233 are shown as ball-and-stick models, dashed lines indicate hydrogen bonds (in gray, distance cutoff 3.0 Å). (B) Isothermal titration calorimetry of the 14-3-3λ Asn233→ Ala mutant versus pBKI1265−272 (continuous line), pBZR1169−175 (dashed line) and pBRI1869−874 (continuous blue line). Shown are integrated heat peaks (upper panel) versus time and fitted binding isotherms versus molar ratio of peptide ligand (lower panel). Table summaries for dissociation constants (KD) and binding stoichiometries (N) are shown alongside (±fitting error). (C) ITC analysis of the 14-3-3λ Arg136→ Leu/Tyr137 → Phe double mutant. Labels and colors as in panel B. (D) Analytical size exclusion chromatography of the 14-3-3λR136L/Y137F mutant. A Coomassie-stained SDS-PAGE of the homodimeric peak fractions is shown below.
Fig. 5
Fig. 5
14-3-3 Knock-out mutants from the non-ε group show BR gain-of-function phenotypes. (A) Hypocotyl growth assay of dark grown seedlings in the presence and absence of the BR biosynthesis inhibitor brassinazole (BRZ). Shown are the growth phenotypes of different non-ε group 14-3-3 loss-of-function double- and quadruple-mutant combinations compared to the Col-0 wild type, the weak receptor mutant bri1-301 (Xu et al. 2008, Sun et al. 2017, Zhang et al. 2018) and the gain-of-function allele bir3–2 (Imkampe et al. 2017) (scale bar = 0.5 cm). Shown below is the quantification of the data with relative inhibition plotted together with lower and upper confidence intervals. For each sample (genotype and treated or untreated), n = 50 biologically independent hypocotyls, from five different ½MS plates, were measured. (B) Box plots of the experiment shown in A with raw data depicted as individual dots. Untreated samples are shown in black, BRZ-treated sample in blue.

Similar articles

Cited by

References

    1. Adams P.D., Afonine P.V., Bunkóczi G., Chen V.B., Davis I.W., Echols N., et al. (2010) PHENIX: a comprehensive Python-based system for macromolecular structure solution. Acta Crystallogr. D Biol. Crystallogr. 66: 213–221. - PMC - PubMed
    1. Afonine P.V., Grosse-Kunstleve R.W., Echols N., Headd J.J., Moriarty N.W., Mustyakimov M., et al. (2012) Towards automated crystallographic structure refinement with phenix.refine. Acta Cryst. D 68: 352–367. - PMC - PubMed
    1. Amorim-Silva V., García-Moreno Á., Castillo A.G., Lakhssassi N., Esteban Del Valle A., Pérez-Sancho J., et al. (2019) TTL proteins scaffold brassinosteroid signaling components at the plasma membrane to optimize signal transduction in Arabidopsis. Plant Cell 31: 1807–1828. - PMC - PubMed
    1. Asami T., Min Y.K., Nagata N., Yamagishi K., Takatsuto S., Fujioka S., et al. (2000) Characterization of brassinazole, a triazole-type brassinosteroid biosynthesis inhibitor. Plant Physiol. 123: 93–100. - PMC - PubMed
    1. Bai M.-Y., Zhang L.-Y., Gampala S.S., Zhu S.-W., Song W.-Y., Chong K., et al. (2007) Functions of OsBZR1 and 14-3-3 proteins in brassinosteroid signaling in rice. Proc. Natl. Acad. Sci. U.S.A. 104: 13839–13844. - PMC - PubMed

LinkOut - more resources