. 2024 May 9:17:1381534.
doi: 10.3389/fnmol.2024.1381534. eCollection 2024.

Mapping proteomic composition of excitatory postsynaptic sites in the cerebellar cortex

Affiliations

Mapping proteomic composition of excitatory postsynaptic sites in the cerebellar cortex

Kaylie Robinson et al. Front Mol Neurosci. .

Abstract

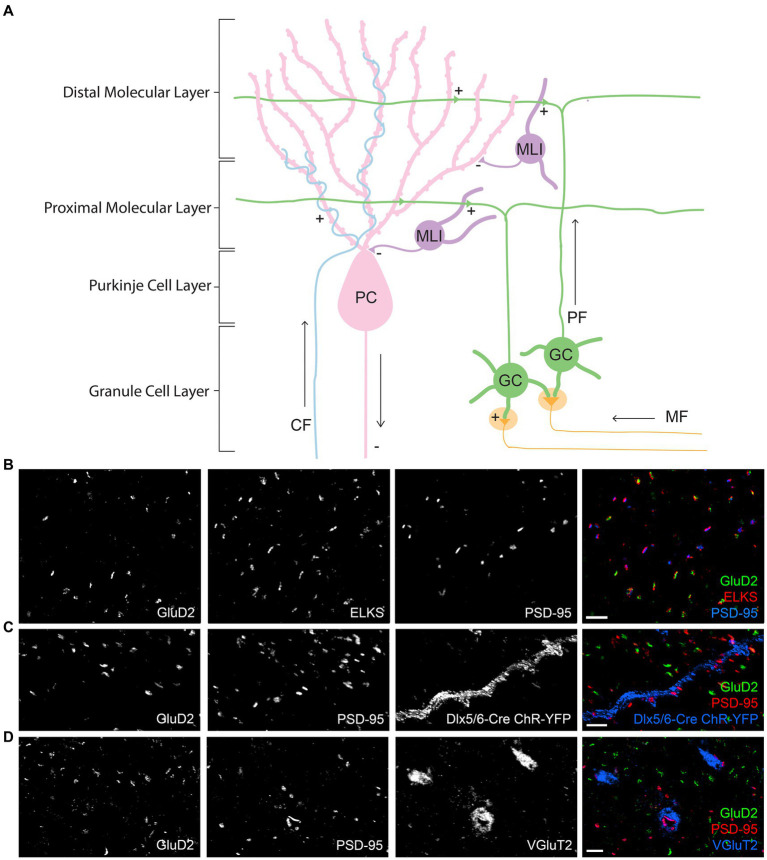
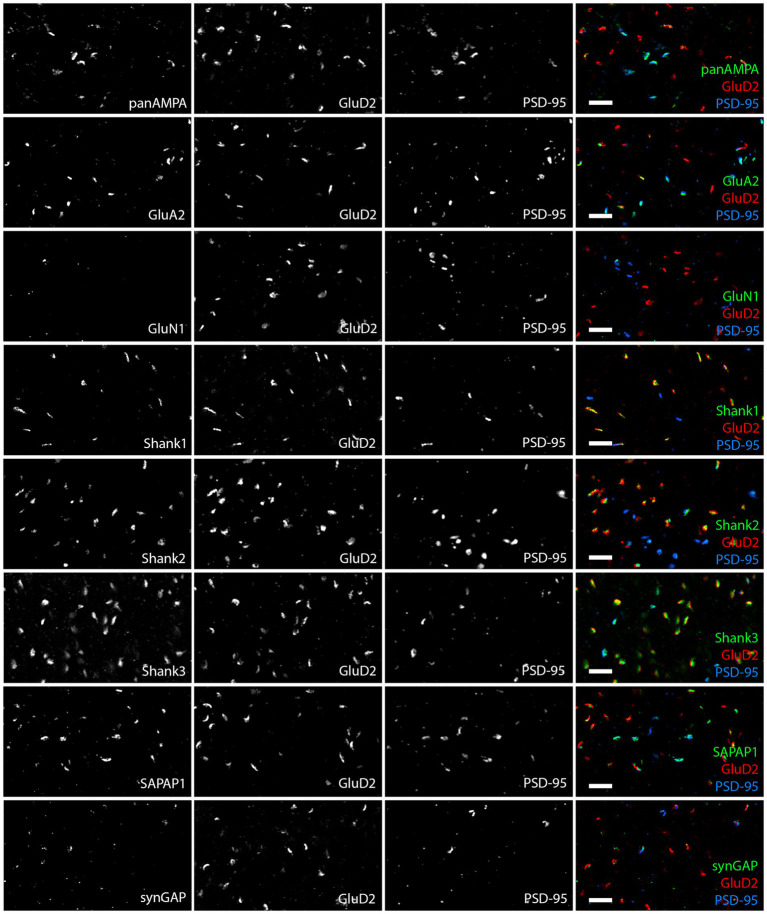
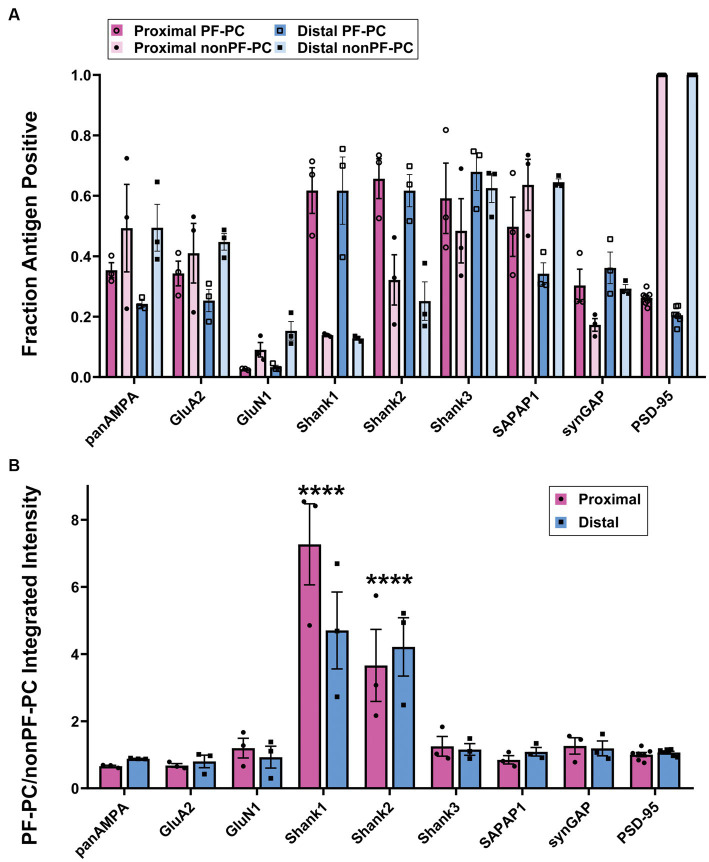
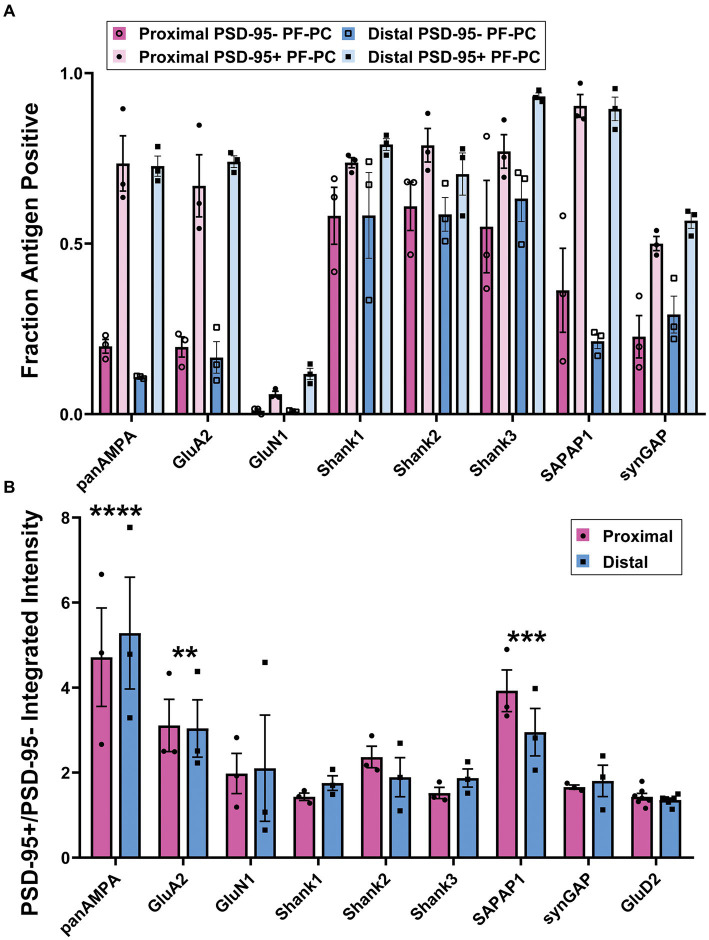
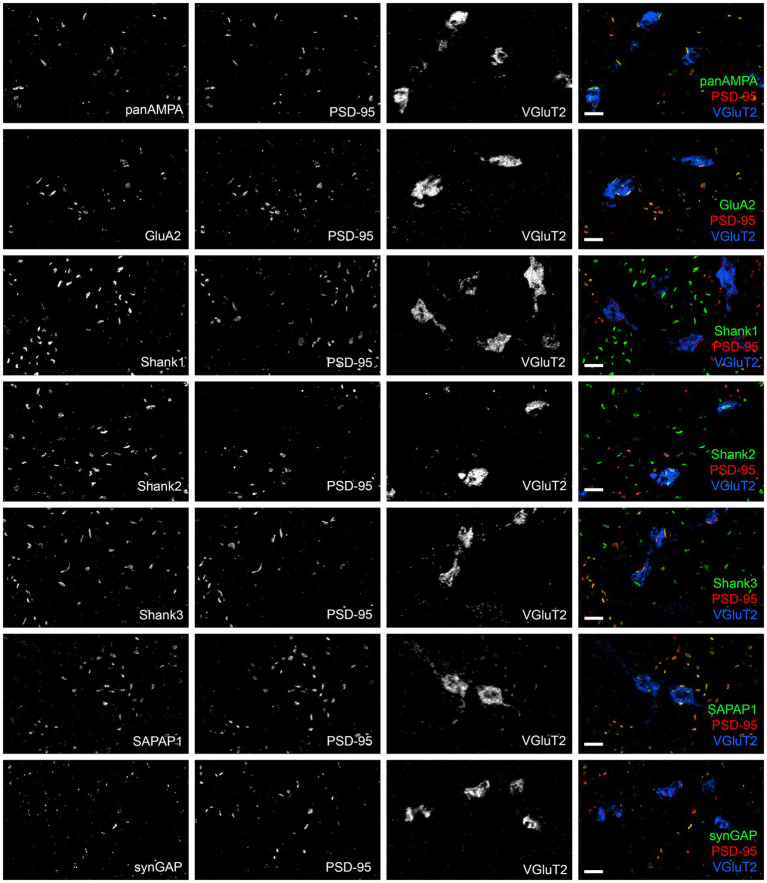
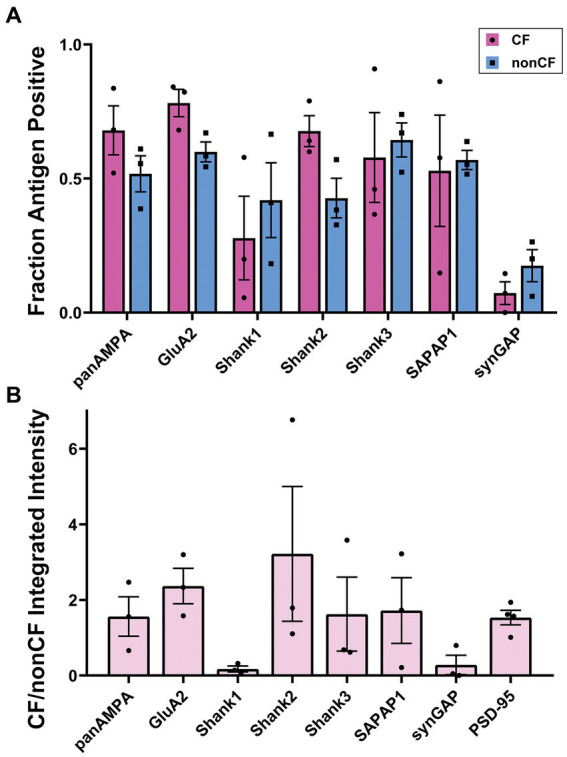
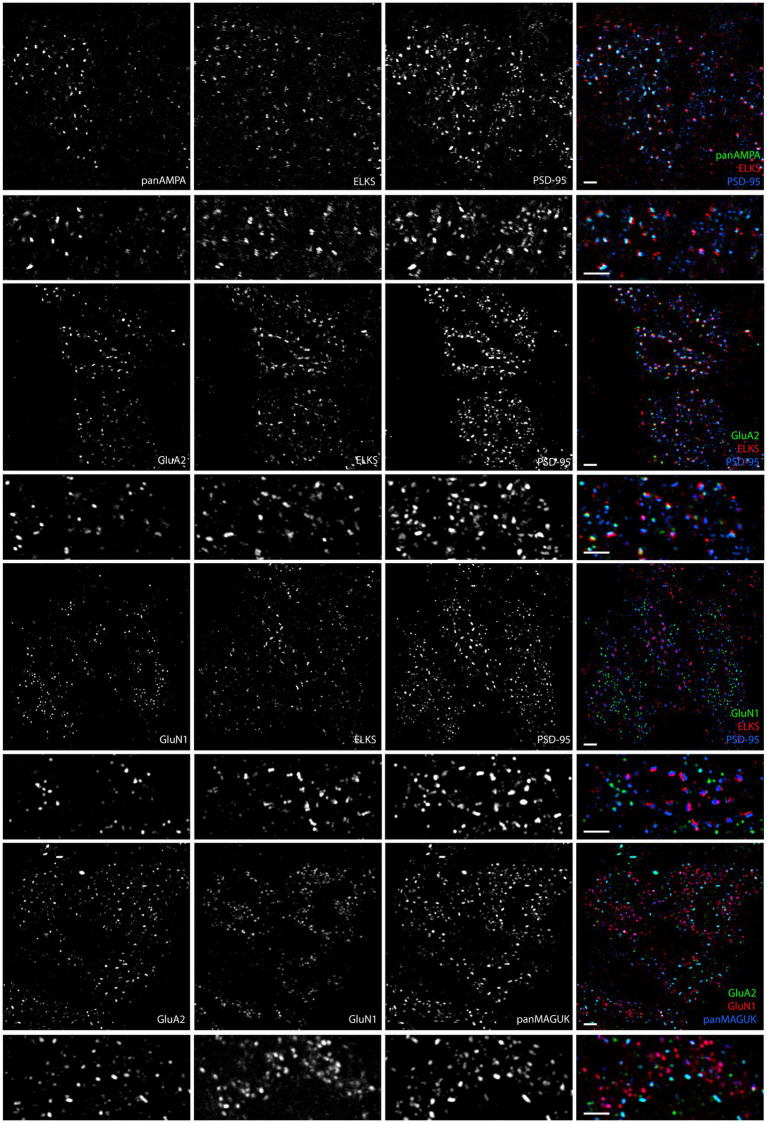
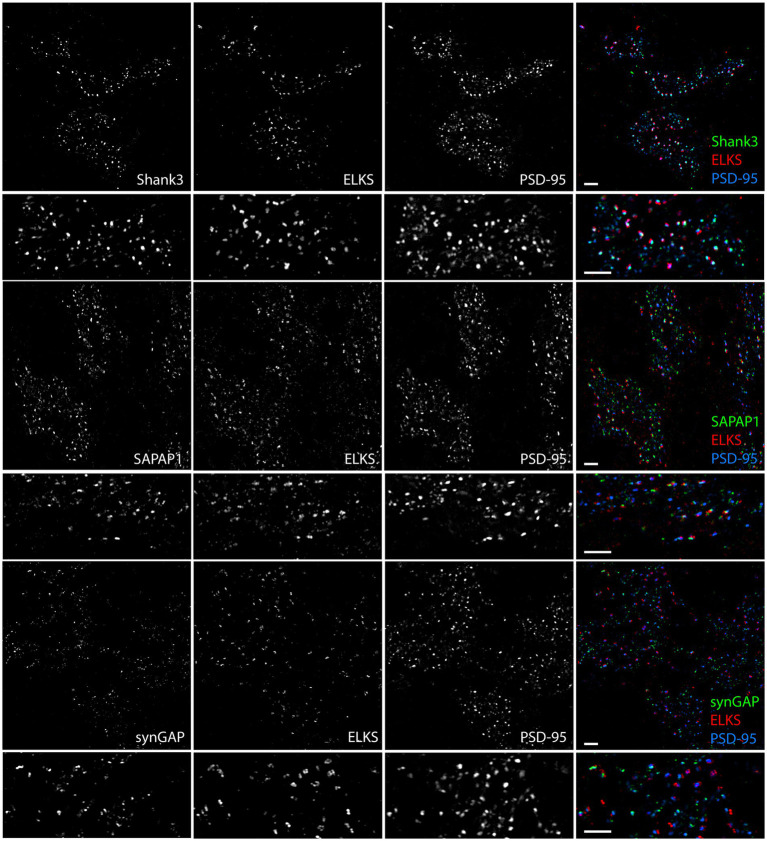
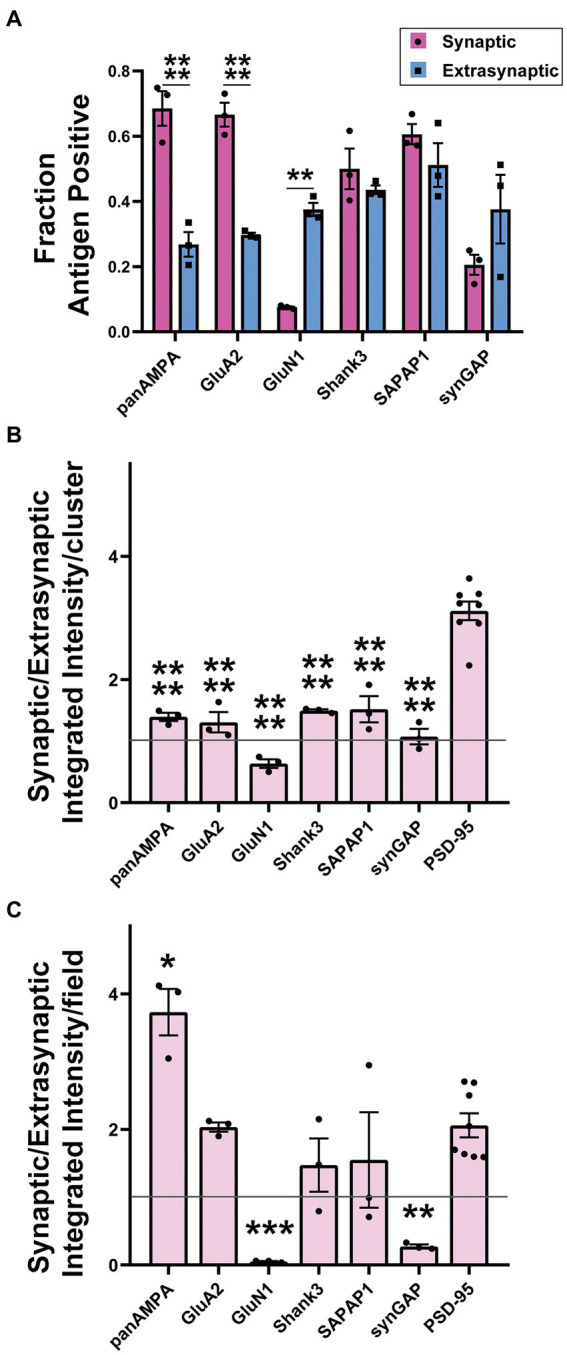
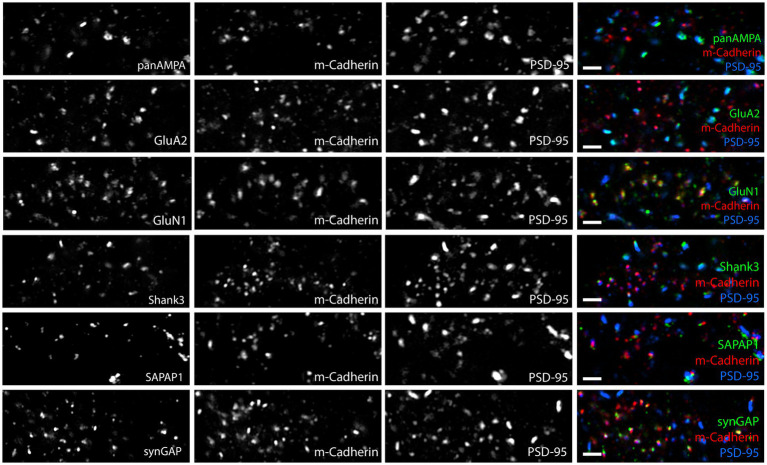
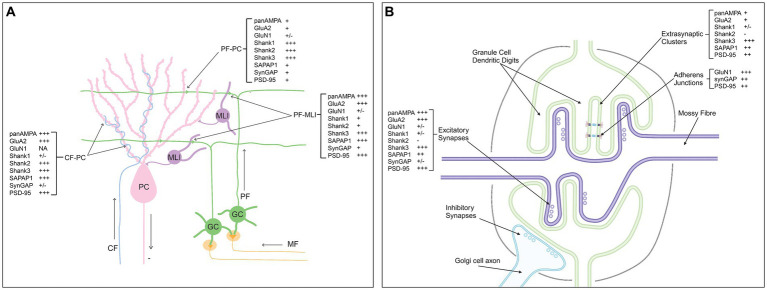
Functions of the cerebellar cortex, from motor learning to emotion and cognition, depend on the appropriate molecular composition at diverse synapse types. Glutamate receptor distributions have been partially mapped using immunogold electron microscopy. However, information is lacking on the distribution of many other components, such as Shank2, a postsynaptic scaffolding protein whose cerebellar dysfunction is associated with autism spectrum disorders. Here, we used an adapted Magnified Analysis of the Proteome, an expansion microscopy approach, to map multiple glutamate receptors, scaffolding and signaling proteins at single synapse resolution in the cerebellar cortex. Multiple distinct synapse-selective distribution patterns were observed. For example, AMPA receptors were most concentrated at synapses on molecular layer interneurons and at climbing fiber synapses, Shank1 was most concentrated at parallel fiber synapses on Purkinje cells, and Shank2 at both climbing fiber and parallel fiber synapses on Purkinje cells but little on molecular layer interneurons. Our results are consistent with gene expression data but also reveal input-selective targeting within Purkinje cells. In specialized glomerular structures of the granule cell layer, AMPA receptors as well as most other synaptic components preferentially targeted to synapses. However, NMDA receptors and the synaptic GTPase activating protein SynGAP preferentially targeted to extrasynaptic sites. Thus, glomeruli may be considered integrative signaling units through which mossy fibers differentially activate synaptic AMPA and extrasynaptic NMDA receptor complexes. Furthermore, we observed NMDA receptors and SynGAP at adherens junctions, suggesting a role in structural plasticity of glomeruli. Altogether, these data contribute to mapping the cerebellar 'synaptome'.

Keywords: AMPA; NMDA; Shank; cerebellar glomerulus; expansion microscopy; synapse.


Conflict of interest statement

The authors declare that the research was conducted in the absence of any commercial or financial relationships that could be construed as a potential conflict of interest.

Figures

Figure 1
Figure 1
Circuitry and synapse-specific markers in the cerebellar cortex. (A) A schematic diagram of simplified circuitry of the cerebellar cortex including the different synapse types and cell types, with ‘+’ indicating excitatory synapses and ‘-‘indicating inhibitory synapses. GC, granule cell; PC, Purkinje cell; MLI, molecular layer interneuron; MF, mossy fiber; PF, parallel fiber; CF, climbing fiber. (B–D) Images of expanded mouse cerebellar sections. (B) GluD2 and PSD-95 form largely distinct clusters apposing ELKS in the cerebellar molecular layer, at separate synapses. (C) Co-staining of GluD2, PSD-95 and GFP (recognizing the genetically encoded ChR2-YFP) in the molecular layer of expanded cerebellum from a Dlx5/6-Cre Ai32 transgenic mouse shows the presence of strong PSD-95 at PF-MLI synapses along the labeled dendrite. Weaker PSD-95 clusters are present at some PF-PC synapses marked by GluD2. (D) Co-staining of GluD2, PSD-95, and VGluT2 in the molecular layer shows the presence of PSD-95, but not GluD2, at VGluT2+ CF synapses. Scale bars, 1 μm biological scale, 3.93 μm expanded scale.
Figure 2
Figure 2
Diversity in synaptic composition of PF-PC versus nonPF-PC synapses. Images of expanded mouse cerebellar sections taken in the proximal molecular layer region showing each antigen of interest co-stained with GluD2 and PSD-95. GluD2 marks PF-PC synapses while PSD-95 marks mainly nonPF-PC excitatory synapses and is also detected at some PF-PC synapses. Synaptic components exhibited different distribution patterns, with panAMPA, GluA2, and SAPAP1 higher at nonPF-PC synapses, Shank1 and Shank2 higher at PF-PC synapses, Shank3 and lower levels of SynGAP present at both synapse types, and GluN1 detected at very few synapses. Scale bars, 1 μm biological scale, 3.93 μm expanded scale.
Figure 3
Figure 3
Quantitation of differential synaptic composition at PF-PC versus nonPF-PC synapses. Brains were processed using the MAP procedure and each section was stained with an antigen of interest along with GluD2 and PSD-95, as in Figure 2. Two image stacks were taken from the proximal region of the molecular layer and two from the distal region per section, with two sections from each mouse, and a total of three mice. Values from each mouse were averaged (n = 3 mice). (A) Fraction of PF-PC and nonPF-PC synapses positive for each antigen. 3-way ANOVA showed significant differences with antigen and PF-PC vs. nonPF-PC but not Proximal vs. Distal: Antigen p < 0.0001, PF-PC vs. nonPF-PC p = 0.017, Proximal vs. Distal p = 0.975, Antigen x PF-PC vs. nonPF-PC p < 0.0001, Antigen x Proximal vs. Distal p = 0.183, PF-PC vs. nonPF-PC x Proximal vs. Distal p = 0.070, Antigen x PF-PC vs. nonPF-PC x Proximal vs. Distal x p = 0.958. p-values for Tukey’s post-hoc comparisons can be found in Supplementary Table S1. (B) Ratio of integrated intensity per synapse at antigen-positive PF-PC/nonPF-PC synapses for each antigen of interest in proximal and distal regions of the molecular layer. 2-way ANOVA showed a significant difference between antigens but not between proximal and distal, with antigen p < 0.0001, Proximal vs. Distal p = 0.372, interaction p = 0.102. Sidak’s post-hoc comparisons showed significant differences in Shank1 (****p < 0.0001) and Shank2 (****p < 0.0001) when compared with all other antigens, no other significant differences were shown, all p values can be found in Supplementary Table S1.
Figure 4
Figure 4
Quantitation of differential synaptic composition at PSD-95+ versus PSD-95- PF-PC synapses. Brains were processed and imaged as in Figures 2, 3. PF-PC synapses were separated into categories according to the presence or absence of detectable PSD-95 and assessed for other synaptic components. (A) Fraction of PSD-95+ PF-PC and PSD-95- PF-PC synapses positive for each antigen. 3-way ANOVA showed significant differences with antigen and PSD-95+ vs. PSD-95- but not Proximal vs. Distal: Antigen p < 0.0001, PSD-95+ vs. PSD-95- p < 0.0001, Proximal vs. Distal p = 0.622, Antigen x PSD-95+ vs. PSD-95- < 0.0001, Antigen x Proximal vs. Distal p = 0.242, Proximal vs. Distal x PSD-95+ vs. PSD-95- p = 0.168, Antigen x Proximal vs. Distal x PSD-95+ vs. PSD-95- p = 0.958 (n = 3 mice). p-values for Tukey’s post-hoc comparisons can be found in Supplementary Table S1. (B) Ratio of integrated intensity per synapse at antigen-positive PSD-95+/PSD-95- PF-PC synapses for each antigen of interest in proximal and distal regions of the molecular layer. 2-way ANOVA showed significant differences between antigens but not between proximal and distal, with antigen p < 0.0001, Proximal vs. Distal p = 0.969, interaction p = 0.936. Sidak’s post-hoc comparisons show that panAMPA (p < 0.0001), GluA2 (p = 0.007) and SAPAP1 (p = 0.0006) are significantly different compared with GluD2, where the other antigens are not (GluN1 p = 0.719, Shank1 p = 0.999, Shank2 p = 0.582, Shank3 p = 0.994, SynGAP p = 0.989).
Figure 5
Figure 5
Diversity in synaptic composition of CF-PC versus nonCF-PC synapses. Images of expanded mouse cerebellar sections taken in the molecular layer region showing each antigen of interest co-stained with PSD-95 and VGluT2. VGluT2 marks presynaptic CF terminals. PSD-95 clusters adjacent to VGluT2 clusters were considered CF-PC synapses, while PSD-95 clusters without VGluT2 are nonCF-PC synapses, mainly PF-MLI and some PF-PC synapses. There are additional PSD-95-lacking PF-PC synapses in the fields of view, where Shank proteins are prominent. Many synaptic components showed a similar distribution between CF-PC and nonCF-PC PSD-95-positive synapses; however, Shank1 and SynGAP appeared to be relatively higher at some nonCF-PC synapses. Scale bars 1 μm biological scale, 4.09 μm expanded scale.
Figure 6
Figure 6
Quantitation of synaptic composition at CF-PC versus nonCF-PC synapses. Brains were processed using the MAP procedure and each section was stained with an antigen of interest along with PSD-95 and VGluT2, as in Figure 5. Two image stacks were taken from the proximal region of the molecular layer per section, with two sections from each mouse, and a total of three mice. Values from each mouse were averaged (n = 3 mice). (A) Fraction of PSD-95-positive CF-PC and nonCF-PC synapses positive for each antigen. 2 way ANOVA showed significant differences with antigen, but not CF-PC vs. nonCF-PC: Antigen p < 0.0001, CF-PC vs. nonCF-PC p = 0.535, interaction p = 0.357. (B) Ratio of integrated intensity per synapse at antigen-positive PSD-95-positive CF-PC/nonCF-PC synapses for each antigen of interest. One-way ANOVA did not show significance: p = 0.221.
Figure 7
Figure 7
AMPA and NMDA receptors show differential synaptic versus extrasynaptic localization in glomeruli. Images of expanded mouse cerebellar sections taken in the granule cell layer showing panAMPA, GluA2, and GluN1 with ELKS and PSD-95. ELKS marks all synaptic sites in the glomeruli. PSD-95 and panMAGUK are in large clusters at excitatory synaptic sites adjacent to ELKS and in smaller clusters at extrasynaptic sites not associated with ELKS. While panAMPA and GluA2 selectively cluster at synaptic sites, GluN1 selectively clusters at extrasynaptic sites. As seen in the final panel, GluN1 and GluA2 labeled together with panMAGUK, the AMPA and NMDA receptor clusters show little to no overlap. Scale bars 1 μm biological scale, 3.66 μm expanded scale.
Figure 8
Figure 8
Synaptic versus extrasynaptic localization of scaffolding and signaling proteins in glomeruli. Images of expanded mouse cerebellar sections taken in the granule cell layer showing scaffolding and signaling proteins of interest with ELKS and PSD-95. While Shank3 and SAPAP1 localize to synaptic and extrasynaptic sites, SynGAP appears to preferentially localize to extrasynaptic sites. Scale bars 1 μm biological scale, 3.66 μm expanded scale.
Figure 9
Figure 9
Quantitation of synaptic versus extrasynaptic localization in glomeruli. Brains were processed using the MAP procedure and each section was stained with an antigen of interest along with ELKS and PSD-95, as in Figures 7, 8. Two image stacks were taken per section, with two sections from each mouse, and a total of three mice. Values from each mouse were averaged (n = 3 mice). (A) Fraction of synaptic vs. extrasynaptic PSD-95 clusters positive for each antigen. 2-way ANOVA showed significant differences between antigens as well as between synaptic and extrasynaptic clusters: Antigen p < 0.0001, Synaptic vs. Extrasynaptic p = 0.009, interaction p < 0.0001. Sidak’s post-hoc comparisons showed that panAMPA (**** p < 0.0001) and GluA2 (**** p < 0.0001) were present at a significantly higher percentage of synaptic than extrasynaptic clusters, while GluN1 (** p = 0.001) was present at a significantly lower percentage of synaptic than extrasynaptic clusters, and the other antigens did not show a significant difference between synaptic and extrasynaptic (Shank3 p = 0.925, SAPAP1 p = 0.686, synGAP p = 0.108). (B) Ratio of integrated intensity per cluster at antigen-positive PSD-95-positive synaptic/extrasynaptic clusters for each antigen of interest in granule cell layer glomeruli. All ratios were > 1 except GluN1, which had a ratio of <1. One-way ANOVA showed significant differences between antigens: p < 0.0001. Dunnett’s post-hoc comparisons showed that all antigens (**** p < 0.0001) had a significantly lower ratio than PSD-95. (C) Ratio of integrated intensity per field at antigen positive PSD-95-positive synaptic/extrasynaptic clusters for each antigen of interest in granule cell layer glomeruli. One-way ANOVA showed significant differences between antigens: p < 0.0001. Dunnett’s post-hoc comparisons showed that when compared with the PSD-95 ratio, panAMPA (** p = 0.002) was significantly greater, while GluN1 (*** p = 0.0004) and synGAP (** p = 0.001) were significantly lesser, other antigens were not significantly different than PSD-95 (GluA2 p > 0.999, Shank3 p = 0.565, SAPAP1 p = 0.694). Each imaging field was 51.84 μm x 51.84 μm x 7.41 μm (X, Y and Z dimensions).
Figure 10
Figure 10
Glomerular NMDA receptor complexes are detected at adherens junctions. Images of expanded mouse cerebellar sections taken in the granule cell layer showing each antigen of interest along with M-cadherin and PSD-95. M-cadherin marks adherens junctions in the glomeruli. PSD-95 is detected at many adherens junctions as well as at larger, presumably synaptic, clusters. GluA2, panAMPA, Shank3 and SAPAP1 show minimal overlap with M-cadherin, consistent with their presence in synaptic clusters (as shown in Figures 8, 9). In contrast, GluN1 and SynGAP show strong colocalization with M-cadherin at adherens junctions. Scale bars 0.5 μm biological scale, 1.83 μm expanded scale.
Figure 11
Figure 11
Summary of estimated relative abundance of synaptic components per synapse type in the cerebellar cortex. (A) Molecular layer. (B) Granule cell layer glomeruli. Created with BioRender.com.

Similar articles

References

    1. Abe M., Fukaya M., Yagi T., Mishina M., Watanabe M., Sakimura K. (2004). NMDA receptor GluRepsilon/NR2 subunits are essential for postsynaptic localization and protein stability of GluRzeta1/NR1 subunit. J. Neurosci. 24, 7292–7304. doi: 10.1523/JNEUROSCI.1261-04.2004, PMID: - DOI - PMC - PubMed
    1. Abe K., Takeichi M. (2007). NMDA-receptor activation induces calpain-mediated beta-catenin cleavages for triggering gene expression. Neuron 53, 387–397. doi: 10.1016/j.neuron.2007.01.016, PMID: - DOI - PubMed
    1. Andreescu C. E., Prestori F., Brandalise F., D'Errico A., De Jeu M. T., Rossi P., et al. . (2011). NR2A subunit of the N-methyl D-aspartate receptors are required for potentiation at the mossy fiber to granule cell synapse and vestibulo-cerebellar motor learning. Neuroscience 176, 274–283. doi: 10.1016/j.neuroscience.2010.12.024, PMID: - DOI - PubMed
    1. Araki Y., Zeng M., Zhang M., Huganir R. L. (2015). Rapid dispersion of SynGAP from synaptic spines triggers AMPA receptor insertion and spine enlargement during LTP. Neuron 85, 173–189. doi: 10.1016/j.neuron.2014.12.023, PMID: - DOI - PMC - PubMed
    1. Bahjaoui-Bouhaddi M., Padilla F., Nicolet M., Cifuentes-Diaz C., Fellmann D., Mege R. M. (1997). Localized deposition of M-cadherin in the glomeruli of the granular layer during the postnatal development of mouse cerebellum. J. Comp. Neurol. 378, 180–195. doi: 10.1002/(SICI)1096-9861(19970210)378:2<180::AID-CNE3>3.0.CO;2-#, PMID: - DOI - PubMed

LinkOut - more resources