. 2024 Apr 27;27(6):109834.
doi: 10.1016/j.isci.2024.109834. eCollection 2024 Jun 21.

Mitochondrial clearance and increased HSF-1 activity are coupled to promote longevity in fasted Caenorhabditis elegans

Affiliations

Mitochondrial clearance and increased HSF-1 activity are coupled to promote longevity in fasted Caenorhabditis elegans

Nikolaos Tataridas-Pallas et al. iScience. .

Abstract

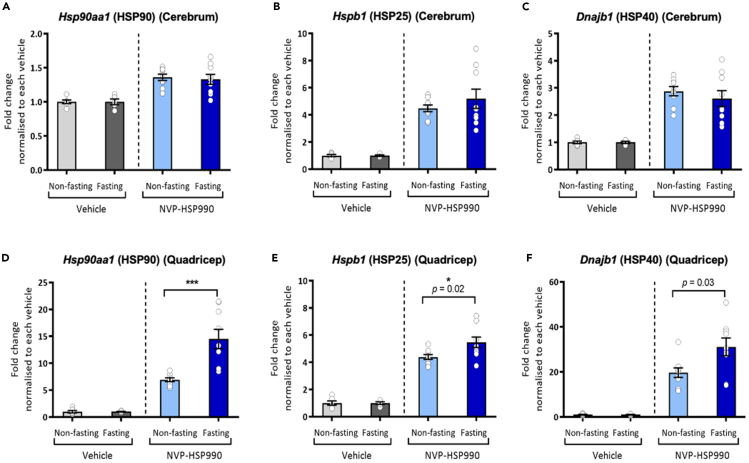
Fasting has emerged as a potent means of preserving tissue function with age in multiple model organisms. However, our understanding of the relationship between food removal and long-term health is incomplete. Here, we demonstrate that in the nematode worm Caenorhabditis elegans, a single period of early-life fasting is sufficient to selectively enhance HSF-1 activity, maintain proteostasis capacity and promote longevity without compromising fecundity. These effects persist even when food is returned, and are dependent on the mitochondrial sirtuin, SIR-2.2 and the H3K27me3 demethylase, JMJD-3.1. We find that increased HSF-1 activity upon fasting is associated with elevated SIR-2.2 levels, decreased mitochondrial copy number and reduced H3K27me3 levels at the promoters of HSF-1 target genes. Furthermore, consistent with our findings in worms, HSF-1 activity is also enhanced in muscle tissue from fasted mice, suggesting that the potentiation of HSF-1 is a conserved response to food withdrawal.

Keywords: Biological sciences; Physiology; cell biology; molecular biology.


Conflict of interest statement

The authors declare no competing interests.

Figures

None
Graphical abstract
Figure 1
Figure 1
Fasting at the transition to adulthood maintains proteostasis capacity in aged tissues and extends lifespan (A and B) Survival at 20°C or following heat shock (HS) (35°C, 4 h) in fed or fasted worms. (C) Progeny produced at specific days of adulthood in fed and fasted animals. Data plotted are mean values ± SD. (D) Survival of fed or fasted animals (starting at L3, L4, day 1 of adulthood or day 2 of adulthood) following heat shock (35°C, 4 h). (E and F) PolyQ::YFP aggregate number in fed and fasted worms on day 3 and day 5 of adulthood in (E) body wall muscles and (F) intestines, respectively. Data plotted are mean values ± (E) SD or (F) SEM. (G) Proportion of motile polyQ (35) worms at different days of adulthood following constant feeding or transient fasting. Data plotted are mean values ± SD. (H) Body bends per minute (thrashing rate) of fed and fasted worms expressing ABeta in body wall muscle cells. Data plotted are mean ± SEM. Statistical comparisons were made using Mantel-Cox Log-Rank test (A & B), Student’s unpaired t-test (E and F) or two-way ANOVA (G and H). ∗ = p < 0.05, ∗∗∗∗ = p < 0.0001. Full statistics for survival curves can be found in Table S1. Fasting conditions were as follows: A, C, E, F, G, and H—animals were removed from food for 24 h starting at the L4 stage and then returned to food thereafter; B—animals were removed from food for 24 h starting at the L4 stage and then returned to food for 24 h prior to HS; C—animals were removed from food for 24 h starting at the indicated life stage and then returned to food for 24 h prior to HS. See also Figure S1 and Table S1.
Figure 2
Figure 2
Fasting enhances proteostasis capacity and promotes longevity through the selective potentiation of HSF-1 activity (A) Survival of fed and fasted wild-type (N2) or PN mutant animals following heat shock (HS) (35°C, 4 h). (B) Survival at 20°C of fed and fasted wild-type and hsf-1(sy441) mutant worms. Lifespan assay was run in parallel with those presented in Figures 3G and 3H. (C and D) Relative mRNA levels of canonical HSF-1 target genes in fed and fasted worms under (C) basal (20°C) and (D) HS (35°C, 30 min) conditions. Data plotted are mean ± (C) SEM or (D) SD. (E and F) Relative mRNA levels of hsp-4 and hsp-6 in fed and fasted worms under (E) basal or (F) HS (35°C, 30 min) conditions. Data plotted are mean ± (E) SD or (F) SEM. (G) Relative expression of all HSF-1 target genes in fed and fasted worms under basal or HS (35°C, 30 min) conditions. (H) STRING network of up-regulated (p < 0.05) HSF-1 target PN genes in fasted worms following HS (35°C, 30 min). For panels C–G, worms were harvested immediately after the heat shock conditions specified. Statistical comparisons were made using Mantel-Cox Log-Rank test (B) or Student’s unpaired t-test with FDR correction (C–F). ns = p > 0.05, ∗ = p < 0.05, ∗∗∗∗ = p < 0.0001. Full statistics for heatmap and survival curves can be found in Table S1. Fasting conditions were as follows: A, C, D, E, and F—animals were removed from food for 24 h starting at the L4 stage and then returned to food for 24 h prior to HS; B—animals were removed from food for 24 h starting at the L4 stage and then returned to food thereafter; G—animals were removed from food for 24 h starting at the L4 stage and then immediately exposed to basal or HS conditions. See also Figure S2, Tables S1 and S4.
Figure 3
Figure 3
Mitochondrial sirtuins are necessary for increased stress resistance and longevity following early-life fasting (A) Representative images of fed and fasted WBM321 acs-2p:gfp worms. Scale bar, 200 μM. (B) Relative NAD+ levels in fed and fasted worms. Data plotted are mean ± SEM. (C–F) Survival of fed and fasted wild-type (N2), (C) nhr-49(nr2041), (D) sir-2.1(ok434), (E) sir-2.2(tm2648) and (F) sir-2.3(ok444) mutant worms following heat shock (35°C, 4 h). (G and H) Lifespan at 20°C of fed and fasted wild-type (N2), (G) sir-2.2(tm2648) and (H) sir-2.3(ok444) mutants. Statistical comparisons were made using Student’s unpaired t-test (B) and Mantel-Cox Log-Rank test (C–H). ns = p > 0.05, ∗ = p < 0.05, ∗∗∗∗ = p < 0.0001. Full statistics for survival curves can be found in Table S1. Survival assays in D–F, and G and H (also run alongside survival assay presented in Figure 2B), were run in parallel. Fasting conditions were as follows: A–F—animals were removed from food for 24 h starting at the L4 stage and then returned to food for 24 h prior to imaging, collection or HS; G and H—animals were removed from food for 24 h starting at the L4 stage and then returned to food thereafter. See also Figure S3 and Table S1.
Figure 4
Figure 4
SIR-2.2 couples mitochondrial clearance with enhanced HSF-1 activity in fasted animals (A–C) Relative expression of HSF-1 target genes in fed and fasted wild-type worms or sir-2.2(tm2648) mutants following heat shock (35°C, 30 min). Worms were harvested immediately following heat shock. Data are plotted as mean ± (A and B) SEM or (C) SD. (D and E) Relative sir-2.2 and sir-2.3 mRNA levels in fed and fasted animals. Data are plotted as mean ± SEM. (F) Representative images of fed and fasted SIR-2.2:EGFP worms. Scale bar, 200 μM. (G & H) Relative (G) SIR-2.2:EGFP levels and (H) mitochondrial copy number at different times post fasting. Data are plotted as mean ± SD. (I) Mitochondrial copy number in fed and fasted wild-type or sir-2.2(tm2648) mutant worms. Data are plotted as mean ± SEM. (J) Survival of fed and fasted wild-type (N2) and hlh-30 mutant worms following heat shock (35°C, 4 h). Statistical comparisons were made using two-way ANOVA with post-analysis pairwise comparison of groups (A–C and G–I), Student’s unpaired t-test (D and E) and Mantel-Cox Log-Rank test (J). ns = p > 0.05, ∗ = p < 0.05, ∗∗ = p < 0.01, ∗∗∗ = p < 0.001, ∗∗∗∗ = p < 0.0001. Full statistics for survival curves can be found in Table S1. The survival assay in J was run in parallel with S4C and D. Fasting conditions were as follows: A–C and J—animals were removed from food for 24 h starting at the L4 stage and then returned to food for 24 h prior to HS; D–F—animals were removed from food for 24 h starting at the L4 stage and then immediately collected or imaged; G and H—animals were removed from food at the L4 stage for the indicated times before collection; I—animals were removed from food at the L4 stage for 16 h before collection. See also Figure S4, Tables S1 and S4.
Figure 5
Figure 5
JMJD-3.1 promotes HSF-1 potentiation in response to fasting (A and B) Relative mRNA (arbitrary units, AU) of HSF-1 target genes in heat shocked (35°C, 30 min) wild-type and jmjd-3.1(gk384) KO mutant worms. Worms were harvested immediately following heat shock. Data are plotted as mean ± SD. (C) Survival of fed and fasted wild-type and jmjd-3.1(gk384) mutant worms following heat shock (35°C, 4 h). (D) Lifespan at 20°C of wild-type and jmjd-3.1(gk384) mutant worms. (E) Representative western blots of total histone H3, H3K27me3, H3K27ac, and tubulin in fed and fasted worms. (F) Relative H3K27me3 levels at HSF-1 target promoters in fed and fasted worms. Data are plotted as mean ± SEM. Statistical comparisons were made using two-way ANOVA with post-analysis pairwise comparison of groups (A and B), Mantel-Cox Log-Rank test (C and D) and unpaired Student’s t test (F). ns = p > 0.05, ∗ = p < 0.05, ∗∗∗ = p < 0.001, ∗∗∗∗ = p < 0.0001. Full statistics for survival curves can be found in Table S1. Fasting conditions were as follows: A–C and F—animals were removed from food for 24 h starting at the L4 stage and then returned to food for 24 h prior to HS or collection; D—animals were removed from food for 24 h starting at the L4 stage and then returned to food thereafter; E—animals were removed from food for 24 h starting at the L4 stage and then immediately collected. See also Figure S5, Tables S1 and S4. (see also Figure S5).
Figure 6
Figure 6
Fasting selectively potentiates HSF-1 activity in mouse skeletal muscle but not brain tissue (A–C) QuantiGene assessment of HSF-1 target genes in brain tissue of fed and fasted mice following treatment with vehicle or NVP-HSP990 (12 mg/kg). Values following NVP-HSP990 treatment were normalized to corresponding vehicle controls. Data plotted are mean ± SEM. (D–F) QuantiGene assessment of HSF-1 target genes in quadricep muscle tissue of fed and fasted mice following treatment with vehicle or NVP-HSP990 (12 mg/kg). Data plotted are mean ± SEM. Statistical comparisons were made using two-way ANOVA with Bonferroni correction. ∗∗∗p < 0.001. Data were screened for outliers using a ROUT test and one mouse was removed from both the NVP-HSP990 fed and fasted groups. Final sample numbers were: vehicle non-fasting = 4, vehicle fasted = 6, NVP-HSP990 non-fasting = 9, NVP-HSP990 fasted = 9. See also Figure S6, Tables S2–S4. (see also Figure S6).

Similar articles

References

    1. Labbadia J., Morimoto R.I. The biology of proteostasis in aging and disease. Annu. Rev. Biochem. 2015;84:435–464. doi: 10.1146/annurev-biochem-060614-033955. - DOI - PMC - PubMed
    1. Hipp M.S., Kasturi P., Hartl F.U. The proteostasis network and its decline in ageing. Nat. Rev. Mol. Cell Biol. 2019;20:421–435. doi: 10.1038/s41580-019-0101-y. - DOI - PubMed
    1. Hetz C. Adapting the proteostasis capacity to sustain brain healthspan. Cell. 2021;184:1545–1560. doi: 10.1016/j.cell.2021.02.007. - DOI - PubMed
    1. Shemesh N., Shai N., Ben-Zvi A. Germline stem cell arrest inhibits the collapse of somatic proteostasis early in Caenorhabditis elegans adulthood. Aging Cell. 2013;12:814–822. doi: 10.1111/acel.12110. - DOI - PubMed
    1. Labbadia J., Morimoto R.I. Repression of the Heat Shock Response Is a Programmed Event at the Onset of Reproduction. Mol. Cell. 2015;59:639–650. doi: 10.1016/j.molcel.2015.06.027. - DOI - PMC - PubMed