. 2024 May 9:18:1349366.
doi: 10.3389/fnins.2024.1349366. eCollection 2024.

Stress-impaired reward pathway promotes distinct feeding behavior patterns

Affiliations

Stress-impaired reward pathway promotes distinct feeding behavior patterns

Yusuke Fujioka et al. Front Neurosci. .

Abstract

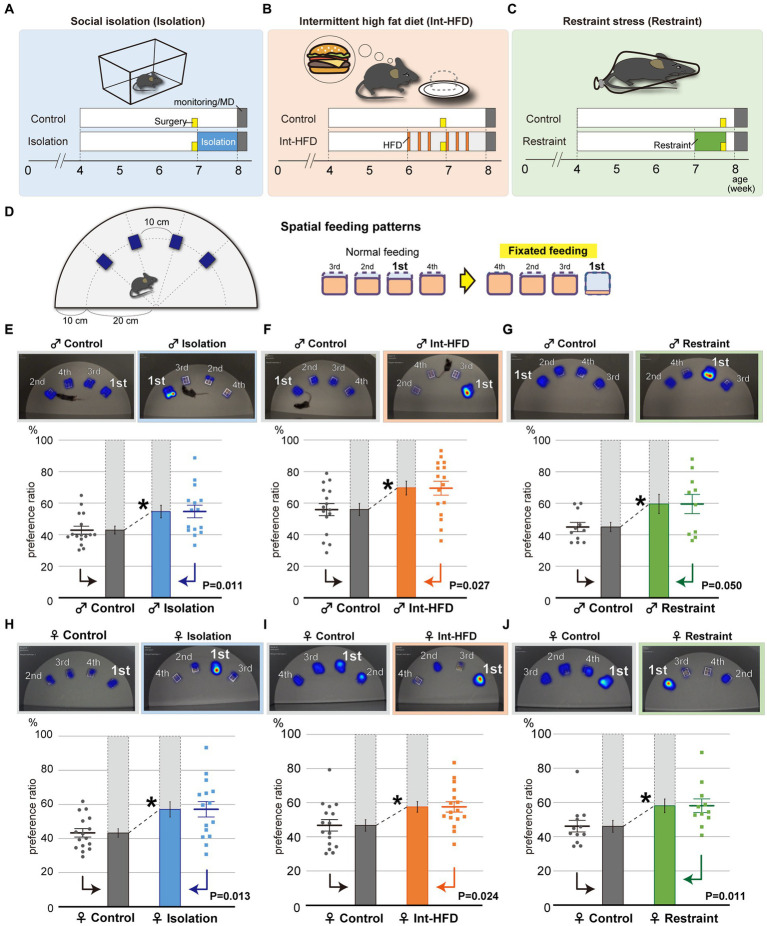
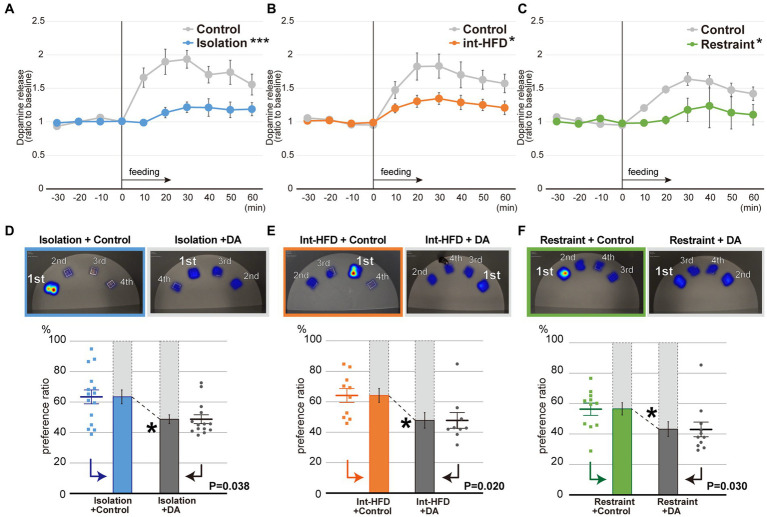
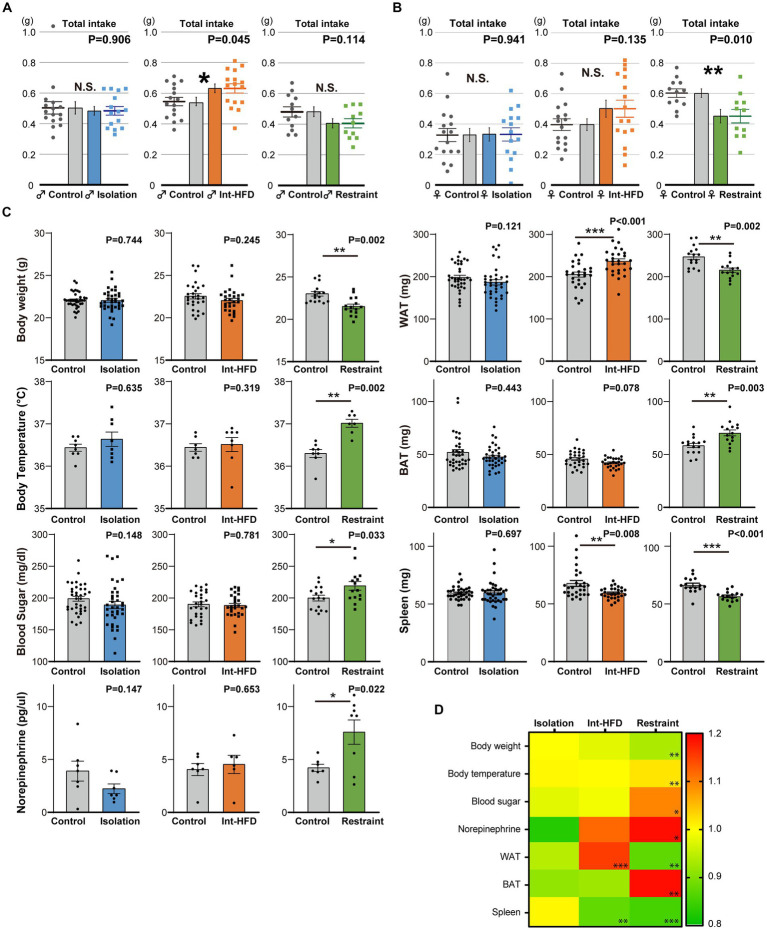
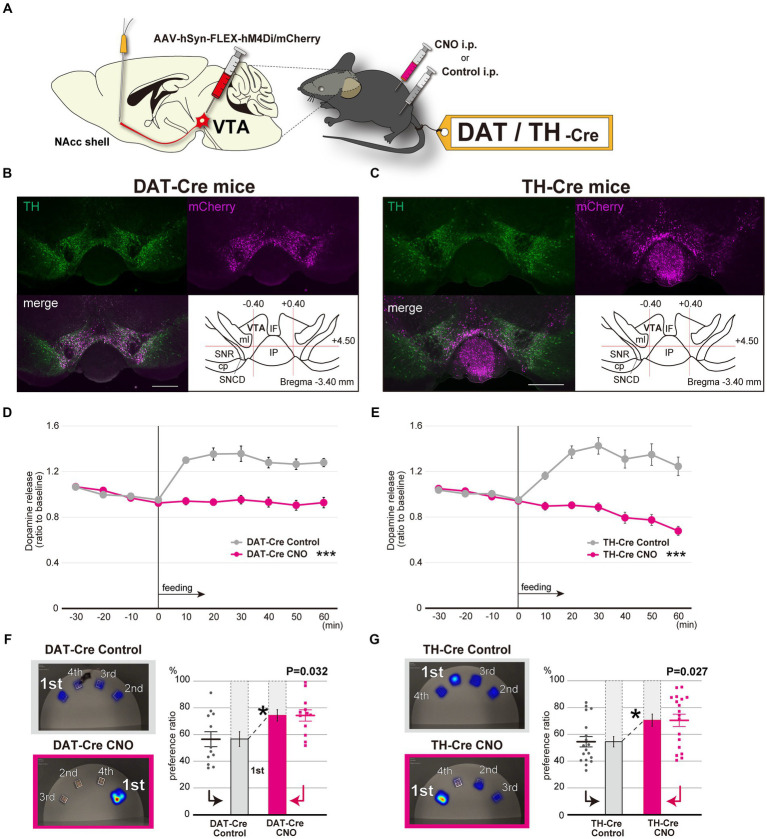
Although dietary behaviors are affected by neuropsychiatric disorders, various environmental conditions can have strong effects as well. We found that mice under multiple stresses, including social isolation, intermittent high-fat diet, and physical restraint, developed feeding behavior patterns characterized by a deviated bait approach (fixated feeding). All the tested stressors affected dopamine release at the nucleus accumbens (NAcc) shell and dopamine normalization reversed the feeding defects. Moreover, inhibition of dopaminergic activity in the ventral tegmental area that projects into the NAcc shell caused similar feeding pattern aberrations. Given that the deviations were not consistently accompanied by changes in the amount consumed or metabolic factors, the alterations in feeding behaviors likely reflect perturbations to a critical stress-associated pathway in the mesolimbic dopamine system. Thus, deviations in feeding behavior patterns that reflect reward system abnormalities can be sensitive biomarkers of psychosocial and physical stress.

Keywords: biomarker; dopamine; feeding behavior patterns; fixated feeding; psychosocial stress; reward system.


Conflict of interest statement

The authors declare that the research was conducted in the absence of any commercial or financial relationships that could be construed as a potential conflict of interest.

Figures

Figure 1
Figure 1
Psychosocial and physical stresses such as social isolation, intermittent high-fat diet, and physical restraint cause aberrant feeding behavior patterns characterized by fixated feeding. (A–C) Study paradigms for social isolation (A, Isolation), intermittent high-fat diet (B, Int-HFD), and restraint stress (C, Restraint) are shown. Wild-type C57BL/6 J strain mice were assigned to either stressor or control groups. Mice in social isolation were maintained alone in cages for a week (blue). Mice in the intermittent HFD group accessed a HFD for 2 h during the day every other day for 2 weeks (orange). For the restraint group, 7-week-old mice were subjected to 2 h of complete immobilization using restrainers for five consecutive days (green). Yellow boxes indicate the day when the cannulas were placed into the NAcc of mice for microdialysis experiments. (D) Experimental scheme to assess mouse feeding behaviors. Four bait containers were affixed at 10-cm intervals along the outer edge of half a circle plate. The respective diet containers required mice to physically insert their heads to consume the bait. Mouse movements were captured and analyzed using imaging software. Although mice normally feed rather equivalently from multiple bait sources, when mice show a clear preference for a specific food source, the feeding pattern was defined as “fixated feeding.” (E) The spatial feeding patterns of male mice reared in social isolation or in group housing (Control). Representative heatmap images indicate the duration of time spent on a bait source. The duration on each bait source was quantified with a motion capture system and the sources ranked in decreasing order of duration at each bait position and a preference ratio was determined. Similarly, the amount consumed from each source was quantified with the sources ranked in decreasing order of bait consumption (Supplementary Figures S1A–C). Statistical analysis was performed on the primary preference ratio (n = 15 for Isolation, n = 16 for Control, Welch’s t test). (F) The spatial feeding patterns of male mice with the intermittent HFD diet or a normal diet (Control). Representative heatmap images reflect the duration of time spent on a bait source as before. The duration at each bait source was quantified with a motion capture system and statistical analysis were performed as in (E) (n = 16 for each, Welch’s t test). (G) The spatial feeding patterns of physically restrained and non-restrained male mice (Control). Representative heatmap images, quantification of the duration of time spent at each source, and statistical analysis were performed as in (E) (n = 10 for Restraint, n = 11 for Control, Welch’s t test). (H) The spatial feeding patterns of female mice reared in social isolation or in group housing (Control). Representative heatmap images indicate the duration of time spent at a bait source. The duration spent at each bait source was quantified using the motion capture system with the sources ranked in decreasing order of duration at each bait position and a preference ratio was determined. Statistical analysis was performed on the preference ratio (n = 15 for Isolation, n = 16 for Control; Welch’s t test). (I) The spatial feeding patterns of female mice reared on the intermittent HFD or a normal diet (Control). Representative heatmap images reflect the duration of time spent at each bait source as before. The duration of time at each bait source was quantified with the motion capture system (n = 16 for both; Welch’s t test). (J) The spatial feeding patterns of physically restrained and non-restrained female mice (Control). Representative heatmap images, quantification of time spent at each source (n = 11 for Restraint, n = 12 for Control; Mann–Whitney U test). *p < 0.05. Data are mean ± SEM.
Figure 2
Figure 2
Dopamine levels in the NAcc shell are impaired by psychosocial and physical stresses, whereas dopamine supplementation normalizes the stress-induced fixated feeding. (A) In vivo microdialysis analysis of mice from the isolation group. Feeding increased the amount of dopamine (DA) in the NAcc shell. The extracellular DA levels were determined by in vivo microdialysis and HPLC-ECD. Basal fractions were collected prior to the initiation of feeding at time point 0 (n = 8 each, ***significantly different from control group by ANOVA with repeated measures). (B) In vivo microdialysis analysis of mice from the intermittent HFD group (n = 8 for Int-HFD, n = 9 for Control, *significantly different from control group by ANOVA with repeated measures). (C) In vivo microdialysis analysis of mice from the restrained group (n = 8 for Restraint, n = 9 for Control, *significantly different from control group by ANOVA with repeated measures). (D) The spatial feeding patterns of mice in the Isolation + Control groups and Isolation + DA groups. Representative heatmap images are as in Figure 1E. The duration of time spent per bait position was quantified with a motion capture system and the sources ranked as in Figure 1E. Similarly, the amount consumed for each source was ranked in decreasing order (Supplementary Figures S2B–D). Statistical analysis was performed on the primary preference ratio as in Figures 1E–G (n = 15 for Isolation + Control, n = 14 for Isolation + DA, Mann–Whitney U test). (E) The spatial feeding patterns of mice in the Int-HFD + Control and the Int-HFD + DA groups. Representative heatmap images, graphs, and statistical analysis are as above (n = 10 for Int-HFD + Control, n = 9 for Int-HFD + DA, Mann–Whitney U test). (F) The spatial feeding patterns of mice in the Restraint + Control and Restraint + DA groups. Representative heatmap images, graphs and statistical analysis are as above (n = 11 for each, Mann–Whitney U test). *p < 0.05, ***p < 0.001. Data are mean ± SEM.
Figure 3
Figure 3
The amount of total consumption and general metabolic factors vary across the three stressor conditions. (A) Total bait amount consumed (total intake) by male mice in the three stressor conditions during the real-time monitoring period depicted in Figures 1E–G (n = 15 for Isolation, n = 16 for Control; n = 16 for both Int-HFD and Control; n = 10 for Restraint, n = 11 for Control, Welch’s t test). (B) The total amount of bait consumed by female mice across the three experimental stressor conditions throughout the real-time monitoring period in Figures 1H–J (left; n = 15 for Isolation, n = 16 for Control, middle; n = 16 for both Int-HFD and Control, right; n = 11 for Restraint, n = 12 for Control, Welch’s t test). (C) Effects of the three stressor conditions (social isolation, Int-HFD, and physical restraint) were assessed in terms of various metabolic factors including, body weight and temperature (rectal temperature), blood sugar, plasma norepinephrine concentration, brown (BAT) and white adipose tissue (WAT) levels, and spleen weight. Results of the measurements across the experimental conditions are depicted via a heatmap (ratio to controls). Note that the norepinephrine data (isolation and restrained) are off scale. (D) Quantitative data are shown as comparisons between each respective stress condition (Isolation, blue; Int-HFD, orange; Restraint, green) and controls (Isolation group body temperature—n = 8 for both; Int-HFD group body temperature—n = 8 for Int-HFD, n = 7 for Control; Restrained body temperature—n = 7 for Restraint, n = 8 for Control; Mann–Whitney U test. Isolation group plasma norepinephrine—n = 7 for both; intermittent HFD group plasma norepinephrine—n = 6 for Int-HFD, n = 7 for Control; Restrained plasma norepinephrine—n = 8 for Restraint, n = 7 for Control; Welch’s t test. Isolation group others—n = 36 for both; intermittent HFD group others—n = 28 for both; Restrained group others—n = 15 for Restraint, n = 16 for Control; Mann–Whitney U test). *p < 0.05, **p < 0.01, ***p < 0.001, N.S. denotes not significant. Data are mean ± SEM.
Figure 4
Figure 4
Selective inhibition of the dopaminergic neuronal circuit from the VTA to the NAcc replicates fixated feeding behavior patterns. (A) DREADD-based experimental scheme for inhibiting the dopaminergic neurons at the VTA. AAV-hSyn-FLEX-hM4Di/mCherry was injected into the VTA of 6-week-old DAT-Cre or TH-Cre mice (see also Supplementary Figure S5A). (B) Immunofluorescent images of dopaminergic neurons in the VTA with mCherry expression in DAT-Cre mice. Sections including the VTA were stained with anti-TH antibodies. Abbreviations used in the Figure: cp, cerebral peduncle; IF, interfascicular nucleus; IP, interpeduncular nucleus; ml, medial lemniscus; SNCD, substantia nigra, compact part, dorsal tier; SNR, substantia nigra, reticular part. Scale bar, 500 μm. (C) Immunofluorescent images of dopaminergic neurons in the VTA with mCherry expression in TH-Cre mice. (D) In vivo microdialysis analysis of DAT-Cre in which AAV-hSyn-FLEX-hM4Di/mCherry was injected into the VTA. Feeding after overnight starvation induced the release of DA in the NAcc shell. Mice were intraperitoneally administered CNO or Control 30 min prior to feeding. The extracellular DA levels of mice were determined as in Figures 2A–C (n = 8, ***significantly different from control groups by ANOVA with repeated measures). (E) In vivo microdialysis analysis of TH-Cre in which AAV-hSyn-FLEX-hM4Di/mCherry was injected into the VTA (n = 11, ***significantly different from control groups by ANOVA with repeated measures). (F) The spatial feeding patterns of DAT-Cre mice treated with CNO or Control following AAV-hSyn-FLEX-hM4Di/mCherry injection. Representative heatmap images and preference ratios were determined as in Figure 1E (see also Supplementary Figure S5B). Statistical analysis was performed on the most frequently consumed bait ratio (n = 12, Wilcoxon signed-rank test). (G) The spatial feeding patterns of TH-Cre mice treated with CNO or Control following AAV-hSyn-FLEX-hM4Di/mCherry injection (n = 18, Wilcoxon signed-rank test). Representative heatmap images and preference ratios were determined as in Figure 1E (see also Supplementary Figure S5C). *p < 0.05, ***p < 0.001. Data are mean ± SEM.

Similar articles

Cited by

References

    1. Adam T. C., Epel E. S. (2007). Stress, eating and the reward system. Physiol. Behav. 91, 449–458. doi: 10.1016/j.physbeh.2007.04.011 - DOI - PubMed
    1. Adamantidis A. R., Tsai H. C., Boutrel B., Zhang F., Stuber G. D., Budygin E. A., et al. . (2011). Optogenetic interrogation of dopaminergic modulation of the multiple phases of reward-seeking behavior. J. Neurosci. 31, 10829–10835. doi: 10.1523/JNEUROSCI.2246-11.2011, PMID: - DOI - PMC - PubMed
    1. Ahmed R. M., Irish M., Henning E., Dermody N., Bartley L., Kiernan M. C., et al. . (2016). Assessment of eating behavior disturbance and associated neural networks in frontotemporal dementia. JAMA Neurol. 73, 282–290. doi: 10.1001/jamaneurol.2015.4478, PMID: - DOI - PubMed
    1. Alonso-Alonso M., Woods S. C., Pelchat M., Grigson P. S., Stice E., Farooqi S., et al. . (2015). Food reward system: current perspectives and future research needs. Nutr. Rev. 73, 296–307. doi: 10.1093/nutrit/nuv002, PMID: - DOI - PMC - PubMed
    1. Arias-Carrión O., Stamelou M., Murillo-Rodríguez E., Menéndez-González M., Pöppel E. (2010). Dopaminergic reward system: a short integrative review. Int. Arch. Med. 3:24. doi: 10.1186/1755-7682-3-24, PMID: - DOI - PMC - PubMed

LinkOut - more resources