. 2024;84(5):518.
doi: 10.1140/epjc/s10052-024-12865-9. Epub 2024 May 21.

Demonstration of event position reconstruction based on diffusion in the NEXT-white detector

J Haefner  1 K E Navarro  2 R Guenette  3 B J P Jones  2 A Tripathi  2 C Adams  4 H Almazán  3 V Álvarez  5 B Aparicio  6 A I Aranburu  7 L Arazi  8 I J Arnquist  9 F Auria-Luna  6 S Ayet  10 C D R Azevedo  11 K Bailey  4 F Ballester  5 M Del Barrio-Torregrosa  12 A Bayo  13 J M Benlloch-Rodríguez  12 F I G M Borges  14 A Brodolin  12   15 N Byrnes  2 S Cárcel  16 J V Carrión  16 S Cebrián  17 E Church  9 L Cid  13 C A N Conde  14 T Contreras  1 F P Cossío  7   12 E Dey  2 G Díaz  18 T Dickel  10 M Elorza  12 J Escada  14 R Esteve  5 R Felkai  8   19 L M P Fernandes  20 P Ferrario  12   21 A L Ferreira  11 F W Foss  22 E D C Freitas  20 Z Freixa  7   21 J Generowicz  12 A Goldschmidt  23 J J Gómez-Cadenas  12   21 R González  12 J Grocott  3 K Hafidi  4 J Hauptman  24 C A O Henriques  20 J A Hernando Morata  18 P Herrero-Gómez  25 V Herrero  5 C Hervés Carrete  18 Y Ifergan  8 L Labarga  26 L Larizgoitia  12 A Larumbe  6 P Lebrun  27 F Lopez  12 N López-March  16 R Madigan  22 R D P Mano  20 A P Marques  14 J Martín-Albo  16 G Martínez-Lema  8 M Martínez-Vara  12 Z E Meziani  4 R L Miller  22 K Mistry  2 J Molina-Canteras  6 F Monrabal  12   21 C M B Monteiro  20 F J Mora  5 J Muñoz Vidal  16 P Novella  16 A Nuñez  13 D R Nygren  2 E Oblak  12 J Palacio  13 B Palmeiro  3 A Para  27 I Parmaksiz  2 J Pelegrin  12 M Pérez Maneiro  18 M Querol  16 A B Redwine  8 J Renner  18 I Rivilla  12   21 J Rodríguez  5 C Rogero  15 L Rogers  4 B Romeo  12 C Romo-Luque  16 F P Santos  14 J M F Dos Santos  20 I Shomroni  25 A Simón  12 S R Soleti  12 M Sorel  16 J Soto-Oton  16 J M R Teixeira  20 J F Toledo  5 J Torrent  12   28 A Trettin  3 A Usón  16 J F C A Veloso  11 J Waiton  3 J T White  29
Affiliations

Demonstration of event position reconstruction based on diffusion in the NEXT-white detector

J Haefner et al. Eur Phys J C Part Fields. 2024.

Abstract

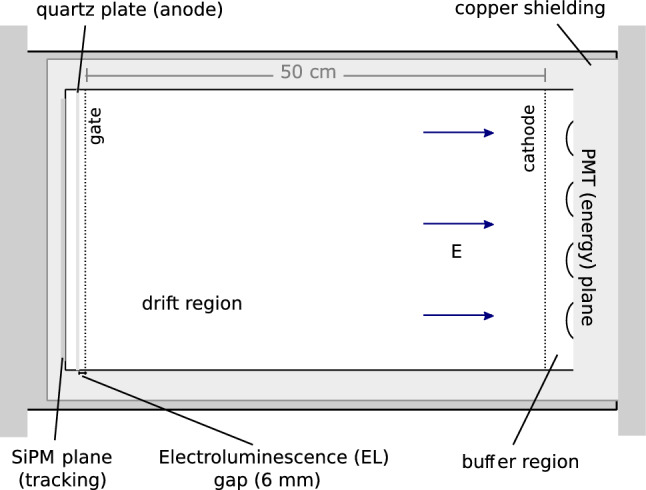
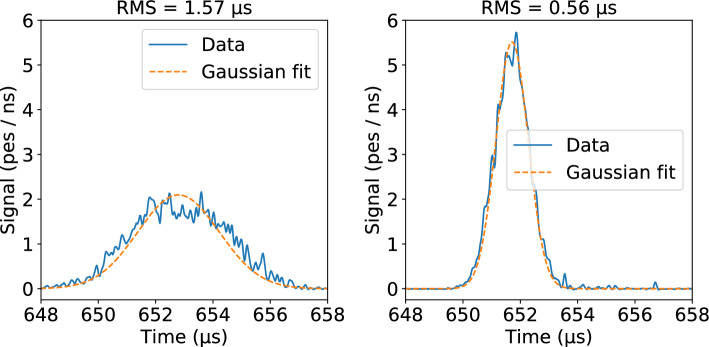
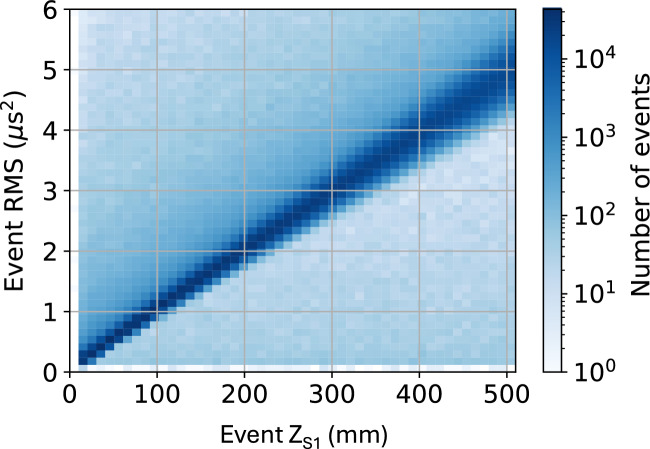
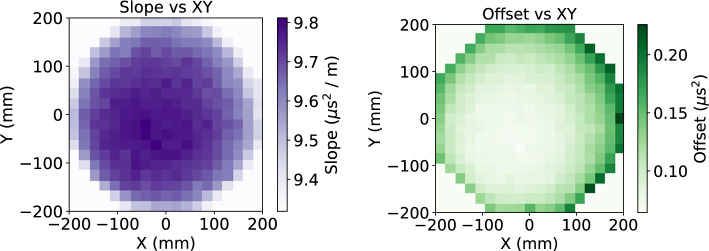
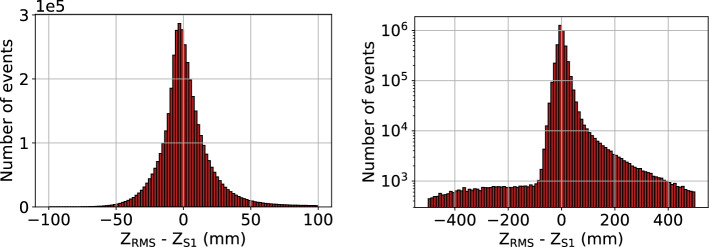
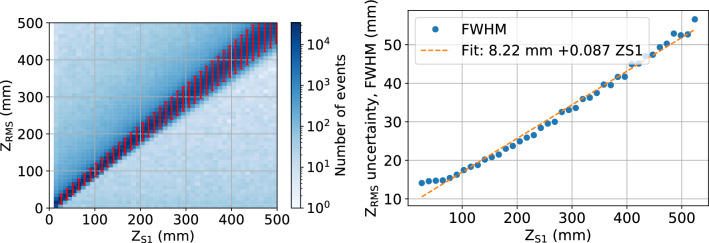
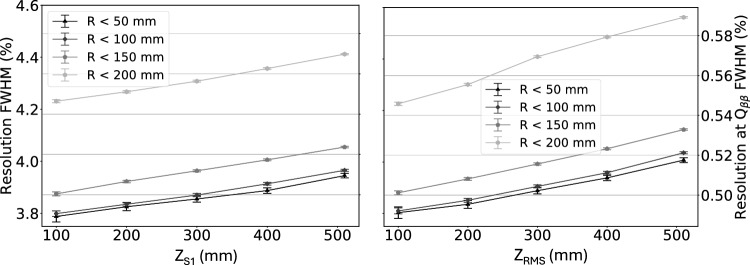
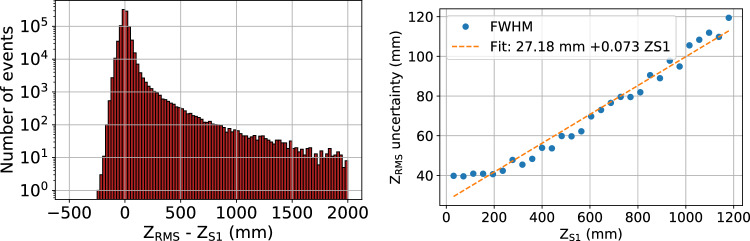
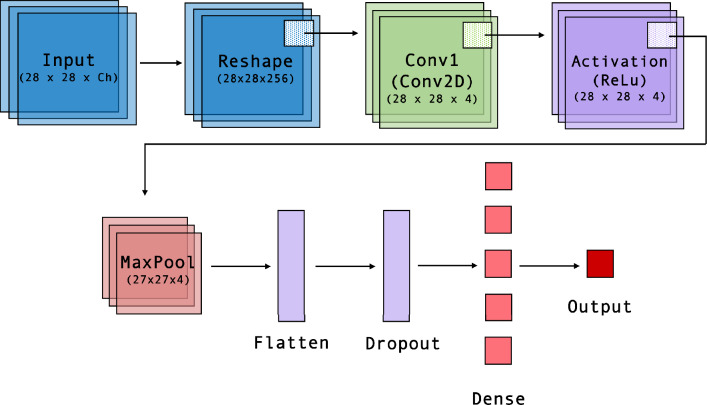
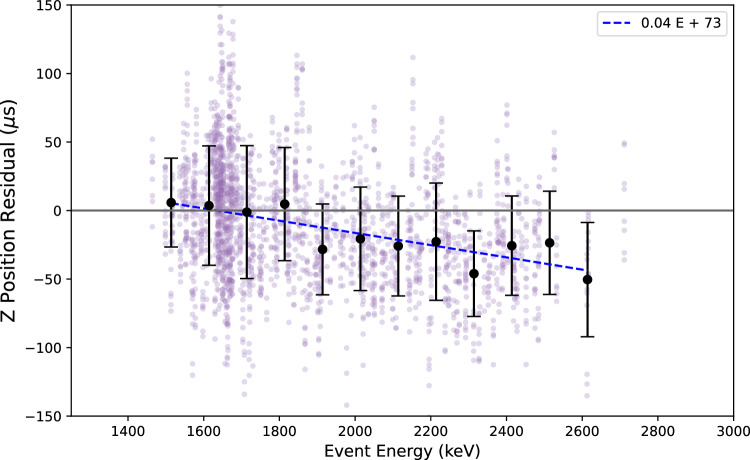
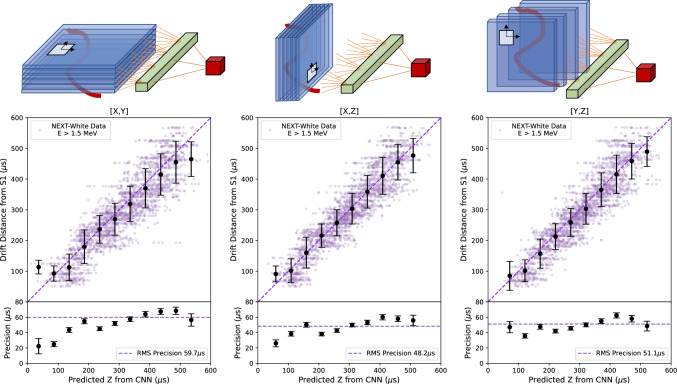
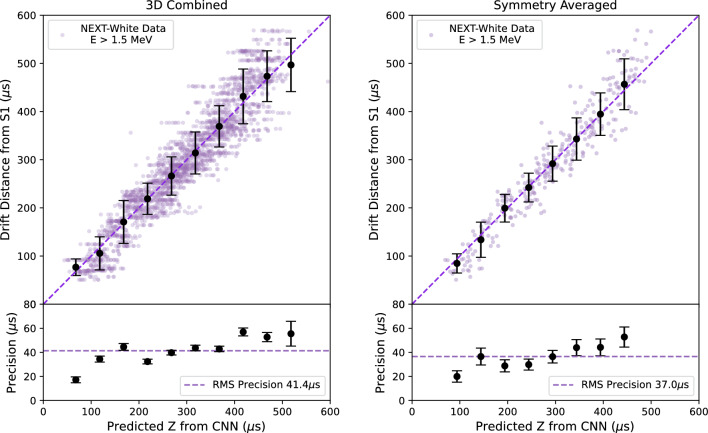
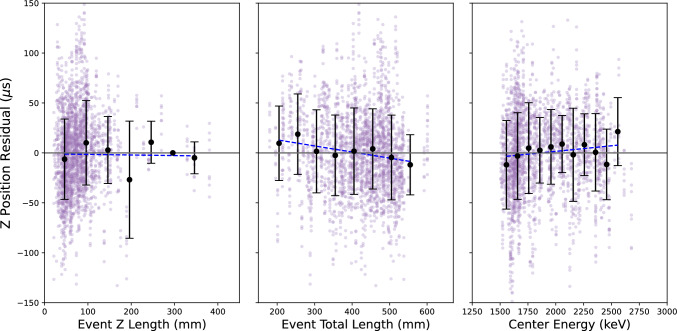
Noble element time projection chambers are a leading technology for rare event detection in physics, such as for dark matter and neutrinoless double beta decay searches. Time projection chambers typically assign event position in the drift direction using the relative timing of prompt scintillation and delayed charge collection signals, allowing for reconstruction of an absolute position in the drift direction. In this paper, alternate methods for assigning event drift distance via quantification of electron diffusion in a pure high pressure xenon gas time projection chamber are explored. Data from the NEXT-White detector demonstrate the ability to achieve good position assignment accuracy for both high- and low-energy events. Using point-like energy deposits from 83mKr calibration electron captures (E45 keV), the position of origin of low-energy events is determined to 2 cm precision with bias <1mm. A convolutional neural network approach is then used to quantify diffusion for longer tracks (E1.5 MeV), from radiogenic electrons, yielding a precision of 3 cm on the event barycenter. The precision achieved with these methods indicates the feasibility energy calibrations of better than 1% FWHM at Qββ in pure xenon, as well as the potential for event fiducialization in large future detectors using an alternate method that does not rely on primary scintillation.


Figures

Fig. 1
Fig. 1
Schematic of the EL-based TPC developed by the NEXT collaboration for neutrinoless double beta decay searches in 136Xe, from [20]
Fig. 2
Fig. 2
Two examples of 83mKr events as a function of time, where signals from all 12 PMTs are summed, overlaid with Gaussian fit with width fixed to calculated RMS value. Time widths of events as measured by root mean squared indicated above the corresponding plots
Fig. 3
Fig. 3
The square of the longitudinal root mean squared (RMS2) width of 83mKr events as a function of the z position obtained from the S1 signal in the NEXT-White detector. A clear linear relationship between the two is observed, as expected
Fig. 4
Fig. 4
Linear fit parameters of 83mKr event RMS2 as a function of z (from S1) in NEXT-White for different x and y locations. Left: Slope of the linear fit, corresponding to diffusion. Right: Offset of the linear fit, corresponding to typical width of 83mKr event at z =0 mm. A clear dependence of both parameters with x and y is seen
Fig. 5
Fig. 5
Differences between z positions determined by RMS (zRMS) and determined from S1 (zS1) for 83mKr events in NEXT-White, shown in linear (left) and log (right) scales
Fig. 6
Fig. 6
Left: z position estimated from width (zRMS) in function of the z position assigned from S1 (zS1) for 83mKr events in NEXT-White. Red uncertainties, representing FWHM of zRMS in a given zS1 range, are overlaid. Right: FWHM of zRMS as a function of zS1 in NEXT-White, with a linear fit, understood as the increase in uncertainty of the zRMS with zS1
Fig. 7
Fig. 7
Energy resolution for 83mKr events as a function of zS1 in NEXT-White, for regions of varying maximum distance from central axis R. Left axis indicates resolution in FWHM / 41.5 keV for both data sets, and right axis is matched to left axis to indicate resolution extrapolated to Qββ for both data sets. Volumes are overlapping, with zS1=300mm including all points with z300mm, for example. Left: Energy resolution calculated using zS1. Right: Energy resolution calculated using zRMS
Fig. 8
Fig. 8
NEXT-100 simulation. Left: Differences between z position determined by RMS (zRMS) and determined from S1 (zS1) for 83mKr events shown in log scale. Right: FWHM of zRMS as a function of zS1 with a linear fit, understood as the increase in uncertainty of the zRMS with zS1
Fig. 9
Fig. 9
Distribution of mean squared (RMS2) widths of 83mKr events, with boundary lines indicating corresponding minimum and maximum z values of the detector as determined from the distributions as described in the text. Left: NEXT-White data. Right: NEXT-100 simulation
Fig. 10
Fig. 10
Distribution of differences between position of 83mKr events as assigned using the linear correlation between RMS2 as a function of z from S1 (zRMS,S1) and as assigned purely referencing the cutoffs of the RMS2 distribution and the known detector boundaries in z (zRMS,bndry), as described in the text. Left: NEXT-White data. Right: NEXT-100 simulation
Fig. 11
Fig. 11
Network architecture for XY plane configuration. For all three planes, XY, YZ, and XZ a sequential model is constructed. A permute layer is added to models YZ and XZ for dimensional order. Key features are extracted from the Input to the MaxPool layers, and classification based on these features occurs from the Flatten to Output layers
Fig. 12
Fig. 12
Representation of the original uncalibrated event (left), the event after S1 calibration (middle), and the event post-diffusion calibration (right), projected onto the x-z plane. The effects of these corrections are notably rather small
Fig. 13
Fig. 13
Measurement of energy bias on z residuals as a function of center energy. The best fit line in blue is used to correct events based on their center energy after initial z-placement by the neural network
Fig. 14
Fig. 14
Top: Cartoon illustrating the projections for each of the convolutional network outputs (left: XY, middle: XZ, right: YZ). In the 2D convolutional layers with filters, the focus is on capturing the diffusion effect locally around the track signature. This information is then combined onto the output node through a dense layer, as depicted in Fig. 11. Bottom: Correlation between drift distance from S1 and predicted z from CNN for each projection. The purple points represent the barycenter of NEXT-White data events, while the black points represent the mean for each binned slice, with error bars indicating the standard deviation. The purple diagonal dashed line illustrates an ideal prediction, for reference. The lower panels display precision, represented by the size of the standard deviation, with the RMS precision shown by the dashed horizontal line
Fig. 15
Fig. 15
Correlation between drift distance from S1 and predicted z from CNN. The purple points represent the barycenter of NEXT-White data events, while the black points represent the mean for each binned slice, with error bars indicating the standard deviation. The dashed lines have the same interpretation as in Fig. 14. Left: The average of all 3 convolutional network configurations. Right: Average obtained from the eight symmetry transformations to the events from the plot on the left
Fig. 16
Fig. 16
Tests for biases in the event z precision as a function of event characteristic shape and energy: (left) z-extent, (middle) total event length, and (right) true event energy. The purple points indicate NEXT-White events after CNN application and center energy correction. The black points represent the mean for each binned slice, with error bars indicating the standard deviation. The blue dashed line represents the fit of all the black points

References

    1. NEXT Collaboration, P. Novella et al., Measurement of the 136Xe two-neutrino double beta decay half-life via direct background subtraction in NEXT. arXiv:2111.11091
    1. EXO Collaboration, G. Anton et al., Search for neutrinoless double-β decay with the complete EXO-200 dataset. Phys. Rev. Lett. 123 (2019). arXiv:1906.02723 - PubMed
    1. nEXO Collaboration, G. Adhikari et al., nEXO: neutrinoless double beta decay search beyond 1028 year half-life sensitivity. J. Phys. G Nucl. Part. Phys. 49: 015104 (2021). arXiv:2106.16243
    1. PandaX Collaboration, Y. Meng et al., Dark matter search results from the PandaX-4T commissioning run. Phys. Rev. Lett. 127 (2021). arXiv:2107.13438 - PubMed
    1. Aprile E , Aalbers J, Agostini F, Alfonsi M, Amaro F, Anthony M, Antunes B, Arneodo F, Balata M, Barrow P, et al. The xenon1t dark matter experiment. Eur. Phys. J. C. 2017;77(12):1–23.