

An integrated microfluidic platform for nucleic acid testing
- PMID: 38784376
- PMCID: PMC11111744
- DOI: 10.1038/s41378-024-00677-6
An integrated microfluidic platform for nucleic acid testing
Abstract
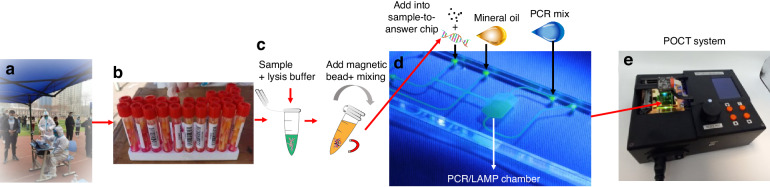
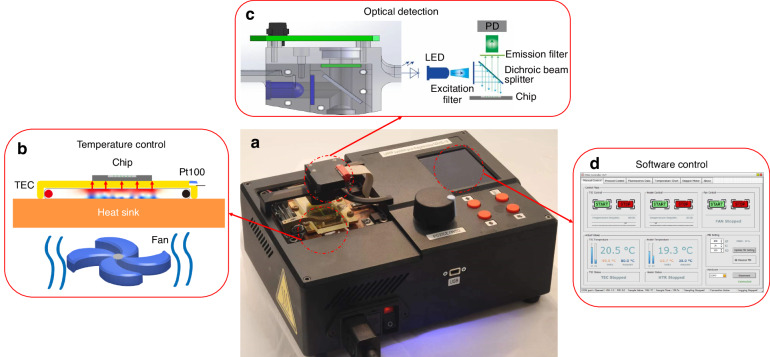
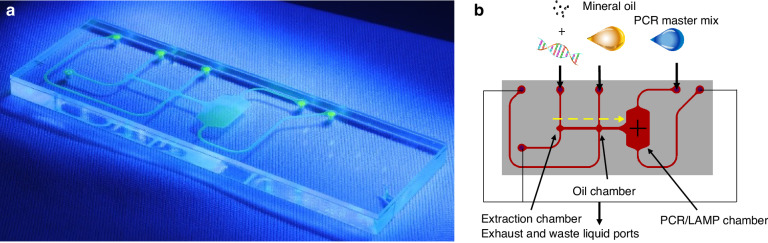
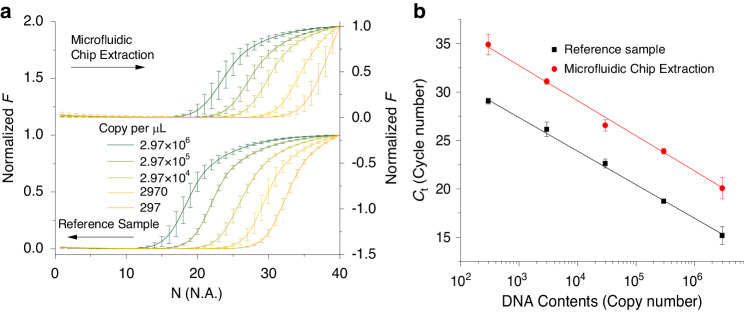
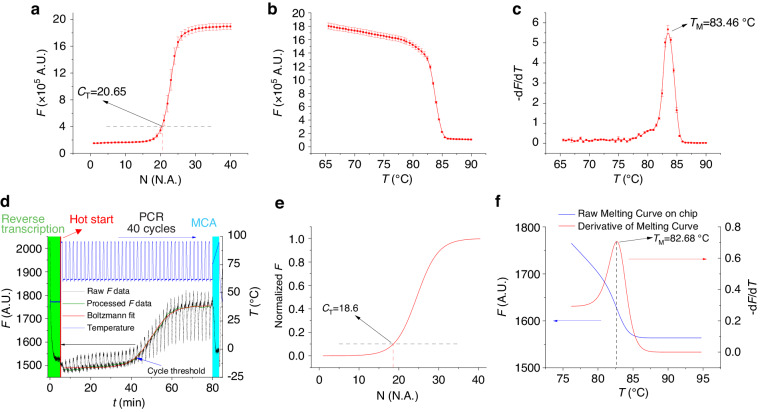
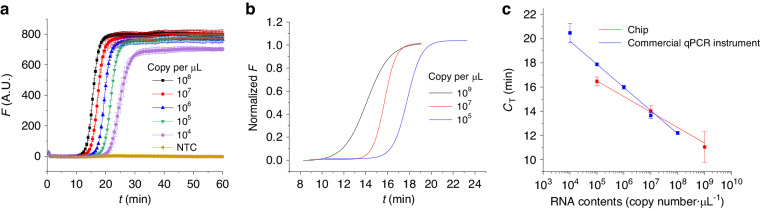
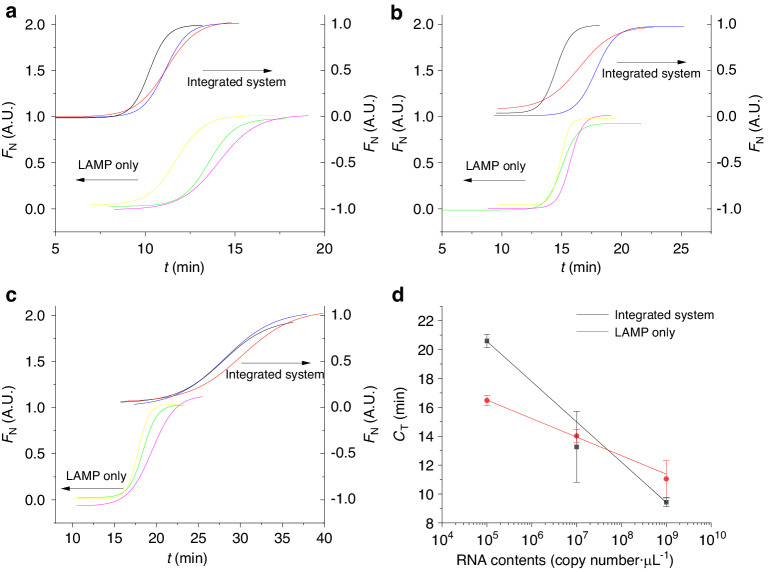
This study presents a rapid and versatile low-cost sample-to-answer system for SARS-CoV-2 diagnostics. The system integrates the extraction and purification of nucleic acids, followed by amplification via either reverse transcription-quantitative polymerase chain reaction (RT-qPCR) or reverse transcription loop-mediated isothermal amplification (RT-LAMP). By meeting diverse diagnostic and reagent needs, the platform yields testing results that closely align with those of commercial RT-LAMP and RT‒qPCR systems. Notable advantages of our system include its speed and cost-effectiveness. The assay is completed within 28 min, including sample loading (5 min), ribonucleic acid (RNA) extraction (3 min), and RT-LAMP (20 min). The cost of each assay is ≈ $9.5, and this pricing is competitive against that of Food and Drug Administration (FDA)-approved commercial alternatives. Although some RNA loss during on-chip extraction is observed, the platform maintains a potential limit of detection lower than 297 copies. Portability makes the system particularly useful in environments where centralized laboratories are either unavailable or inconveniently located. Another key feature is the platform's versatility, allowing users to choose between RT‒qPCR or RT‒LAMP tests based on specific requirements.
Keywords: Chemistry; Electrical and electronic engineering; Microfluidics.
© The Author(s) 2024.
Conflict of interest statement
Conflict of interestThe authors declare no competing interests.
Figures
Similar articles
-
Automated sample-to-answer centrifugal microfluidic system for rapid molecular diagnostics of SARS-CoV-2.Lab Chip. 2022 Aug 23;22(17):3157-3171. doi: 10.1039/d2lc00242f. Lab Chip. 2022. PMID: 35670202
-
Rapid and Extraction-Free Detection of SARS-CoV-2 from Saliva by Colorimetric Reverse-Transcription Loop-Mediated Isothermal Amplification.Clin Chem. 2021 Jan 30;67(2):415-424. doi: 10.1093/clinchem/hvaa267. Clin Chem. 2021. PMID: 33098427 Free PMC article.
-
Validation of a single-step, single-tube reverse transcription loop-mediated isothermal amplification assay for rapid detection of SARS-CoV-2 RNA.J Med Microbiol. 2020 Sep;69(9):1169-1178. doi: 10.1099/jmm.0.001238. Epub 2020 Jul 31. J Med Microbiol. 2020. PMID: 32755529 Free PMC article.
-
Loop-Mediated Isothermal Amplification (LAMP): A Rapid, Sensitive, Specific, and Cost-Effective Point-of-Care Test for Coronaviruses in the Context of COVID-19 Pandemic.Biology (Basel). 2020 Jul 22;9(8):182. doi: 10.3390/biology9080182. Biology (Basel). 2020. PMID: 32707972 Free PMC article. Review.
-
Current Trends in RNA Virus Detection via Nucleic Acid Isothermal Amplification-Based Platforms.Biosensors (Basel). 2024 Feb 11;14(2):97. doi: 10.3390/bios14020097. Biosensors (Basel). 2024. PMID: 38392016 Free PMC article. Review.
Cited by
-
Miniaturized electrophoresis: An integrated microfluidic cartridge with functionalized hydrogel-assisted LAMP for sample-to-answer analysis of nucleic acid.Biomicrofluidics. 2024 Dec 4;18(6):064104. doi: 10.1063/5.0211812. eCollection 2024 Dec. Biomicrofluidics. 2024. PMID: 39649103
-
Integrated microfluidic cartridge for rapid and colorimetric detection of Mycoplasma pneumoniae.Mikrochim Acta. 2025 Aug 6;192(9):559. doi: 10.1007/s00604-025-07377-6. Mikrochim Acta. 2025. PMID: 40767967
-
Microfluidics chips fabrication techniques comparison.Sci Rep. 2024 Nov 20;14(1):28793. doi: 10.1038/s41598-024-80332-2. Sci Rep. 2024. PMID: 39567624 Free PMC article.
-
Isothermal nucleic acid amplification for monitoring hand-foot-and-mouth disease: current status and future implications.Mikrochim Acta. 2024 Dec 25;192(1):31. doi: 10.1007/s00604-024-06899-9. Mikrochim Acta. 2024. PMID: 39720958 Review.
-
Rapid Amplification and Detection of Single-Stranded Nucleic Acids for Point-of-Care Diagnosis.Small Methods. 2025 Jun;9(6):e2401733. doi: 10.1002/smtd.202401733. Epub 2025 Jan 6. Small Methods. 2025. PMID: 39763137 Free PMC article. Review.
References
-
- Kang T, Lu J, Yu T, Long Y, Liu G. Advances in nucleic acid amplification techniques (NAATs): COVID-19 point-of-care diagnostics as an example. Biosens. Bioelectron. 2022;206:114109. - PubMed
-
- Wu L, et al. Fluidic multivalent membrane nanointerface enables synergetic enrichment of circulating tumor cells with high efficiency and viability. J. Am. Chem. Soc. 2020;142:4800–4806. - PubMed
LinkOut - more resources
Full Text Sources
Miscellaneous