. 2024 May 19:17:2223-2239.
doi: 10.2147/IJGM.S454336. eCollection 2024.

Exploration of the Shared Gene Signatures and Molecular Mechanisms Between Ischemic Stroke and Atherosclerosis

Affiliations

Exploration of the Shared Gene Signatures and Molecular Mechanisms Between Ischemic Stroke and Atherosclerosis

Ru Ban et al. Int J Gen Med. .

Abstract

Purpose: Atherosclerosis (AS) is a chronic inflammatory vascular disease and the predominant cause of ischemic stroke (IS). AS is a potential pathogenetic factor in IS. However, the processes by which they interact remain unknown. The purpose of this paper was to investigate the shared gene signatures and putative molecular processes in AS and IS.

Methods: Gene Expression Omnibus (GEO) data for AS and IS microarrays were retrieved. The co-expression modules associated with AS and IS were identified using the Weighted Gene Co-Expression Network Analysis (WGCNA). We constructed an interaction network of shared differentially expressed genes in AS and IS and conducted an enrichment analysis using ClueGO software. We validated the results in a separate cohort through differential gene analysis. Additionally, we retrieved AS and IS-related miRNAs from the Human microRNA Disease Database (HMDD) and predicted their target genes using miRWalk. We then built a network of miRNAs-mRNAs-KEGG pathways using the shared genes.

Results: Through WGCNA, we identified five modules and six modules as significant in AS and IS, respectively. A ClueGO enrichment analysis of common genes showed that highly active CCR1 chemokine receptor binding is critical to AS and IS pathogenesis. The differential analysis expression results in another cohort closely matched these findings. The miRNA-mRNA network suggested that hsa-miR-330-5p, hsa-miR-143-3p, hsa-miR-16-5p, hsa-miR-152-3p might regulate the shared gene KRAS, which could be a key player in AS and IS.

Conclusion: We integrated ischemic stroke and carotid atherosclerosis public database data and found that ATF3, CCL3, CCL4, JUNB, KRAS, and ZC3H12A may affect both, making them novel biomarkers or therapeutic target genes. Clinical samples and expression trends supported our analyses of pivotal genes.

Keywords: atherosclerosis; biomarker; co-expression; ischemic stroke; risk factors.


Conflict of interest statement

The authors declare that there is no conflict of interest in this work.

Figures

Figure 1
Figure 1
The workflow chart of the study.
Figure 2
Figure 2
(A). Left: The cluster dendrogram of co-expression genes in GSE22255 (IS). Right: Module–trait relationships in IS. Each cell contains the corresponding correlation and p-value. (B) Left: The cluster dendrogram of co-expression genes in GSE9874 (AS). Right: Module–trait relationships in IS. Each cell contains the corresponding correlation and p-value.
Figure 3
Figure 3
The shared genes between Positive (A) and Negative (B) modules in AS and IS.
Figure 4
Figure 4
The DEGs of GSE9874 (A) and GSE22255 (B). The blue and red dots represent DEGs filtered based on the cutoff criteria of adjusted |log2 (fold change)| >0.5 and FDR < 0.05, While the grey dots represent genes that do not satisfy the cutoff criteria.
Figure 5
Figure 5
Comparison Venn of DEGs in AS and IS. The graph on the left shows up-regulated genes and the graph on the right shows down-regulated genes.
Figure 6
Figure 6
PPI network of shared DEGs.Green and pink nodes represent downregulated and upregulated shared DEGs.
Figure 7
Figure 7
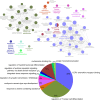
The interaction network of GO terms generated by the Cytoscape plug-in ClueGO and the significant term of each group is highlighted; Proportion of each GO terms group in the total.
Figure 8
Figure 8
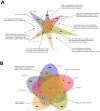
Venn display of top 20 genes based on Degree, MCC (Maximal Clique Centrality), MNC (Maximum Neighborhood Component), EPC (Edge Percolated Component).
Figure 9
Figure 9
miRNA-6 hub genes-KEGG pathway network. Red, yellow nodes represent 6 DEGs and related miRNAs, blue and green nodes represent 6 genes related to KEGG and overlapped 9 KEGG pathways; the Green line represents miRNA-KEGG, the grey line represents miRNA-DEGs, the red line represents KRAS- overlapped 9 KEGG pathways.
Figure 10
Figure 10
miRNA-KRAS-KEGG pathway network. Red, yellow nodes represent KRAS and AS or IS-related miRNAs, green nodes represent overlapped KEGG pathways; the Green line represents miRNA-KEGG, the grey line represents miRNA-DEGs, the red line represents KRAS- overlapped 9 KEGG pathways.
Figure 11
Figure 11
Six hub genes expression levels in IS-related datasets (GSE22255 and GSE16561) (A) and AS-related datasets (GSE9874 and GSE23746) (B). * p<0.05, ** p<0.01, ***p<0.001.
Figure 12
Figure 12
In vivo verification Relative Expression. Levels of Hub Genes in Patients Clinically Diagnosed with IS (A) and AS (B). * p<0.05, ** p<0.01, ***p<0.001.

References

    1. Barrett T, Troup DB, Wilhite SE, et al. Ncbi Geo: mining Tens of Millions of Expression Profiles--Database and Tools Update. Nucleic Acids Res. 2007;35(Database issue):D760–5. doi:10.1093/nar/gkl887 - DOI - PMC - PubMed
    1. Hägg DA, Jernås M, Wiklund O, et al. Expression Profiling of Macrophages from Subjects with Atherosclerosis to Identify Novel Susceptibility Genes. IntJ Mol Med. 2008;21(6):697–704. - PubMed
    1. Krug T, Gabriel JP, Taipa R, et al. Ttc7b Emerges as a Novel Risk Factor for Ischemic Stroke through the Convergence of Several Genome-Wide Approaches. J Cereb Blood Flow Metab. 2012;32(6):1061–1072. doi:10.1038/jcbfm.2012.24 - DOI - PMC - PubMed
    1. Barr TL, Conley Y, Ding J, et al. Genomic Biomarkers and Cellular Pathways of Ischemic Stroke by Rna Gene Expression Profiling. Neurology. 2010;75(11):1009–1014. doi:10.1212/WNL.0b013e3181f2b37f - DOI - PMC - PubMed
    1. O’Connell GC, Treadway MB, Petrone AB, et al. Peripheral Blood Akap7 Expression as an Early Marker for Lymphocyte-Mediated Post-Stroke Blood Brain Barrier Disruption. Sci Rep. 2017;7(1):1172. doi:10.1038/s41598-017-01178-5 - DOI - PMC - PubMed