. 2024 May 11:26:101087.
doi: 10.1016/j.mtbio.2024.101087. eCollection 2024 Jun.

Cupric-polymeric nanoreactors integrate into copper metabolism to promote chronic diabetic wounds healing

Affiliations

Cupric-polymeric nanoreactors integrate into copper metabolism to promote chronic diabetic wounds healing

Qi Tang et al. Mater Today Bio. .

Abstract

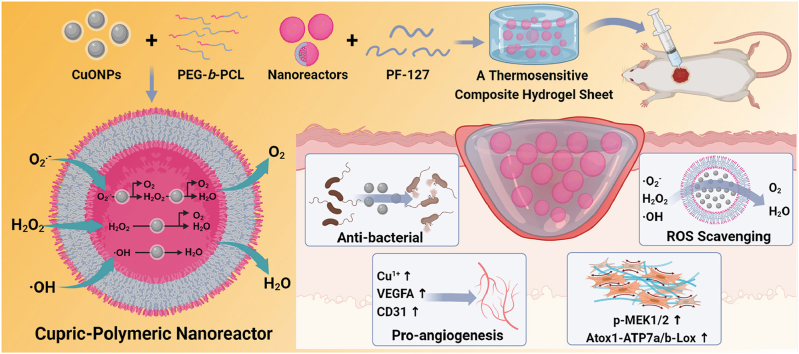
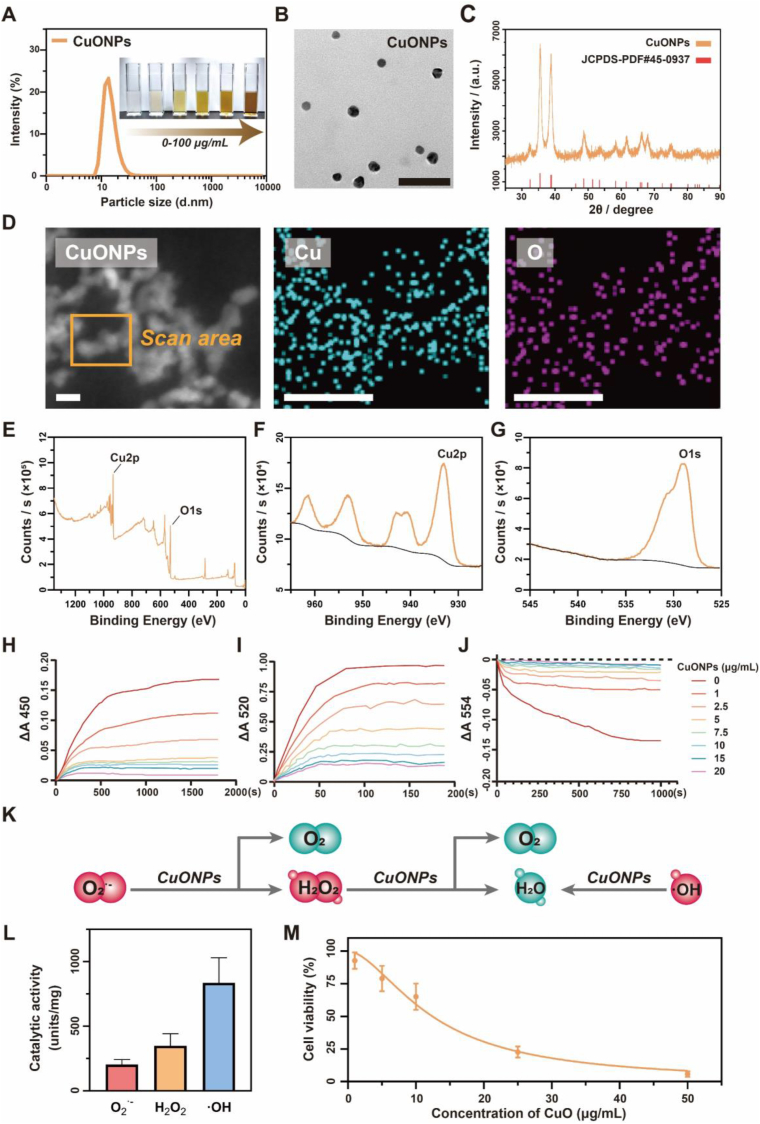
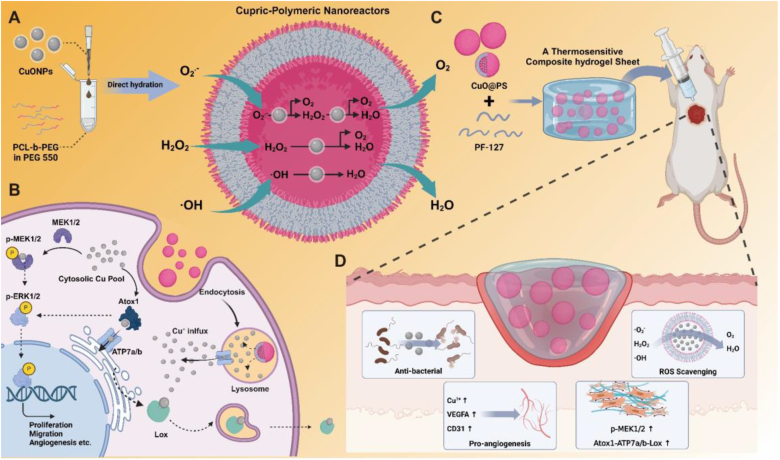
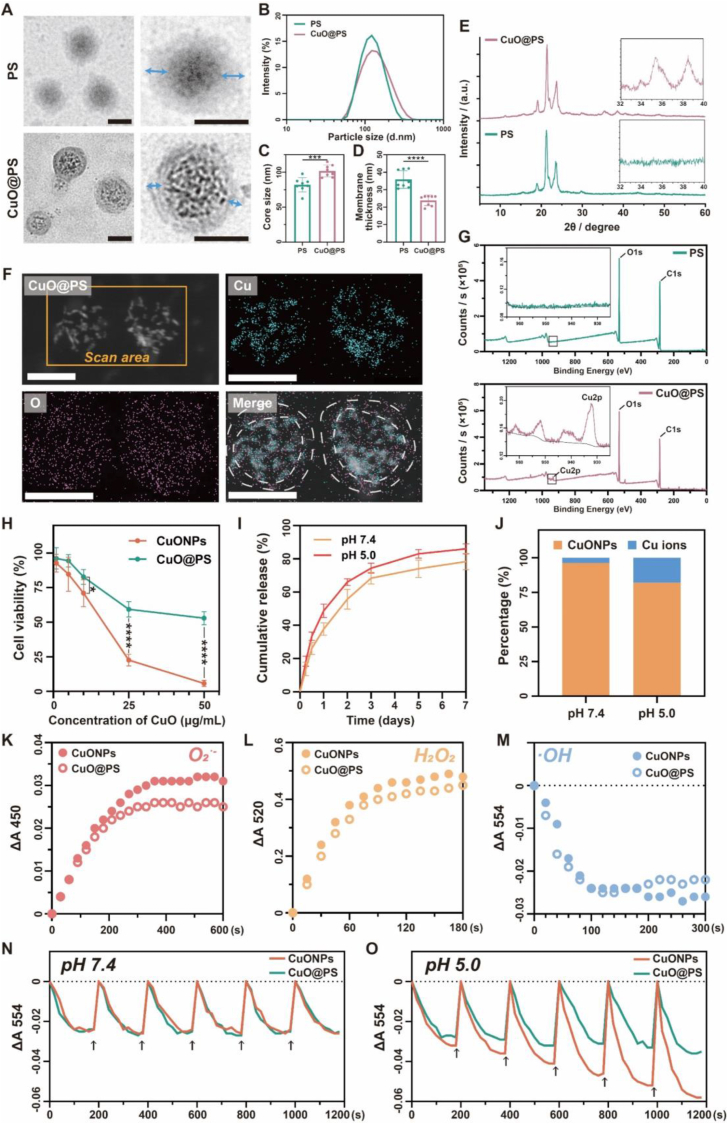
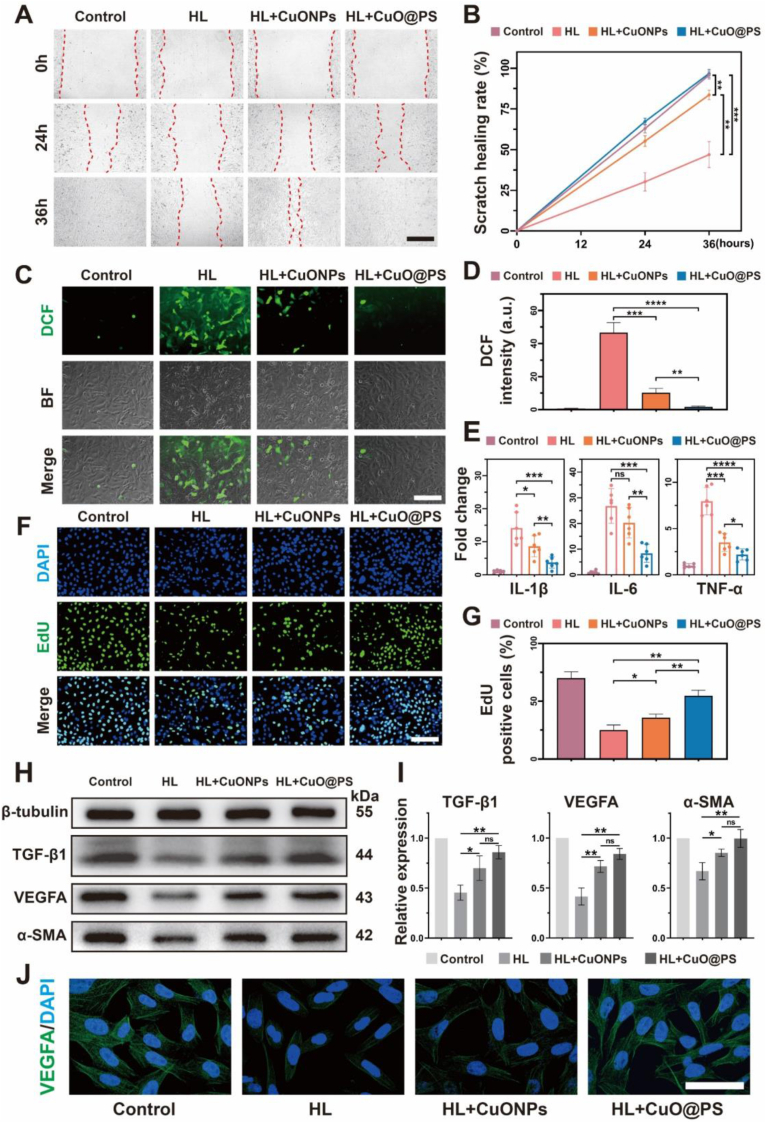
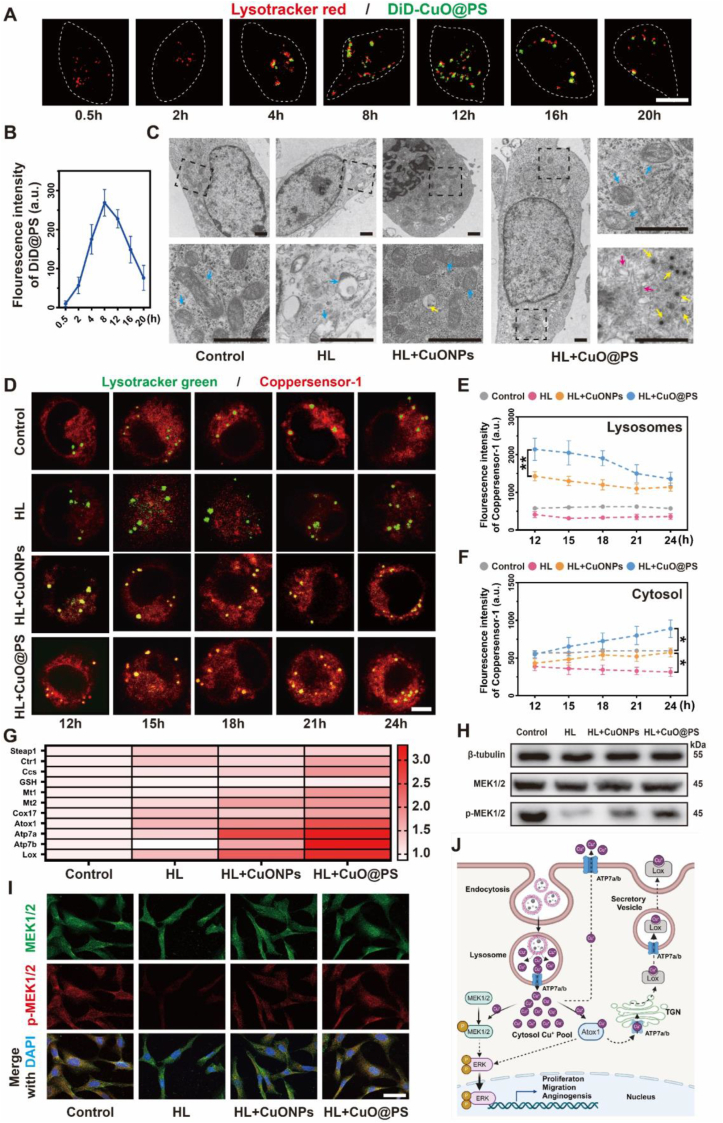
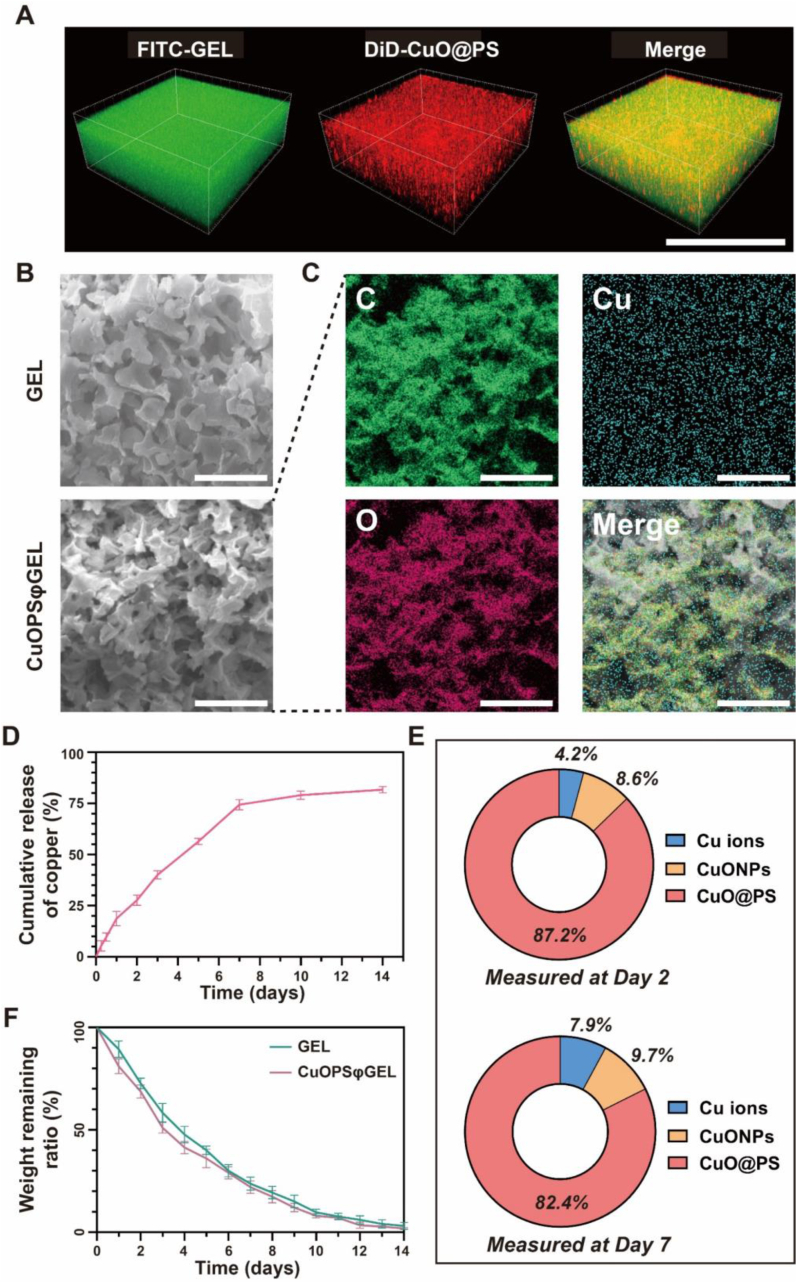
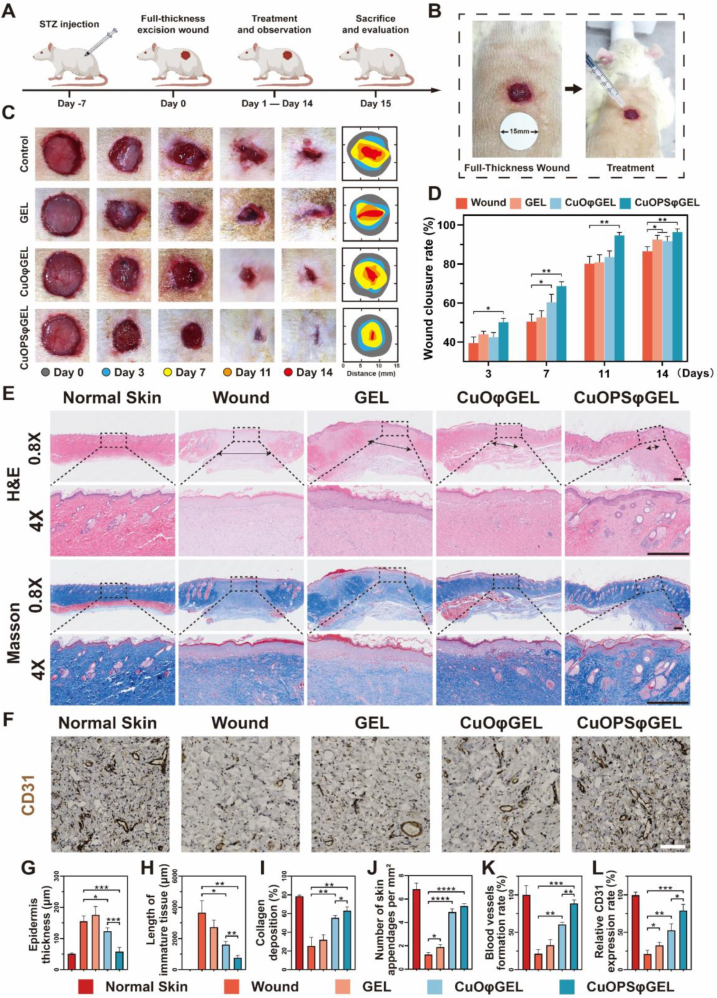
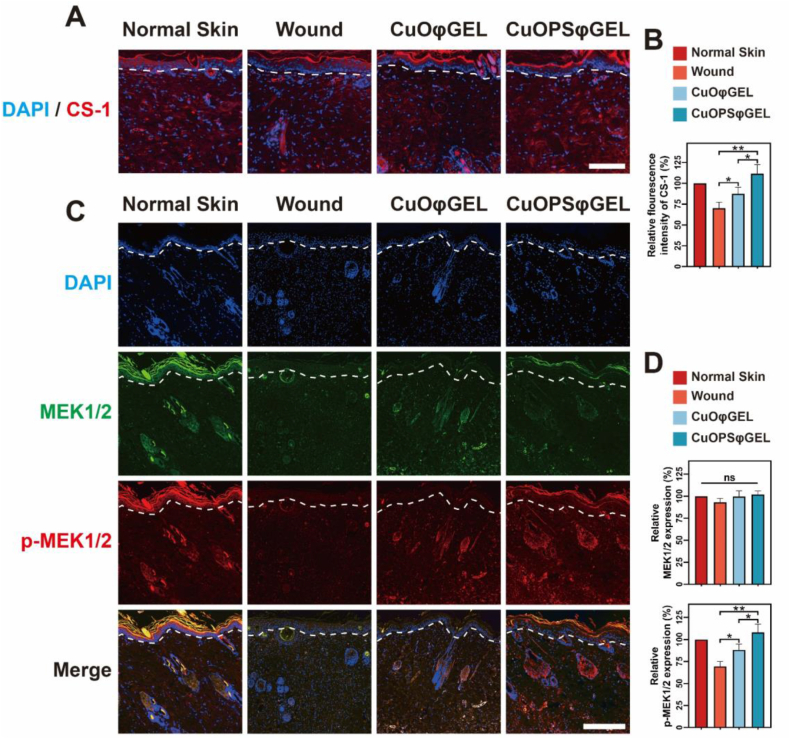
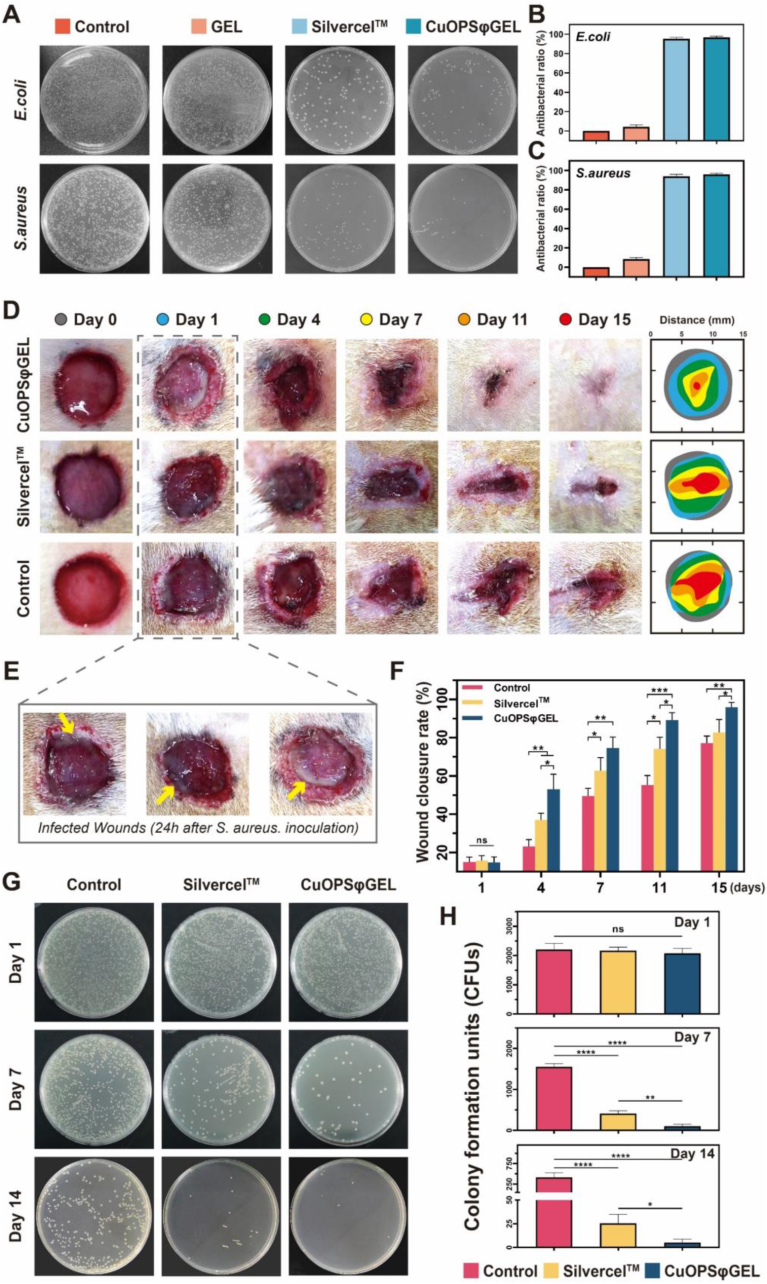
Given multifunction of copper (Cu) contributing to all stages of the physiology of wound healing, Cu-based compounds have great therapeutic potentials to accelerate the wound healing, but they must be limited to a very low concentration range to avoid detrimental accumulation. Additionally, the cellular mechanism of Cu-based compounds participating the healing process remains elusive. In this study, copper oxide nanoparticles (CuONPs) were synthesized to mimic the multiple natural enzymes and trapped into PEG-b-PCL polymersomes (PS) to construct cupric-polymeric nanoreactors (CuO@PS) via a direct hydration method, thus allowing to compartmentalize Cu-based catalytic reactions in an isolated space to improve the efficiency, selectivity, recyclability as well as biocompatibility. While nanoreactors trafficked to lysosomes following endocytosis, the released Cu-based compounds in lysosomal lumen drove a cytosolic Cu+ influx to mobilize Cu metabolism mostly via Atox1-ATP7a/b-Lox axis, thereby activating the phosphorylation of mitogen-activated protein kinase 1 and 2 (MEK1/2) to initiate downstream signaling events associated with cell proliferation, migration and angiogenesis. Moreover, to facilitate to lay on wounds, cupric-polymeric nanoreactors were finely dispersed into a thermosensitive Pluronic F127 hydrogel to form a composite hydrogel sheet that promoted the healing of chronic wounds in diabetic rat models. Hence, cupric-polymeric nanoreactors represented an attractive translational strategy to harness cellular Cu metabolism for chronic wounds healing.

Keywords: Atox1-ATP7a/b-Lox axis; Chronic wound healing; Copper metabolism; Cupric-polymeric nanoreactors; MEK1/2 phosphorylation.


Conflict of interest statement

The authors declare that they have no known competing financial interests or personal relationships that could have appeared to influence the work reported in this paper.

Figures

Image 1
Graphical abstract
Fig. 1
Fig. 1
CuONPs displayed multienzymatic activities but associated with high toxicity. (A) Size distribution of CuONPs was measured by dynamic light scattering (DLS), and the inset digital photograph showing dispersity of CuONPs in aqueous solution at concentrations of 1, 5, 25, 50, 75 and 100 μg/mL. (B) Representative transmission electron microscopy (TEM) image of CuONPs. Scale bar, 50 nm. (C) XRD powder diffraction pattern of CuONPs. (D) HAADF-STEM and EDS mapping images for CuONPs. Cu (cyan), O (magenta). Scale bar, 20 nm. (EG) Survey XPS spectrum of CuONPs (E), and the high-resolution XPS spectra of Cu 2p (F) and O 1s (G). (HJ) The absorbance changes of CuONPs incubated with WST-8 formazan at 450 nm (H), benzoquinone monoamine derivative at 520 nm (I), or unoxidized rhodamine B at 554 nm (J), which quantitatively reflects the amounts of O2•- H2O2, or •OH, respectively. (K) Schematic illustration of CuONPs exhibiting scavenging abilities to remove the main free radicals derived from oxygen. (L) The scavenging efficiency of CuONPs (5 μg/mL) for O2•-, H2O2 and •OH. (M) Viability of NIH-3T3 cells after incubated CuONPs at varying concentrations for 24 h. Three independent experiments were conducted for each result. All Data were presented as mean ± SD (n = 3 independent samples). (For interpretation of the references to color in this figure legend, the reader is referred to the Web version of this article.)
Scheme 1
Scheme 1
(A) Preparation of cupric-polymeric nanoreactors (CuO@PS) via a direct hydration method for in situ cascade catalytic reactions. (B) Cu+ released from lysosomal CuO@PS integrate into cytosolic Atox1-ATP7a/b-Lox axis, leading to direct and indirect activation of MEK1/2 signaling pathway. (C) Fabrication process of a thermosensitive hydrogel sheet CuOPSφGEL. (D) Multifunction of CuOPSφGEL contributing to the chronic wound healing.
Fig. 2
Fig. 2
Characterization of cupric-polymeric nanoreactors. (A) Representative TEM images of PEG-b-PCL polymersomes (PS) and CuONPs-encapsulated polymersomes (CuO@PS), and blue arrows indicating the thickness of polymeric membranes. Scale bar, 100 nm. (B) Size distribution of PS and CuO@PS. (CD) Quantification of core diameter (C) and membrane thickness (D) from eight polymersomes randomly selected from TEM images. (E) XRD powder diffraction pattern of CuO@PS and PS in wide range. The inset figures indicated the high-resolution XRD patterns at 2θ range from 32° to 40°. (F) HAADF-STEM and EDS mapping images for CuO@PS. Cyan represents Cu signals, while magenta indicates O signals. White dash line shows the area of polymeric membrane in the merged image. Scale bar, 100 nm. (G) Survey XPS spectra of PS and CuO@PS. The inset figures show the high-resolution XPS spectrum of Cu 2p. (H) Cytotoxicity of NIH-3T3 cells after treated with different concentrations of CuONPs or CuO@PS for 24 h. At each concentration point, CuO@PS and unencapsulated CuONPs had equal weight concentrations of CuONPs. (I) In vitro copper release profile of CuO@PS at pH 7.4 or pH 5.0. (J) The amounts of CuONPs and Cu ions released from CuO@PS over 48 h at pH 7.4 or pH 5.0, respectively. (KM) Time-dependent absorbance changes of WST-8 formazan at 450 nm (K), benzoquinone monoamine derivative at 520 nm (L), or unoxidized rhodamine B at 554 nm (M) in the presence of CuONPs or CuO@PS both at a CuONPs concentration of 5 μg/mL to quantify the unreacted O2•-, H2O2 and •OH. (N, O) Cycling performance of CuONPs or CuO@PS to remove •OH both at a CuONPs concentration of 5 μg/mL at pH 7.4 (N) or pH 5.0 (O). Black arrows indicate the time points to introduce •OH into reactions and each cycle lasts for 200 s. Three independent experiments were conducted for each result. Data represent mean ± SD. *p < 0.05, ***p < 0.001, ****p < 0.0001. (For interpretation of the references to color in this figure legend, the reader is referred to the Web version of this article.)
Fig. 3
Fig. 3
Cupric-polymeric nanoreactors promoted cell migration and exerted antioxidant, anti-inflammatory, proliferative, and angiogenic effects in cells. NIH-3T3 cells were stimulated with 500 μM of H2O2 and 500 ng/mL of LPS (HL) for 12 h, and further treated with CuONPs or CuO@PS both containing 5 μg/mL of CuONPs followed by different measurements. (A) Cell migration of NIH-3T3 cells affected by different treatments was monitored within 36 h. Scale bar, 400 μm. (B) The scratch healing rates were calculated by the changes in the scratch areas from each group (A) over time. (C) Intracellular ROS levels in cells detected by DCFH-DA assay with a confocal laser scanning microscopy (CLSM). Scale bar, 200 μm. (D) Quantitative analysis of intracellular ROS based on DCF fluorescence intensities. (E) mRNA expressions of IL-1β, IL-6 and TNF-α after various treatments. (F) EdU cell proliferation assay on NIH-3T3 cells with various treatments as described above. Scale bar, 200 μm. (G) EdU positive cell percentages representing proliferative cell rate under different treatments. (H–I) Western blot and quantification analysis of TGF-β1, VEGFA and α-SMA expressions in NIH-3T3 cells. β-tubulin was used as a loading control. (J) Immunofluorescence staining of VEGFA in HUVEC cells after different treatments. Scale bar, 60 μm. All data were shown as means ± SD. Three independent experiments were conducted for each result. ns, not significant, *p < 0.05, **p < 0.01, ***p < 0.001, ****p < 0.0001.
Fig. 4
Fig. 4
Cupric-polymeric nanoreactors influenced intracellular copper metabolism after endocytosis. (A) Representative CLSM images of H2O2 and LPS (HL) stimulated NIH-3T3 cells incubating with CuO@PS labeled by DiD (green) for varying time points. At predetermined time points, the lysosomes were stained with lysotracker (red) and immediately for image acquisition. Scale bar, 10 μm. (B) Quantitative analysis of fluorescence intensities of fluorescently labeled CuO@PS over time. 50–100 individual cells were randomly selected from each sample. (C) Representative TEM images of the ultrastructure of NIH-3T3 cells followed by different treatments for 12 h (yellow arrows: Cu-based nanoparticles in lysosomes; blue arrows: mitochondria; magenta arrows: trans-Golgi network). Scale bar, 1 μm. (D) Representative fluorescent images of intracellular Cu+ distribution. Upon exposure to HL stimulation for 12 h, NIH-3T3 cells were treated with CuONPs or CuO@PS both containing CuONPs concentrations of 5 μg/mL for 12 h, and then the cells were washed and detected with Cu+ probe Coppersensor-1 (CS-1, red) at different time points. Lysosomes were stained with lysotracker (green). Scale bar, 10 μm. (EF) Quantitative analysis of fluorescent intensities of Cu1+ in lysosomes and cytosol based on time-lapse images. For each sample, 50–100 individual cells were imaged and analyzed. (G) Heat map of the real-time quantitative PCR (qRT-PCR) analysis results of copper metabolism-related genes in NIH-3T3 cells after different treatments. (H) Western blot of MEK1/2 and phospho-MEK1/2 (p-MEK1/2) proteins in NIH-3T3 cells under different treatments. β-tubulin was used as a logading control. (I) Immunofluorescence staining of MEK1/2 and p-MEK1/2 in HUVEC cells after different treatments. Scale bar, 30 μm. (J) Schematic illustration of Cu+ derived from CuO@PS activating Atox1–ATP7a/b–Lox and MEK1/2 pathways involved in Cu metabolism. All experiments were performed in biological triplicates Results were presented as means ± SD. *p < 0.05. (For interpretation of the references to color in this figure legend, the reader is referred to the Web version of this article.)
Fig. 5
Fig. 5
Characterization of a composite hydrogel sheet (CuOPSφGEL) for chronic wound healing. CuOPSφGEL was formed by CuO@PS dispersed into 15 wt% of Pluronic F-127 (PF-127) hydrogel with a final CuONPs concentration of 50 μg/mL. (A) Three-dimensional fluorescent imaging of CuOPSφGEL after 7 days of storage at 37 °C by using CLSM. FITC (green) was used to label hydrophilic gel networks, while DiD (red) was used to label CuO@PS. Scale bar, 100 μm. (B) Morphological characterization of GEL and CuOPSφGEL by scanning electron microscopy (SEM). Scale bar, 40 μm. (C) Elemental distribution analysis of carbon (C), oxygen (O) and copper (Cu) in CuOPSφGEL using EDS mapping. Scale bar, 40 μm. (D) In vitro release profile of CuOPSφGEL within 14 days. (E) Pie chart showing the percentages of the amounts of CuO@PS, CuONPs and Cu ions released from CuOPSφGEL at day 2 and day 7. (F) Weight loss of 1 mL of GEL or CuOPSφGEL samples after immersion in 19 mL PBS at 37 °C over time. Results were shown as means ± SD. Three independent experiments were conducted for each result. (For interpretation of the references to color in this figure legend, the reader is referred to the Web version of this article.)
Fig. 6
Fig. 6
CuOPSφGEL promoted the chronic wound healing in diabetic rat models. (A) Scheme illustrating the establishments of excisional wounds on diabetic rats induced by streptozotocin (STZ), and the treatments of various hydrogel sheets for 14 days. (B) Photographs showing the full-thickness round excision wounds covered with CuOPSφGEL. (C) Representative photographs of the wounds following different treatments at varying days. (D) Wound closure rates from each group were measured at different days. (n = 6). (E) Representative 0.8 × and 4 × magnification of hematoxylin and eosin (H&E) and Masson's trichrome (Masson) staining of wound tissues after 14 days of different treatments. Black arrows in H&E images indicate the length of immature tissue. Scale bar, 500 μm. (F) Expressions of CD31 in wound tissues from different groups at day 14 detected by immunohistochemistry (IHC) staining. Scale bar, 100 μm. (GI) Quantitative analysis of epidermis thickness (G), length of immature tissue (H), collagen deposition rate (I), number of skin appendages (J), blood vessels formation rate (K) and CD31 expressions (L) of each group based on H&E staining (E) and IHC staining (F). Areas of 1 mm2 randomly selected from each group (n = 6) were used for analysis. Results were presented as means ± SD. *p < 0.05, **p < 0.01, ***p < 0.001, ****p < 0.0001.
Fig. 7
Fig. 7
Cu+ distribution and MEK1/2 expressions in wound tissues after various treatments. (A) Tissue distribution of Cu+ in wound tissues were probed by Coppersensor-1 (CS-1, red) after 24 h of treatments with different hydrogel sheets. White dashed lines indicate a boundary between epidermis and dermis. Scale bar, 200 μm. (B) Mean fluorescence intensities of CS-1 in the stained skins from each group (A) were determined by the analysis software (Image J). (C) Fluorescent staining of MEK1/2 (green) and p-MEK1/2 (red) in skin tissue sections of diabetic rats from each group. White dashed lines show a boundary between epidermis and dermis. Scale bar, 400 μm. (D) The relative expression levels of MEK1/2 (upper panel) and p-MEK1/2 (lower panel) were quantified based on fluorescent intensity analysis of (C). Cell nuclei were stained with DAPI (blue). Areas of 1 mm2 randomly selected from each group (n = 6) were used for quantitative analysis. Results were shown as means ± SD. ns, not significant, *p < 0.05, **p < 0.01. (For interpretation of the references to color in this figure legend, the reader is referred to the Web version of this article.)
Fig. 8
Fig. 8
CuOPSφGEL prevented the bacterial infections in diabetic chronic wounds. (A) In vitro antibacterial activities were estimated through which 1 mL of GEL or CuOPSφGEL containing 50 μg/mL of CuONPs were incubated with 200 μL of E. coli or S. aureus suspensions (106 CFU/mL) at 37 °C for 6 h, following by the CFU assay. One piece of Silvercel™ was used as positive control following the same procedure. (B–C) Antibacterial rates of various treatments were calculated by counting numbers of the bacterial colonies on agar plates as compared to the control plate incubated with 106 CFU/mL of E. coli or S. aureus suspensions from (A). (D) Representative photographs of the infected wounds upon exposure to various treatments over time. (E) Photographs showing the pus (yellow arrows) at wound sites after 24 h of S. aureus inoculation. (F) Wound closure rates were quantified based on the wound areas (D) over time. (G) Agar culture of wounds secretions (diluted 10−5 times with sterile PBS) from each rat at day 1, 7 and 14. (H) Quantitative analysis of CFUs on agars from (G). Data were presented as means ± SD. Three independent experiments were conducted for each result. *p < 0.05, **p < 0.01, ***p < 0.001, ****p < 0.0001. (For interpretation of the references to color in this figure legend, the reader is referred to the Web version of this article.)

Similar articles

Cited by

References

    1. Armstrong D.G., Tan T.-W., Boulton A.J.M., Bus S.A. Diabetic foot ulcers: a review. JAMA. 2023;330:62–75. - PMC - PubMed
    1. Falanga V., Isseroff R.R., Soulika A.M., Romanelli M., Margolis D., Kapp S., Granick M., Harding K. Chronic wounds. Nat. Rev. Dis. Prim. 2022;8:50. - PMC - PubMed
    1. Bowers S., Franco E. Chronic wounds: Evaluation and management. Am. Fam. Physician. 2020;101:159–166. - PubMed
    1. Frykberg R.G., Banks J. Challenges in the treatment of chronic wounds. Adv. Wound Care. 2015;4:560–582. - PMC - PubMed
    1. Brem H., Tomic-Canic M. Cellular and molecular basis of wound healing in diabetes. J. Clin. Invest. 2007;117:1219–1222. - PMC - PubMed

LinkOut - more resources