. 2024 May 9:11:1407761.
doi: 10.3389/fvets.2024.1407761. eCollection 2024.

Morphological and morphometric measurement of the temporomandibular joint of small and medium-weight dogs with different skull shapes

Affiliations

Morphological and morphometric measurement of the temporomandibular joint of small and medium-weight dogs with different skull shapes

Ina Quadflieg et al. Front Vet Sci. .

Abstract

Background: The recognition and diagnosis of canine temporomandibular joint (TMJ) disease can be a challenge, often leaving them undiagnosed. Although computed tomography (CT) has proved to be highly efficacious in detecting joint disease in the TMJ, morphometric and morphological studies of the normal TMJ have been scarce. Especially, skull type specific anatomical differences of the TMJ in dogs of different weights and skull morphologies have received limited attention.

Objective: This study aimed to compare the TMJ morphologies of dogs across different weight classes and skull types.

Study design: Retrospective study.

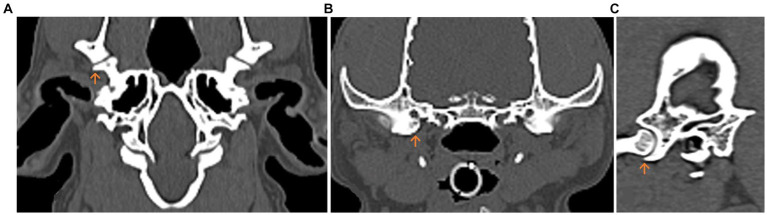
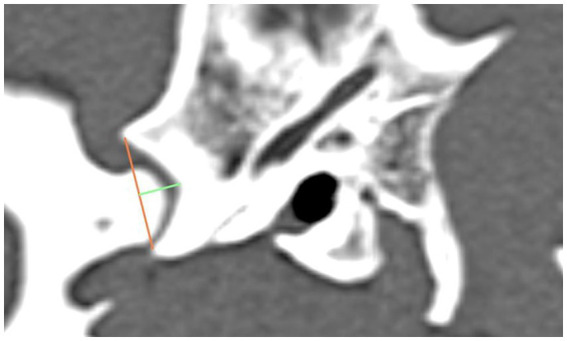
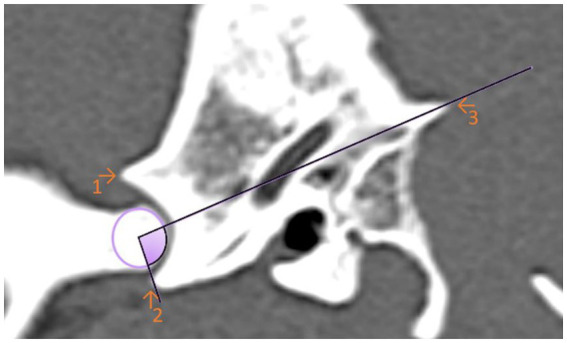
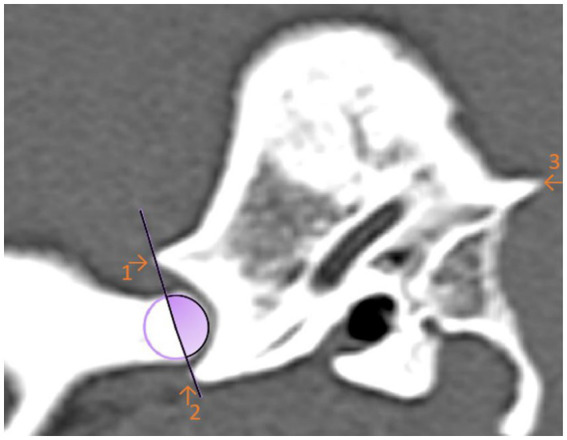
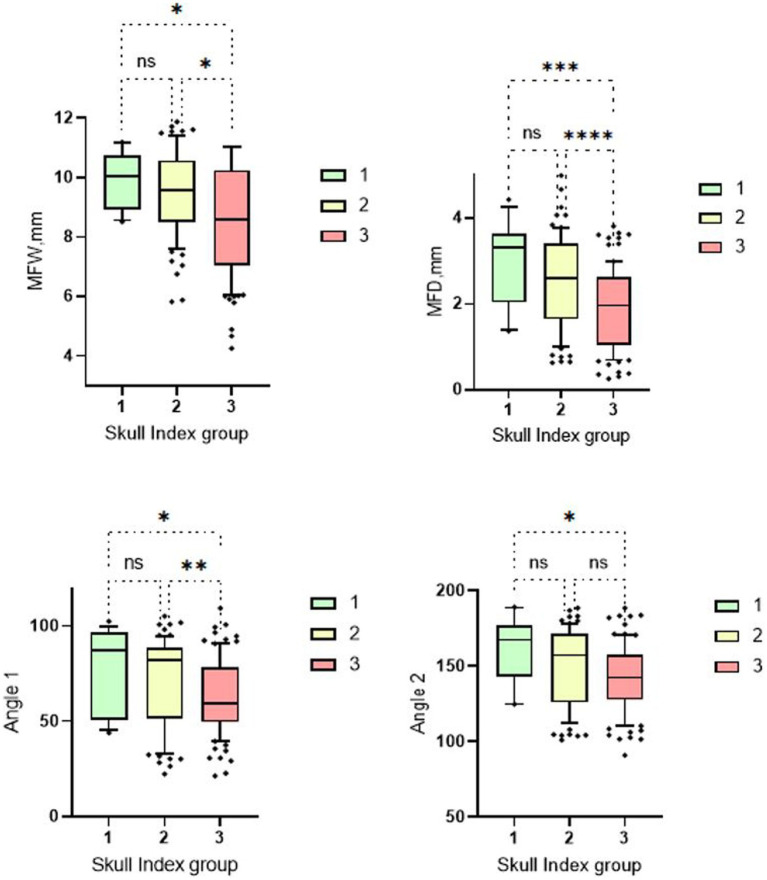
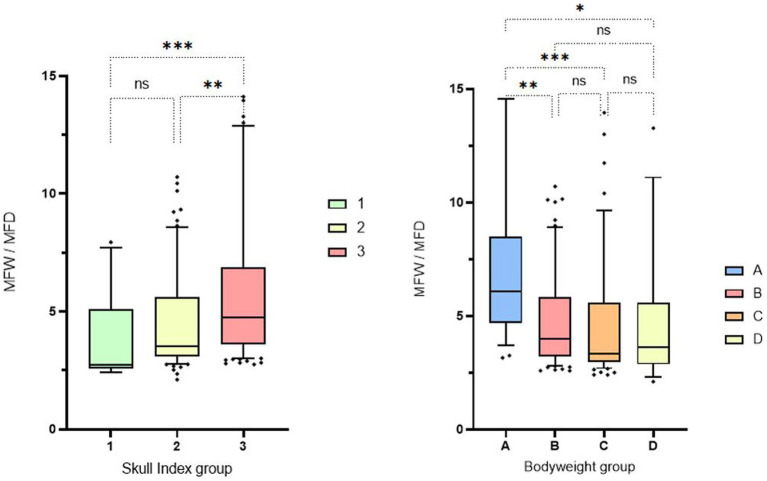
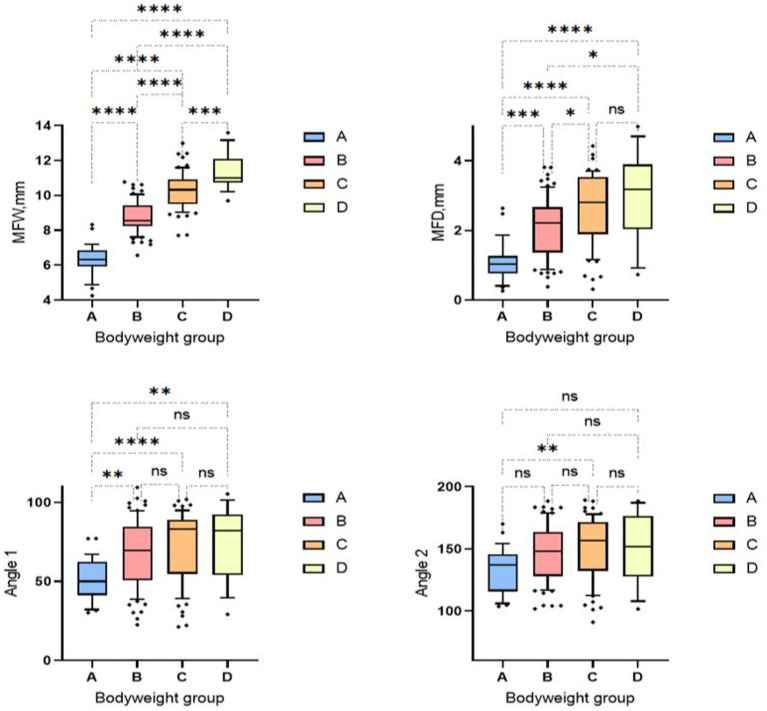
Methods: CT scans were used to measure the depth and width of the Fossa mandibularis and two angles between the Fossa mandibularis and the Caput mandibulae in a total of 92 dogs and 182 mandibular joints, respectively.

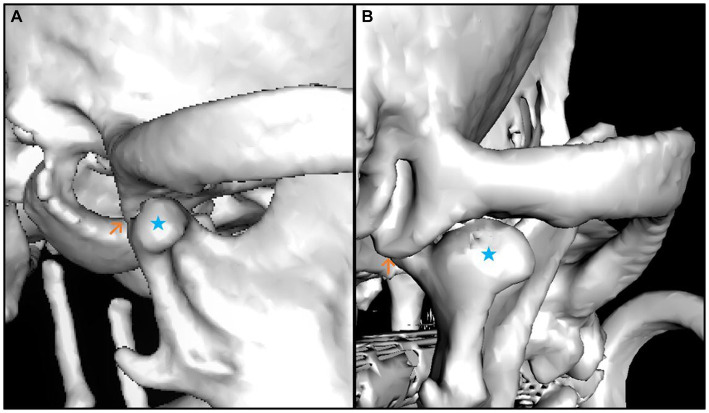
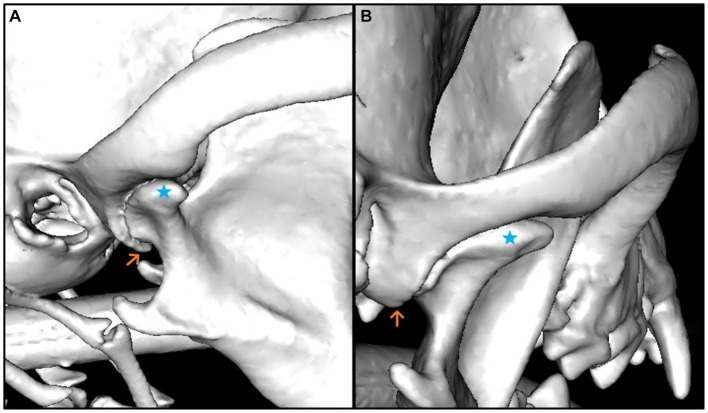
Results: The TMJ varied in terms of weight groups and skull indices. Shallow mandibular pits, underdeveloped retroarticular processes, and reduced joint congruency were observed particularly in light-weight and brachycephalic dogs. Conversely, dolichocephalic animals displayed deep joint pits, pronounced joint congruency, and a well-developed Processus retroarticularis.

Main limitations: Observer learning curve; not every skull shape was represented in each weight group.

Keywords: computed tomography; morphometry; small animal; temporomandibular disorders; temporomandibular joint.


Conflict of interest statement

The authors declare that the research was conducted in the absence of any commercial or financial relationships that could be construed as a potential conflict of interest.

Figures

Figure 1
Figure 1
Multiplanar computed tomography (CT) reconstruction of the temporomandibular joint (TMJ) in the dog. The Processus retroarticularis (orange arrow) reaching maximal ventral extension is displayed. (A) Dorsal. (B) Transverse. (C) Sagittal planes.
Figure 2
Figure 2
The graphic shows the lateral aspect of a dog’s skull in a sagittal computed tomography reconstruction, highlighting the width (orange line) and depth (green line) of the Fossa mandibularis.
Figure 3
Figure 3
Sagittal computed tomography reconstruction image of a dog’s temporomandibular joint depicting angle 1. Angle 1 is formed by a line between the maximal ventral extension of the Processus retroarticularis and the Crista nuchae with the EARCP (purple circle). The filled (purple) area represents the measured angle. (1) Dorsal eminence of the Fossa mandibularis. (2) Processus retroarticularis. (3) Crista nuchae.
Figure 4
Figure 4
Sagittal computed tomography reconstruction image of a dog’s temporomandibular joint depicting angle 2. Angle 2 is formed by the linkage the maximal ventral extension of the Processus retroarticularis and the dorsal articular eminence of the mandibular fossa with the estimated axis of rotation of the condylar process (circle). The filled (purple) area represents the measured angle. (1) Dorsal eminence of the Fossa mandibularis. (2) Processus retroarticularis. (3) Crista nuchae.
Figure 5
Figure 5
Box and whisker plots of Skull Index groups. The four box plots show the evaluation of the temporomandibular joint measurements carried out in relation to the three different skull shapes mentioned. Group 1: dolichocephalic dogs; Group 2: mesocephalic dogs; Group 3: brachycephalic dogs. Significant differences between the analyzed groups were detected in the analyzed data set. The significance was characterized by asterisks and connecting lines between the study groups. nsp > 0.05; *p < 0.05; **p < 0.01; ***p < 0.001; ****p < 0.0001. Significant differences were found between the first and third cranial index groups for all measurement parameters (MWF: p = 0.04; MWD: p = 0.0005; Angle 1: p = 0.022; Angle 2: p = 0.01). Further significant differences can be seen between cranial index groups 2 and 3. Here, the measurements of the mandibular fossa (p = <0.0001–0.01) and angle 1 (p = 0.009) are significantly different. No significant differences were found between measurement groups 1 and 2.
Figure 6
Figure 6
3D reconstruction of a brachycephalic dog skull showing minimal values in the evaluation of the measured parameters. The images show lateral (A) and caudal (B) views of the right temporomandibular joint. The caput mandibulae is highlighted with a blue star in both views. The Processus retroarticularis is marked (orange arrow) at the position where it reaches maximal ventral extension. The lateral view (A) shows that the Caput mandibulae is sparse limited by the Processus retroarticularis only on the medial side of the joint. The caudal view (B) shows that the Processus retroarticularis is nearly absent.
Figure 7
Figure 7
3D reconstruction of a dog skull with a dolichocephalic skull type, which shows maximum values in the evaluation of the measured parameters. The lateral (A) and caudal (B) views of the right temporomandibular joint are shown. The Caput mandibulae is marked with a blue star in both views. The Processus retroarticularis is marked (orange arrow) at the position where it reaches maximal ventral extension. It can be seen in the illustrations that the Processus retroarticularis surrounds the Caput mandibulae ventrally (A) and thus borders the joint cavity caudally (B).
Figure 8
Figure 8
Box and whisker plots of Skull Index groups and Bodyweight groups. The three boxplots show the evaluation of the measurement of the fossa width/fossa depth, which was carried out in relation to the three different skull shapes mentioned (left side). The fossa width/fossa depth quotient of the 4 boxplots in relation to the weight division (right side). Significant differences between the analyzed groups were detected in the analyzed data set. The significance was characterized by asterisks and connecting lines between the study groups. nsp > 0.05; *p < 0.05; **p < 0.01; ***p < 0.001; ****p < 0.0001. Significant differences were found between cranial index groups 1 and 3 (p = 0.0006) and between cranial index groups 2 and 3 (p = 0.0017). Significance could also be determined in the weight-associated analysis. Remarkable differences were found between weight group 1 and the other three comparison groups, with significance values ranging from p = 0.001 to p = 0.015.
Figure 9
Figure 9
Box and whisker plots of the bodyweight groups. Group 1: < 5 kg; Group 2: 6–10 kg; Group 3: 11–15 kg; Group 4: 16–20 kg. The four box plots show the evaluation of the temporomandibular joint measurements carried out in relation to the four bodyweight groups. Significant differences between the analyzed groups were detected in the analyzed data set. The significance was characterized by asterisks and connecting lines between the study groups. nsp > 0.05; *p < 0.05; **p < 0.01; ***p < 0.001; ****p < 0.0001. Significant differences between the analyzed groups were detected in the analyzed data set. Fossa width showed significant differences between all weight groups (p = 0.0001–< 0.0001). Fossa depth also showed significant differences between all weight groups (p = <0.0001–0.04), except for weight group C, which showed no significant differences from weight group D. The first measured angle showed significances between weight group A in relation to all three other weight groups (p = <0.001–0.006). Significant readings were documented between weight group A and weight group C for measurement angle two (p = 0.004).

Similar articles

References

    1. Lin A, Vapniarsky N, Cissell D, Verstraete F, Lin C, Hatcher D, et al. . The temporomandibular joint of the domestic dog (Canis lupus familiaris) in health and disease. J Comp Pathol. (2018) 161:55–67. doi: 10.1016/j.jcpa.2018.05.001, PMID: - DOI - PubMed
    1. Nickel R, Schummer A, Wille K-H, Wilkens H. Gelenklehre, arthrologia. In: Frewein J, Wille K-H, Wilkens H, Augsburger H, editors. Lehrbuch der Anatomie der Haustiere Band I: Bewegungsapparat 8., unveränderte Auflage ed: Verlag Parey. (2004), 215–221.
    1. Carmalt JL, Tucker ML. Arthroscopic approach and intra-articular anatomy of the equine discomandibular joint compartment of the temporomandibular joint. Vet Surg. (2020) 49:1326–33. doi: 10.1111/vsu.13487 - DOI - PubMed
    1. Schwarz T, Weller R, Dickie AM, Konar M, Sullivan M. Imaging of the canine and feline temporomandibular joint: a review. Vet Radiol Ultrasound. (2002) 43:85–97. doi: 10.1111/j.1740-8261.2002.tb01656.x, PMID: - DOI - PubMed
    1. Villamizar-Martinez LA, Villegas CM, Gioso MA, Reiter AM, Patricio GC, Pinto AC. Morphologic and morphometric description of the temporomandibular joint in the domestic dog using computed tomography. J Vet Dent. (2016) 33:75–82. doi: 10.1177/0898756416660008, PMID: - DOI - PubMed

LinkOut - more resources