. 2024 May 9:18:1383688.
doi: 10.3389/fncel.2024.1383688. eCollection 2024.

Brain organoids engineered to give rise to glia and neural networks after 90 days in culture exhibit human-specific proteoforms

Affiliations

Brain organoids engineered to give rise to glia and neural networks after 90 days in culture exhibit human-specific proteoforms

Tyler J Wenzel et al. Front Cell Neurosci. .

Abstract

Human brain organoids are emerging as translationally relevant models for the study of human brain health and disease. However, it remains to be shown whether human-specific protein processing is conserved in human brain organoids. Herein, we demonstrate that cell fate and composition of unguided brain organoids are dictated by culture conditions during embryoid body formation, and that culture conditions at this stage can be optimized to result in the presence of glia-associated proteins and neural network activity as early as three-months in vitro. Under these optimized conditions, unguided brain organoids generated from induced pluripotent stem cells (iPSCs) derived from male-female siblings are similar in growth rate, size, and total protein content, and exhibit minimal batch-to-batch variability in cell composition and metabolism. A comparison of neuronal, microglial, and macroglial (astrocyte and oligodendrocyte) markers reveals that profiles in these brain organoids are more similar to autopsied human cortical and cerebellar profiles than to those in mouse cortical samples, providing the first demonstration that human-specific protein processing is largely conserved in unguided brain organoids. Thus, our organoid protocol provides four major cell types that appear to process proteins in a manner very similar to the human brain, and they do so in half the time required by other protocols. This unique copy of the human brain and basic characteristics lay the foundation for future studies aiming to investigate human brain-specific protein patterning (e.g., isoforms, splice variants) as well as modulate glial and neuronal processes in an in situ-like environment.

Keywords: astrocyte; heterogeneity; human brain; microglia; mouse brain; oligodendrocytes; protein processing; species differences.


Conflict of interest statement

The authors declare that the research was conducted in the absence of any commercial or financial relationships that could be construed as a potential conflict of interest.

Figures
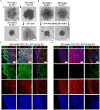
Figure 1
Figure 1
Representative images of EB formation data in Table 4. iPSCs from the same cell suspension were seeded in either (Ai, top) EB formation media 1, (Ai, bottom) EB formation media 5, or (Aii) EB formation media 2, which is media described in Lancaster and Knoblich (2014). (Ai, top) After 24 h, EB formation media 1 always formed multiple, small, EBs inadequate for BO generation, whereas (bottom) EB formation media 5 could form the single, large EB required for BO generation. (Aii) After 24 h, EB formation media 2 produced an aggregate with undefined borders, which disaggregated into a monolayer of single cells by 48 h. (B) Inadequate EBs formed by EB formation media 1 were repaired within 24 h post-exposure to EB FM 5. (C) Higher levels of TMEM119, GFAP and OLIG2 were detected at day 90 in BOs exposed to EB formation media 5 for the first 24 h of generation (D) compared to BOs exposed to EB formation media 1 for the first 24 h. (C,D) Image colors are enhanced by linear increases to gain to improve visualization, with any change in gain or contrast applied to all images in a series. Scale bars: (A,B) 100 μm and (C,D) 100–200 μm. Sections were counter-stained with DAPI (nuclear stain: blue).
Figure 2
Figure 2
Representative high magnification images of the cells in BOs exposed to EB formation media 5 for the first 24 h of generation. Z-stacked images of BO sections stained for (A) neuronal markers NeuN and MAP2, (B) oligodendrocytes markers CNPase and OLIG2, (C) microglial markers TMEM119 and PU.1, and (D) astrocytic markers GFAP and S100B at in vitro day 90. (A–D, left) Projection images of maximum signal intensity from Z-stacked images are shown, as are (right) images of optical slices that are 2 μm apart. (A-D) Arrows mark the same location on images in a series to aid visualization. Scale bars: 20 μm. In all cases, sections were counter-stained with DAPI (nuclear stain: blue).
Figure 2
Figure 2
Representative high magnification images of the cells in BOs exposed to EB formation media 5 for the first 24 h of generation. Z-stacked images of BO sections stained for (A) neuronal markers NeuN and MAP2, (B) oligodendrocytes markers CNPase and OLIG2, (C) microglial markers TMEM119 and PU.1, and (D) astrocytic markers GFAP and S100B at in vitro day 90. (A–D, left) Projection images of maximum signal intensity from Z-stacked images are shown, as are (right) images of optical slices that are 2 μm apart. (A-D) Arrows mark the same location on images in a series to aid visualization. Scale bars: 20 μm. In all cases, sections were counter-stained with DAPI (nuclear stain: blue).
Figure 3
Figure 3
BOs were grown as described in Wenzel et al. (2023b) using EB formation media 5 for 24 h. (A) BOs derived from 86i and 87i cell lines exhibit all visual markers of proper development. (B–E) At day 90, the levels of housekeeping proteins TUBB3 (p = 0.63, U = 27), β-actin (p = 0.57, U = 26), and GAPDH (p = 0.48, U = 24) are consistently expressed at similar levels, (F) as are the levels of total protein (p = 0.92, U = 237.5), indicating these cultures grow to similar sizes and complexities at similar rates. (G) The ability of BOs to metabolize resazurin into resorufin is also similar at day 90 (p = 0.84, U = 496), indicating similar metabolic activity. (C–G) Data (means ± SD) analyzed according to the two-tailed Mann–Whitney test. (B–E) BO data were derived by pooling five organoids. The five pooled BOs were from the same batch, but each sample (i.e., lane or data-point) was from a different batch of five organoids (batches defined as BOs generated on different days from iPSCs of a different vial). (F,G) Total protein and resorufin data-points represent individual organoids. (H) Two weeks after plating on a multielectrode array, the instrument detects neural network activity in 86i (male) BOs cultured for 90 days. (left) Spontaneous action potentials (spikes) and network burst electrical activity were observed, and (right) the electrophysiological properties of this network activity are summarized.
Figure 4
Figure 4
Immunoblots of neuron-associated proteins NeuN (top), SYN1 (middle) and TUBB3 (bottom). Protein homogenates for primary mouse and human tissues were derived from different donors (Table 1), while BO homogenate was derived by pooling five organoids. The five BOs were from the same batch, but each sample (i.e., lane) was from a different batch of five organoids (batches defined as BOs generated on different days from iPSCs of a different vial). Samples of human Ctx and Cb, BOs as well as mouse Ctx were simultaneously run on an 12% SDS-PAGE gel, transferred onto a nitrocellulose membrane, and treated with antibodies in the same containers. The amount of protein loaded for each sample and the antibodies used are indicated in Table 2. Membranes images of the same protein were also taken at the same time as a single image, and only cropped and digitally repositioned for publication. No post-processing was done on any image, and so the immunodensity of bands are visually comparable from one blot to the next. We note that TUBB3 was probed overtop of the IBA1 immunoblot shown in Figure 5, but the 55 kDa band was clearly the only new band detected by TUBB3 antibodies. Arrowheads indicate the specific bands used for estimations of protein expression for Figures 8, 9. DIV, days in vitro, w, week; y, year; NeuN, neuronal nuclei; TUBB3, β3-tubulin; SYN1, synapsin 1.
Figure 5
Figure 5
Immunoblots of microglia-associated proteins IBA1 (top), TMEM119 (middle) and P2RY12 (bottom). Samples are the same protein homogenates described in Figure 4, and the individual antibodies were used to probe all membranes on the same day so that the immunodensity of bands are visually comparable across blots. Arrowheads indicate the specific bands used for estimations of protein expression for Figures 8, 9. DIV, days in vitro; w, week; y, year; IBA1, ionized calcium-binding adapter molecule 1; TMEM119, transmembrane protein 119; P2RY12, purinergic receptor P2Y12.
Figure 6
Figure 6
Immunoblots of macroglia (astrocyte and oligodendrocyte)-associated proteins GFAP (top), OLIG2 (middle), and MBP (bottom). Samples are the same protein homogenates described in Figure 4, and are probed by the individual antibodies simultaneously to allow for proper comparison of samples between blots. Arrowheads indicate the specific bands used for estimations of protein expression for Figures 8, 9. DIV, days in vitro; w, week; y, year; GFAP, glial fibrillary acidic protein; MBP, myelin basic protein, OLIG2, oligodendrocyte transcription factor 2.
Figure 7
Figure 7
Immunoblots of TLR4 (top) as well as housekeeping proteins β-actin (middle) and GAPDH (bottom). Samples are the same protein homogenates described in Figure 4, and are blotted simultaneously to allow for proper comparative densitometric analysis across samples. β-actin and GAPDH blots are cropped as only one band was detected. Arrowheads indicate the specific bands used for estimations of protein expression for Figures 8, 9. DIV, days in vitro; w, week; y, year; TLR4, toll-like receptor 4; GAPDH, glyceraldehyde-3-phosphate dehydrogenase.
Figure 8
Figure 8
Densitometry of immunoblots (n = 3 males +3 females, pooled) shown in Figures 4–7 comparing the expression levels of (A) neuron-associated markers (i, NeuN-55 kDa, p = 0.0004, H = 17.97; ii, NeuN-100 kDa, p < 0.00041, H = 15.16; iii, SYN1, p = 0.0002, H = 19.21; iv, TUBB3, p = 0.0018, H = 15.03;), (B) microglia-associated markers (i, IBA1, p = 0.72, H = 1.31; ii, TMEM119, p = 0.0033, H = 13.70; iii, P2RY12–18 kDa, p = 0.023, H = 8.57; iv, P2RY12–40 kDa, p = 0.064, H = 7.25), (C) macroglia (astrocyte and oligodendrocyte)-associated markers (i, GFAP, p = 0.0005, H = 17.55; ii, OLIG2, p = 0.0023, H = 14.54; iii, Golli MBP, p = 0.0092, H = 11.53; iv, MBP, p = 0029, H = 14.01), and (D) other proteins of interest (i, TLR4, p = 0.0006, H = 17.46; ii, β-actin, p = 0.13, H = 5.57). Data presented as means ± SD and normalized to the housekeeping protein GAPDH. Data-points from primary mouse and human tissues were derived from different donors (Table 1), while individual BO data-points were derived by pooling five organoids. The five BOs pooled per sample were from the same batch, but individual samples (i.e., data-point) represent a different batch of five organoids (batches defined as BOs generated on different days from iPSCs of a different vial). *p < 0.05, **p < 0.01, and ***p < 0.0001 according to the Dunn’s post hoc test and p and H value according of Kruskal-Wallis test.
Figure 9
Figure 9
Separation of data-points shown in Figure 8 by biological sex to compare sex-dependent expression levels of (A) neuron-associated markers (i, NeuN-55 kDa; ii, NeuN-100 kDa; iii, SYN1; iv, TUBB3), (B) microglia-associated markers (i, IBA1; ii, TMEM119; iii, P2RY12–18 kDa; iv, P2RY12–40 kDa), (C) macroglia (astrocyte and oligodendrocyte)-associated markers (i, GFAP; ii, OLIG2; iii, Golli MBP; iv, MBP), and (D) other proteins of interest (i, TLR4; ii, β-actin). Data presented as means ± SD and normalized to the housekeeping protein GAPDH. Data-points from primary mouse and human tissues were derived from different donors (Table 1), while BO data-points were derived by pooling five organoids from different batches (batches defined as BOs generated on different days from iPSCs of a different vial). *p < 0.05 and **p < 0.01 according to the Sidak’s post hoc test.

Similar articles

Cited by

References

    1. Abud E. M., Ramirez R. N., Martinez E. S., Healy L. M., Nguyen C. H. H., Newman S. A., et al. . (2017). iPSC-derived human microglia-like cells to study neurological diseases. Neuron 94, 278–293. doi: 10.1016/j.neuron.2017.03.042 - DOI - PMC - PubMed
    1. Bathke J., Konzer A., Remes B., McIntosh M., Klug G. (2019). Comparative analyses of the variation of the transcriptome and proteome of Rhodobacter sphaeroides throughout growth. BMC Genom. 20:358. doi: 10.1186/s12864-019-5749-3 - DOI - PMC - PubMed
    1. Bayés À., Collins M. O., Croning M. D. R., van de Lagemaat L. N., Choudhary J. S., Grant S. G. N. (2012). Comparative study of human and mouse postsynaptic proteomes finds high compositional conservation and abundance differences for key synaptic proteins. PLoS One 7:e46683. doi: 10.1371/journal.pone.0046683 - DOI - PMC - PubMed
    1. Bellinger F. P., Bellinger M. T., Seale L. A., Takemoto A. S., Raman A. V., Miki T., et al. . (2011). Glutathione peroxidase 4 is associated with neuromelanin in substantia nigra and dystrophic axons in putamen of Parkinson’s brain. Mol. Neurodegener. 6:8. doi: 10.1186/1750-1326-6-8 - DOI - PMC - PubMed
    1. Bodnar B., Zhang Y., Liu J., Lin Y., Wang P., Wei Z., et al. . (2021). Novel scalable and simplified system to generate microglia-containing cerebral organoids from human induced pluripotent stem cells. Front. Cell. Neurosci. 3:32. doi: 10.3389/fncel.2021.682272 - DOI - PMC - PubMed

LinkOut - more resources