. 2024 May 3:15:1387957.
doi: 10.3389/fmicb.2024.1387957. eCollection 2024.

Hybridization alters red deer gut microbiome and metabolites

Affiliations

Hybridization alters red deer gut microbiome and metabolites

Limin Wei et al. Front Microbiol. .

Abstract

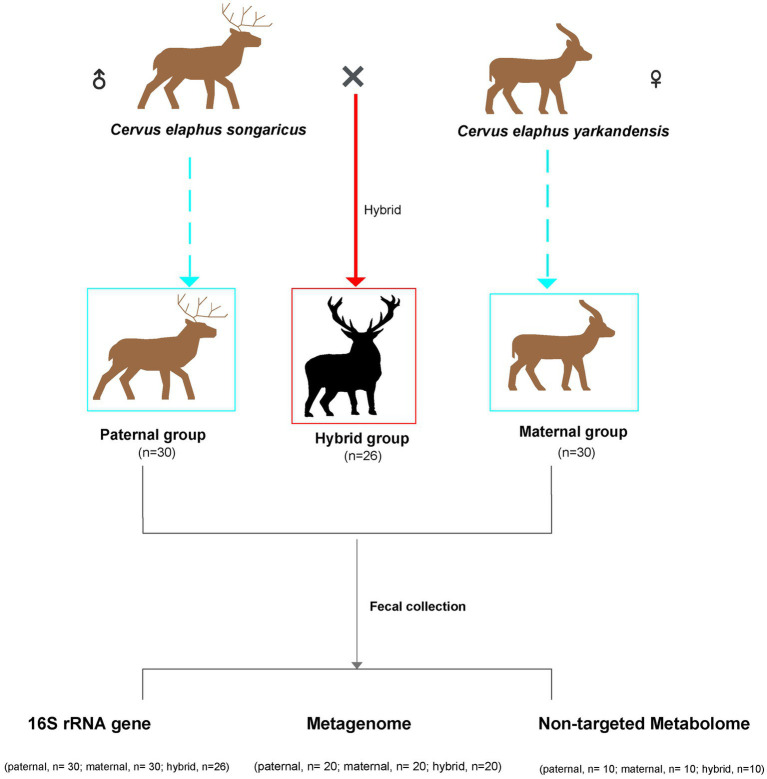
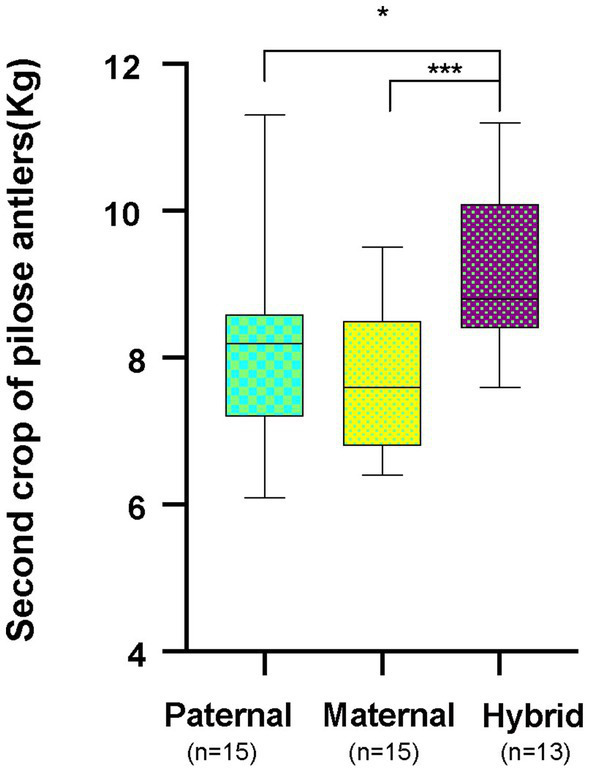
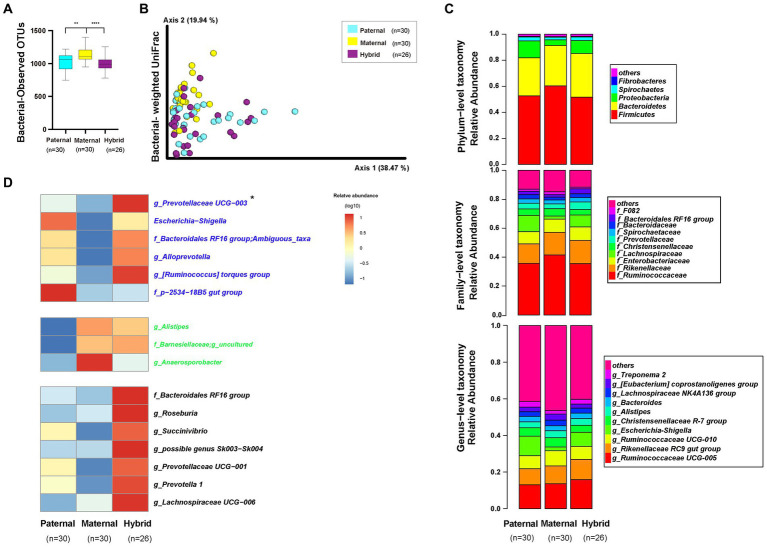
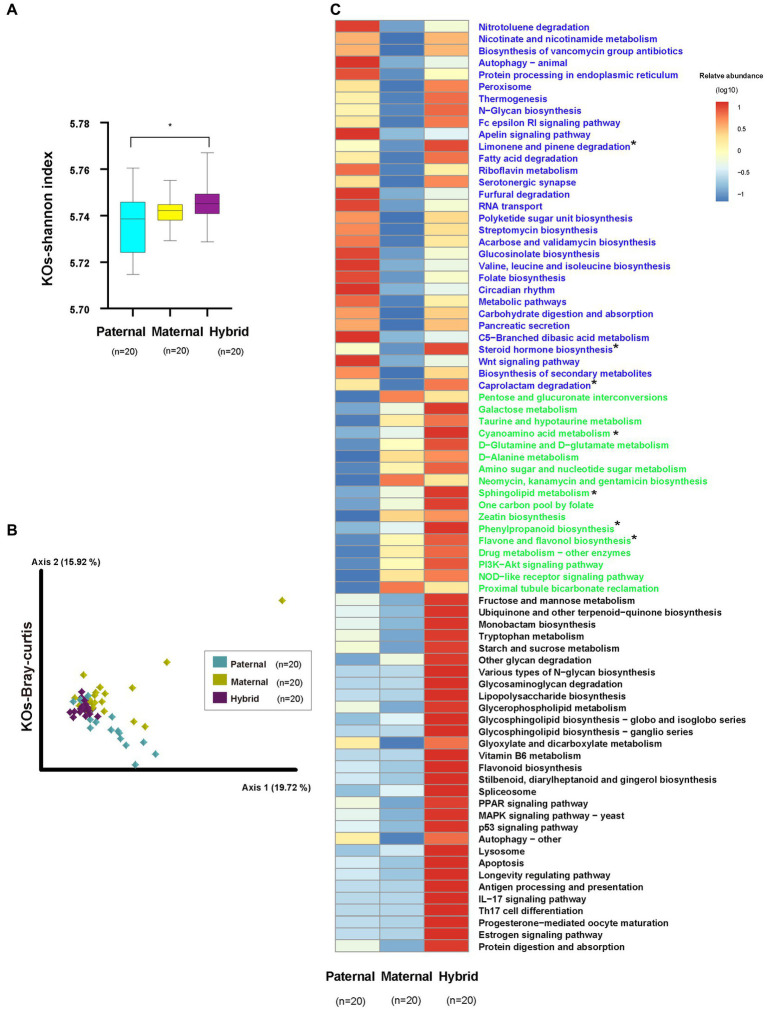
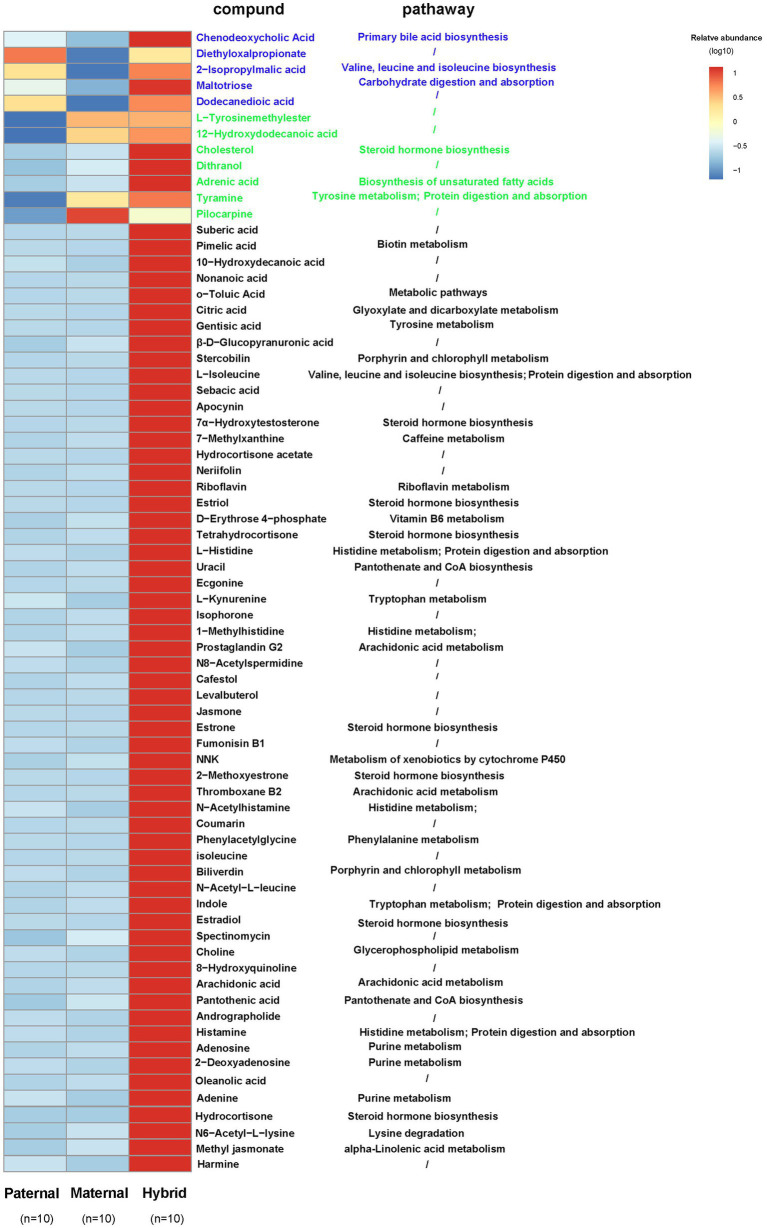
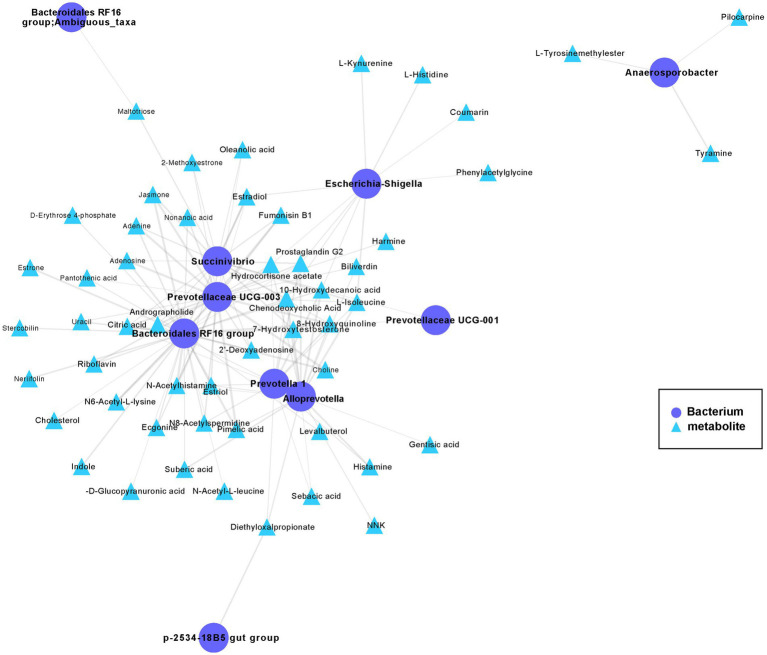
The host genes play a crucial role in shaping the composition and structure of the gut microbiome. Red deer is listed as an endangered species by the International Union for the Conservation of Nature, and its pilose antlers have good medicinal value. Hybridization can lead to heterosis, resulting in increased pilose antler production and growth performance in hybrid deer. However, the role of the gut microbiome in hybrid deer remains largely unknown. In this study, alpha and beta diversity analysis showed that hybridization altered the composition and structure of the gut microbiome of the offspring, with the composition and structure of the hybrid offspring being more similar to those of the paternal parents. Interestingly, the LefSe differential analysis showed that there were some significantly enriched gut microbiome in the paternal parents (such as g_Prevotellaceae UCG-003, f_Bacteroidales RF16 group; Ambiguous_taxa, etc.) and the maternal parents (including g_Alistipes, g_Anaerosporobacter, etc.), which remained significantly enriched in the hybrid offspring. Additionally, the hybrid offspring exhibited a significant advantage over the parental strains, particularly in taxa that can produce short-chain fatty acids, such as g_Prevotellaceae UCG-003, g_Roseburia, g_Succinivibrio, and g_Lachnospiraceae UCG-006. Similar to bacterial transmission, metagenomic analysis showed that some signaling pathways related to pilose antler growth ("Wnt signaling pathway," "PI3K Akt signaling pathway," "MAPK signaling pathway") were also enriched in hybrid red deer after hybridization. Furthermore, metabolomic analysis revealed that compared with the paternal and maternal parents, the hybrid offspring exhibited significant enrichment in metabolites related to "Steroid hormone biosynthesis," "Tryptophan metabolism," "Valine, leucine and isoleucine metabolism," and "Vitamin B metabolism." Notably, the metagenomic analysis also showed that these metabolic pathways were significantly enriched in hybrid deer. Finally, a correlation analysis between the gut microbiome and metabolites revealed a significant positive correlation between the enriched taxa in hybrid deer, including the Bacteroidales RF16 group, Prevotellaceae, and Succinivibrio, and metabolites, such as 7α-hydroxytestosterone, L-kynurenine, indole, L-isoleucine, and riboflavin. The study contributes valuable data toward understanding the role of the gut microbiome from red deer in hybridization and provides reference data for further screening potential probiotics and performing microbial-assisted breeding that promotes the growth of red deer pilose antlers and bodies, development, and immunity.

Keywords: gut microbiome; hybridization; multi-omics technologies; pilose antler; red deer.


Conflict of interest statement

The authors declare that the research was conducted in the absence of any commercial or financial relationships that could be construed as a potential conflict of interest.

Figures

Figure 1
Figure 1
Schematic overview of the experimental design. Sample correspondence information is shown in Supplementary Table S1.
Figure 2
Figure 2
Annual production of second crop of pilose antlers by the parent red deer and their hybrid. Paternal group: n = 15; maternal group, n = 15; hybrid group, n = 13. *p < 0.05, ***p < 0.001.
Figure 3
Figure 3
Diversity, composition, and differential analyses of the gut microbiome from the paternal, maternal and hybrid groups. Paternal group: n = 30; maternal group, n = 30; hybrid group, n = 26. (A) Observed OTUs index. Cyan, yellow, and purple bars represent paternal, maternal, and hybrid, respectively. ***p < 0.001, ****p < 0.0001, Mann–Whitney U-test. (B) Bacteria weighted UniFrac PCoA. Cyan, yellow, and purple circles represent the paternal, maternal, and hybrid bacterial communities, respectively. ANOSIM, p < 0.05. (C) Phylum-, family-, and genus-level distributions of the 16S rRNA sequences in the paternal, maternal, and hybrid groups (top 5 phylum-level classifications, top 10 family-level classifications, and top 10 genus-level classifications, respectively). (D) Heatmap of the genus-level differential bacterial communities between the paternal, maternal and hybrid groups. Blue font indicates that paternal and hybrid were more significant than those in the maternal group. Green font indicates that maternal and hybrid were more significant than the paternal group; Black font indicates that hybrid was more significant than both the paternal and maternal groups; Additionally, an asterisk (*) denotes that the significance of the hybrid group was higher than that of both the paternal and maternal groups.
Figure 4
Figure 4
KEGG functional analysis. Paternal group: n = 20; maternal group, n = 20; hybrid group, n = 20. (A) Shannon index of the KOs. Cyan, yellow, and purple bars, paternal, maternal, and hybrid, respectively. *p < 0.05, Mann–Whitney U-test. (B) KOs of a Bray-Curtis PcoA. Cyan, yellow, and purple diamonds indicate paternal, maternal and hybrid KOs, respectively. (C) Heatmap of different KEGG pathways. Blue font indicates that paternal and hybrid were more significant than those in the maternal group. Green font indicates that maternal and hybrid were more significant than the paternal group; Black font indicates that hybrid was more significant than both the paternal and maternal groups; Additionally, an asterisk (*) denotes that the significance of the hybrid group was higher than that of both the paternal and maternal groups.
Figure 5
Figure 5
Heatmap of the differentially abundant metabolites. Paternal group: n = 10; maternal group, n = 10; hybrid group, n = 10.Blue font indicates that paternal and hybrid were more significant than those in the maternal group. Green font indicates that maternal and hybrid were more significant than the paternal group; Black font indicates that hybrid was more significant than both the paternal and maternal groups; Additionally, an asterisk (*) denotes that the significance of the hybrid group was higher than that of both the paternal and maternal groups.
Figure 6
Figure 6
The co-occurrence networks of the metabolites and bacteria enriched in the hybrid. Select metabolites and bacteria with higher abundance in the hybrid group than in the paternal and maternal groups (Figures 3D, 5) for paired Spearman correlation analysis and network visualization (r > 0.8 and p < 0.01; paternal group: n = 10; maternal group: n = 10; hybrid group: n = 0; bacterial and metabolite samples correspond one-to-one.). Circles represent enriched bacterium, triangles represent enriched metabolites. Nodes are connected by pairwise interactions (links). The weight of the link indicated a strong Pearson correlation (r > 0.8, p < 0.01), which was shared between metabolites and genes. Readers are suggested to read the web version of the article for interpretation of the high-resolution figures.

Similar articles

Cited by

References

    1. Anderson S., Côté S., Richard J., Shafer A. (2019). Genomic architecture of artificially and sexually-selected traits in a wild cervid. Bio Rxiv 841528, 1–29. doi: 10.1101/841528 - DOI
    1. Auffret M. D., Stewart R. D., Dewhurst R. J., Duthie C.-A., Watson M., Roehe R. (2020). Identification of microbial genetic capacities and potential mechanisms within the rumen microbiome explaining differences in beef cattle feed efficiency. Front. Microbiol. 11:1229. doi: 10.3389/fmicb.2020.01229, PMID: - DOI - PMC - PubMed
    1. Bergamaschi M., Tiezzi F., Howard J., Huang Y. J., Maltecca C. (2020). Microbiome composition differences among breeds impact feed efficiency in swine. Microbiome 8, 1–15. doi: 10.1186/s40168-020-00888-9 - DOI - PMC - PubMed
    1. Bjork A., Liu J. W., Wertheim O., Hahn B. H., Worobey M. (2011). Evolutionary history of chimpanzees inferred from complete mitochondrial genomes. Mol. Biol. Evol. 28, 615–623. doi: 10.1093/molbev/msq227, PMID: - DOI - PMC - PubMed
    1. Bolyen E., Rideout J. R., Dillon M. R., Bokulich N. A., Abnet C. C., Al-Ghalith G. A., et al. . (2019). Reproducible, interactive, scalable and extensible microbiome data science using QIIME 2. Nat. Biotechnol. 37, 852–857. doi: 10.1038/s41587-019-0209-9, PMID: - DOI - PMC - PubMed

LinkOut - more resources