. 2024 May 2;46(5):4251-4270.
doi: 10.3390/cimb46050259.

Membrane Association of the Short Transglutaminase Type 2 Splice Variant (TG2-S) Modulates Cisplatin Resistance in a Human Hepatocellular Carcinoma (HepG2) Cell Line

Affiliations

Membrane Association of the Short Transglutaminase Type 2 Splice Variant (TG2-S) Modulates Cisplatin Resistance in a Human Hepatocellular Carcinoma (HepG2) Cell Line

Dipak D Meshram et al. Curr Issues Mol Biol. .

Abstract

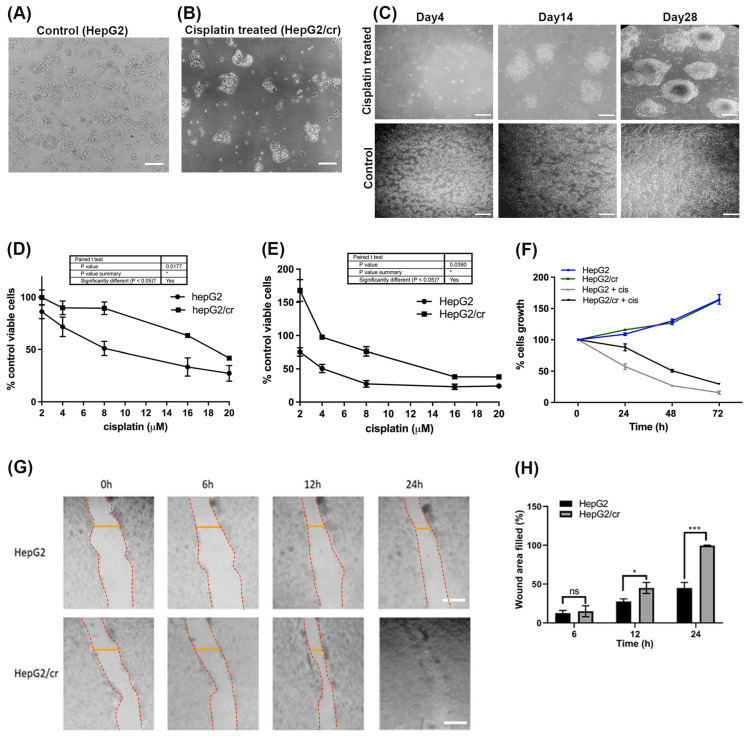
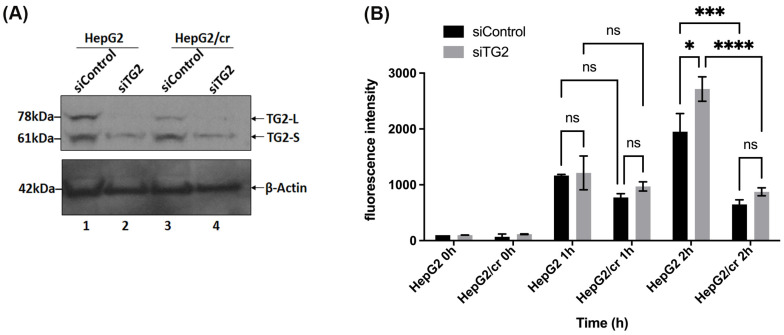
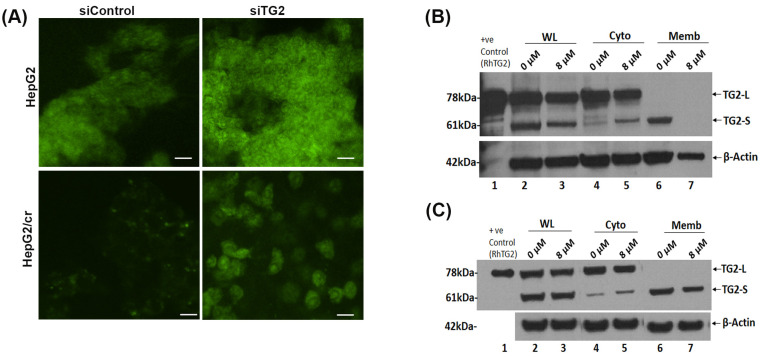
Hepatocellular carcinoma (HCC) is a heterogeneous malignancy with complex carcinogenesis. Although there has been significant progress in the treatment of HCC over the past decades, drug resistance to chemotherapy remains a major obstacle in its successful management. In this study, we were able to reduce chemoresistance in cisplatin-resistant HepG2 cells by either silencing the expression of transglutaminase type 2 (TG2) using siRNA or by the pre-treatment of cells with the TG2 enzyme inhibitor cystamine. Further analysis revealed that, whereas the full-length TG2 isoform (TG2-L) was almost completely cytoplasmic in its distribution, the majority of the short TG2 isoform (TG2-S) was membrane-associated in both parental and chemoresistant HepG2 cells. Following the induction of cisplatin toxicity in non-chemoresistant parental cells, TG2-S, together with cisplatin, quickly relocated to the cytosolic fraction. Conversely, no cytosolic relocalisation of TG2-S or nuclear accumulation cisplatin was observed, following the identical treatment of chemoresistant cells, where TG2-S remained predominantly membrane-associated. This suggests that the deficient subcellular relocalisation of TG2-S from membranous structures into the cytoplasm may limit the apoptic response to cisplatin toxicity in chemoresistant cells. Structural analysis of TG2 revealed the presence of binding motifs for interaction of TG2-S with the membrane scaffold protein LC3/LC3 homologue that could contribute to a novel mechanism of chemotherapeutic resistance in HepG2 cells.

Keywords: HepG2; apoptosis; autophagy; chemoresistance; cisplatin; hepatocellular carcinoma (HCC); sub-cellular localisation; transglutaminase 2 (TG2).


Conflict of interest statement

The authors declare no conflicts of interest.

Figures

Figure 1
Figure 1
Characterisation of the cisplatin-resistant HepG2 (HepG2/cr) cell line. HepG2 cells were treated with a single dose of cisplatin (8 µM) for 4 days. Following this treatment, cells were incubated in cisplatin-free media for up to a further 4 weeks, during which time, cell morphologies were observed. Upper panel (A): Parental HepG2 cells before treatment (scale bar = 100 µm); (B): HepG2/cr recovered from cisplatin-resistant colonies (scale bar = 100 µm). (C): Upper panels: HepG2/cr cells incubated in cisplatin-free media for 4 days (left panel), 14 days (central panel), and 28 days (right panel), following 4-day exposure to cisplatin. Lower panel: untreated control HepG2 cells incubated in cisplatin-free media for 4 days (left panel), 14 days (central panel), and 28 days (right panel). (Scale bar = 200 µm). (D,E): Determination of cisplatin sensitivity in parental HepG2 and chemoresistant HepG2/cr cells. Drug-resistant phenotypes were characterised by incubating cells with 0–20 µM cisplatin for 24 h (D) and 48 h (E). The 100% cell viability is counted at 0 µM of cisplatin on the x axis. Error bars are presented as mean  ±  SEM of at least three independent determinations and p values are presented as * p  <  0.05. (F) The viability of HepG2 and HepG2/cr cells was subsequently measured using the CCK-8 assay in the presence or absence of 8 µM cisplatin, over a time course of 0–72 h. (G,H): Chemoresistant cell migration analysis. Cells (400,000/well) were grown in 12-well culture plates. After 24 h, a horizontal wound was created using a sterile 10 µL pipette tip. Cells were then washed (twice) with culture medium and floating cells were removed. Any remaining cells were incubated prior to further observations. (G) Images were taken following incubation of HepG2 (upper panel) and HepG2/cr (lower panel) cells for 0, 6, 12, and 24 h, using an inverted phase contrast microscope at ×100 magnification. Yellow lines mark the wound area used for quantification (Scale bar = 200 µm). (H) Quantification of wound area filled by the both cell lines. Error bars are presented as mean  ±  SEM of at least three independent determinations and p values are presented as * p  <  0.05; *** p  <  0.0005; ns = not significant. Wound area was quantified using ImageJ2.14.0/1.54f software.
Figure 2
Figure 2
A comparison of TG2 expression in parental HepG2 and cisplatin-resistant HepG2/cr cells. (A) Total cell protein was extracted from the lysates of equal numbers (1 × 10⁶ cells) of HepG2 and HepG2/cr cells, using RIPA buffer. Western blot analysis of TG2 protein expression was then performed using an anti-mouse TG2 polyclonal antibody (lanes represent duplicate samples for each cell line). Other experiments showed the same general pattern of results, although there was minor TG2-S movement from the membranous fractions in the chemoresistant cells after cisplatin treatment in the other two experiments. (B) Total TG2 mRNA expression was measured using RT-PCR. (C) Transaminase activity was measured using a TG2-specific colorimetric assay kit. TG2 activity is the enzymatic activity of TG2 to perform protein–protein cross linking, transamination, and deamidation of proteins. Error bars are presented as mean  ±  SEM of at least three independent determinations and p values are presented as p = 0.05 (B) and p > 0.05 (C). ns = not significant.
Figure 3
Figure 3
Fluorescence distribution and uptake of Alexa fluor 546-labelled cisplatin by HepG2 and HepG2/cr cells. (A) HepG2 cells compared against single-step-selected, cisplatin-resistant HepG2/cr cells. Cells were observed using confocal microscopy at ×400 magnification, with excitation at 543 nm (scale bar = 10 µm). Results are representative of triplicate experiments. (B) Cellular uptake of Alexa fluor 546-labelled cisplatin measured using flow cytometry. Approximately 5 × 10⁵ cells were incubated with Alexa fluor 546-labelled cisplatin, at a final concentration of 40 U/mL, in 6-well culture plates for 0, 1, and 2 h. Then, cells were collected and washed with PBS, before finally being re-suspended in ice-cold PBS. Cells (10,000) were analysed immediately using flow cytometry. Error bars are presented as mean  ±  SEM of duplicate samples from three independent determinations and p values are presented as p > 0.05; ns = not significant.
Figure 4
Figure 4
Inhibition of TG2 activity increased the uptake of fluorescent cisplatin in both parental HepG2 and chemoresistant HepG2/cr cell lines. (A) The parental HepG2 and cisplatin-resistant HepG2/cr cells were treated or untreated (control) with the TG2 inhibitor cystamine, at a final concentration of 2 mM for 48 h, while TG2 activity was measured using a TG2-specific colorimetric assay kit. (B) The cystamine pre-treated and untreated cells were incubated with Alexa fluor 546-labelled cisplatin at a final concentration of 40 U/mL for 0, 1, or 2 h. Cells were then collected using centrifugation, washed with PBS, and their fluorescence intensity determined using flow cytometry. Error bars are presented as mean  ±  SEM of duplicate samples from three independent determinations. The statistical significance of results against p values was analysed using two-way ANOVA with Sidak’s multiple comparison test. * p < 0.05; ** p < 0.01; *** p < 0.001; **** p < 0.0001; ns = not significant.
Figure 5
Figure 5
Cellular uptake of Alexa fluor 546-labelled cisplatin after TG2 mRNA silencing, as measured using flow cytometry. (A) Western blot showing reduction in TG2 expression, after siRNA treatment for 48 h. (B) Cellular uptake of fluorescent cisplatin after siRNA treatment. Both parental and resistant cells were treated or not treated with siRNA specific for TG2 mRNA for 48 h; then, cells were incubated with Alexa fluor 546-labelled cisplatin at a final concentration of 40 U/mL, for up to 2 h. The labelled cells were then trypsinised and harvested, before suspension in ice-cold PBS. Fluorescence intensities were subsequently measured using flow cytometry. The results are means ± SD of duplicate samples from three independent experiments. The statistical significance of results against p values was analysed using two-way ANOVA with Sidak’s multiple comparison test. * p < 0.05; *** p < 0.001; **** p < 0.0001; ns = not significant.
Figure 6
Figure 6
(A): Cellular uptake of Alexa fluor 546-labelled cisplatin after TG2 siRNA silencing, analysed using confocal microscopy. TG2 expression by HepG2 (upper panel) and HepG2/cr (lower panel) cells was reduced, following treatment with a specific anti-TG2 siRNA oligomer for 48 h; then, cells were incubated with Alexa fluor 546-labelled cisplatin, at a final concentration of 200 U/mL for 1 h. Cells were then fixed in 70% ethanol at −20 °C, before being mounted on slides with fluorescence mounting medium. The slides were observed using confocal microscopy at ×400 magnification, with the excitation at 546 nm (scale bar = 20 µm). (B,C): Western blot analysis showed the differential localisation of TG2 isoforms both before and following treatment of HepG2 and HepG2/cr cells with 8 µM cisplatin for 24 h. Cytoplasmic and membrane-associated proteins were extracted with a commercially available membrane preparation kit. (B) Parental HepG2; (C) chemoresistant HepG2/cr cells. WL: whole lysate; Cyto: cytoplasm; Memb: membrane, RhTG2: commercially available recombinant human TG2 protein control.
Figure 7
Figure 7
(A) Three-dimensional structure prediction model of TG2-S (residues 1–548) generated using Phyre2 (version 2.0) protein modelling software [49]. The TG2-S isoform (blue) is predicted to assume the open conformation, exposing the catalytic triad—cysteine277, histidine335, and aspartate358 (yellow)—as well as the functional motif LIR (magenta). The predicted LIR region is located in the C-terminal β-barrel domain B1. (B) The protein–protein docking simulation of TG2 (blue) and LC3 (red) generated using HADDOCK (version 2.2). The predicted interacting residues on TG2 (magenta) and LC3 (green) are shown as spheres, to indicate the relatively large contact surfaces between the two proteins. (C,D) Cropped images of the molecular complex showing the interactive residues of TG2 (magenta) and LC3 (green). The hydrogen bonds are shown in yellow in (D). The images were rendered using PyMOL (version 2.6.0) molecular visualisation system software.
Figure 8
Figure 8
Diagram illustrating the postulated dual role of TG2-S, following cisplatin uptake in chemoresistant HepG2/cr cells (left panel) and parental HepG2 cells (right panel). The cellular uptake of cisplatin has been widely reported to be mediated by several membrane transporters, such as the copper transporter 1 (CTR1) and by passive diffusion [50]. Left panel: TG2-S may participate in multiple cellular events such as (1) recruitment and chaperoning of client proteins, such as p53 or BAX, for delivery to the autophagosome; (2) cross-linking of protein cargo and aggregate formation during autophagy; and (3) assisting the intracellular trafficking of autophagosomes and their fusion with endolysosomal vesicles by modulating the actin cytoskeleton dynamics. Right panel: TG2-S may be involved in BAX-induced Cytochrome C release and caspase activation, leading to apoptosis. The domains of TG2-S (in blue) are the core domain (central circle), the N-terminal domain (oval shape) and the C-terminal domain (rectangular shape). The aggresome is depicted in purple.

Similar articles

Cited by

References

    1. Forner A., Llovet J.M., Bruix J. Hepatocellular carcinoma. Lancet. 2012;379:1245–1255. doi: 10.1016/S0140-6736(11)61347-0. - DOI - PubMed
    1. Global Burden of Disease Cancer Collaboration. Fitzmaurice C., Allen C., Barber R.M., Barregard L., Bhutta Z.A., Brenner H., Dicker D.J., Chimed-Orchir O., Dandona R., et al. Global, Regional, and National Cancer Incidence, Mortality, Years of Life Lost, Years Lived With Disability, and Disability-Adjusted Life-years for 32 Cancer Groups, 1990 to 2015: A Systematic Analysis for the Global Burden of Disease Study. JAMA Oncol. 2017;3:524–548. - PMC - PubMed
    1. Galle P.R., Forner A., Llovet J.M., Mazzaferro V., Piscaglia F., Raoul J.-L., Schirmacher P., Vilgrain V. EASL clinical practice guidelines: Management of hepatocellular carcinoma. J. Hepatol. 2018;69:182–236. - PubMed
    1. Meng X.C., Chen B.H., Huang J.J., Huang W.S., Cai M.Y., Zhou J.W., Guo Y.J., Zhu K.S. Early prediction of survival in hepatocellular carcinoma patients treated with transarterial chemoembolization plus sorafenib. World J. Gastroenterol. 2018;24:484–493. doi: 10.3748/wjg.v24.i4.484. - DOI - PMC - PubMed
    1. Omata M., Cheng A.L., Kokudo N., Kudo M., Lee J.M., Jia J., Tateishi R., Han K.H., Chawla Y.K., Shiina S., et al. Asia-Pacific clinical practice guidelines on the management of hepatocellular carcinoma. Hepatol. Int. 2017;11:317–370. doi: 10.1007/s12072-017-9799-9. - DOI - PMC - PubMed