. 2024 May 13;46(5):4701-4720.
doi: 10.3390/cimb46050284.

A Spatial Transcriptomics Browser for Discovering Gene Expression Landscapes across Microscopic Tissue Sections

Affiliations

A Spatial Transcriptomics Browser for Discovering Gene Expression Landscapes across Microscopic Tissue Sections

Maria Schmidt et al. Curr Issues Mol Biol. .

Abstract

A crucial feature of life is its spatial organization and compartmentalization on the molecular, cellular, and tissue levels. Spatial transcriptomics (ST) technology has opened a new chapter of the sequencing revolution, emerging rapidly with transformative effects across biology. This technique produces extensive and complex sequencing data, raising the need for computational methods for their comprehensive analysis and interpretation. We developed the ST browser web tool for the interactive discovery of ST images, focusing on different functional aspects such as single gene expression, the expression of functional gene sets, as well as the inspection of the spatial patterns of cell-cell interactions. As a unique feature, our tool applies self-organizing map (SOM) machine learning to the ST data. Our SOM data portrayal method generates individual gene expression landscapes for each spot in the ST image, enabling its downstream analysis with high resolution. The performance of the spatial browser is demonstrated by disentangling the intra-tumoral heterogeneity of melanoma and the microarchitecture of the mouse brain. The integration of machine-learning-based SOM portrayal into an interactive ST analysis environment opens novel perspectives for the comprehensive knowledge mining of the organization and interactions of cellular ecosystems.

Keywords: 10x Visium technology; intra-tumoral heterogeneity microanatomy; melanoma; molecular biology; mouse brain; receptor–ligand interactions; self-organizing map (SOM) machine learning; spatial gene set analysis.


Conflict of interest statement

The authors declare no conflicts of interest.

Figures

Figure 5
Figure 5
Single gene and gene set coloring of the ST image: (a) Selected single genes show characteristic activation patterns in the ST images. The location of each of the genes is shown separately in the gene map by blue arrows. (b) Coloring according to the mean expression of gene signatures taken from the category ‘hallmarks of cancer’ (HM) [65]. The gene set maps show the distribution of the signature genes in the SOM. Accumulation of genes is highlighted by red circles.
Figure 1
Figure 1
The spatial transcriptomics browser is a novel functionality of the interactive oposSOM-Browser data mining tool [45], providing various options for gene profiling and function mining of ST data such as coloring of the images according to expression levels of selected genes, gene signatures, receptor–ligand interactions, and clusters of spots. It supplements already implemented modules of the oposSOM-Browser such as the expression module browser (providing details of the SOM expression landscape), pathway signal flow (PSF) browser (providing class-specific activation topologies of KEGG pathways), as well as gene and functional gene set browsers.
Figure 2
Figure 2
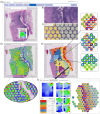
Data portrayal applies SOM to ST spots: (a) Screenshot of the H&E-stained (plain) image of the melanoma sample in the oposSOM-Browser. Hovering over the image with the cursor displays the expression portrait of the selected ST spot at the cursor’s position. (b) An enlarged view of the H&E image and (c) a second zoomed panel shows the cell type/cluster assignments of the spots as colored circles. (d) The ST image shows the SOM portraits of each of the spots as indicated in the enlargement. (e) Segmentation of the ST image into Seurat clusters enables zoomed-in discovery of the spot portrait environment at the cursor position. Three examples are shown on the right. (f) Clicking on a spot in the image opens a window that shows the spot portrait, the cell cluster archetypic portraits, a correlation-ranked list of cell types, and a zoomed-in image showing the portraits of the neighboring spots.
Figure 3
Figure 3
Spot cluster characteristics: (a) Clustering of the spots using the Louvain algorithm, as implemented in Seurat, segments the ST image into areas of different expression patterns (c1–c15). (b) The UMAP projection illustrates the similarity relations between the spots and the clusters. They aggregate into four major superclusters, which were assigned to type 1 (pigmentation), type 2 (inflammation), and proliferative tumor types, as well as to an epithelial cluster dominated by keratinocytes and fibroblasts. (c) Mean SOM portraits of the spot in each of the clusters characterize their expression landscapes. Modules of coregulated genes appear as red areas and are labeled with capital letters A–H. (d) Major biological context of the expression modules (see also Figure 4).
Figure 4
Figure 4
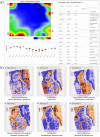
Modules of co-expressed genes and their spatial activation patterns: (a) The screenshot of the module browser shows the overview map (top left) and information about each module selected by clicking on the module (here module D), namely, the boxplot of its expression across the cluster (bottom left panel), and a table (right panel) listing the genes contained in the module, the enriched gene sets, as well as the activation across the cell types (in %). Modules B and H are omitted for clarity. (b) Module-specific spatial activation patterns reveal the underlying ST patterns. The modules relate to different cell subpopulations and biological processes, which can be further assessed in the module browser (see part (a)). Activated cluster numbers are indicated in the images.
Figure 6
Figure 6
ST of receptor–ligand (R-L) interactions: (a) Expression mapping of R-L pairs from different pathways indicates co-expression of R and L in different areas of the image (apricot color). (b) Hoovering indicates the respective spot portrait. Clicking opens the R-L interactions window with the list of top expressed interactions, their spatial distribution around the selected spot, and the map of receptor and ligand genes in the SOM (from left to right).
Figure 7
Figure 7
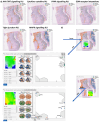
ST and SOM gene expression portrayal of the mouse brain: (a) Plain H&E image and cell cluster (Seurat), cell type, and spot portrait coloring of the image. (b) Cell-type expression portraits of neuronal and non-neuronal cells. (c) The module overview map provides an overview of the major expression modules labeled A–I. (d) Each of them transforms into a unique ST pattern. (e,f) ST of selected gene sets and receptor–ligand interactions support the functional interpretation of the microanatomy of the sample.

Similar articles

Cited by

References

    1. Allison D.B., Cui X., Page G.P., Sabripour M. Microarray data analysis: From disarray to consolidation and consensus. Nat. Rev. Genet. 2006;7:55–65. doi: 10.1038/nrg1749. - DOI - PubMed
    1. Reuter J.A., Spacek D.V., Snyder M.P. High-Throughput Sequencing Technologies. Mol. Cell. 2015;58:586–597. doi: 10.1016/j.molcel.2015.05.004. - DOI - PMC - PubMed
    1. Nagalakshmi U., Wang Z., Waern K., Shou C., Raha D., Gerstein M., Snyder M. The Transcriptional Landscape of the Yeast Genome Defined by RNA Sequencing. Science. 2008;320:1344–1349. doi: 10.1126/science.1158441. - DOI - PMC - PubMed
    1. Wang Z., Gerstein M., Snyder M. RNA-Seq: A revolutionary tool for transcriptomics. Nat. Rev. Genet. 2009;10:57–63. doi: 10.1038/nrg2484. - DOI - PMC - PubMed
    1. Sottoriva A., Spiteri I., Piccirillo S.G.M., Touloumis A., Collins V.P., Marioni J.C., Curtis C., Watts C., Tavaré S. Intratumor heterogeneity in human glioblastoma reflects cancer evolutionary dynamics. Proc. Natl. Acad. Sci. USA. 2013;110:4009–4014. doi: 10.1073/pnas.1219747110. - DOI - PMC - PubMed