. 2024 Apr 30;26(5):395.
doi: 10.3390/e26050395.

A Spectral Investigation of Criticality and Crossover Effects in Two and Three Dimensions: Short Timescales with Small Systems in Minute Random Matrices

Affiliations

A Spectral Investigation of Criticality and Crossover Effects in Two and Three Dimensions: Short Timescales with Small Systems in Minute Random Matrices

Eliseu Venites Filho et al. Entropy (Basel). .

Abstract

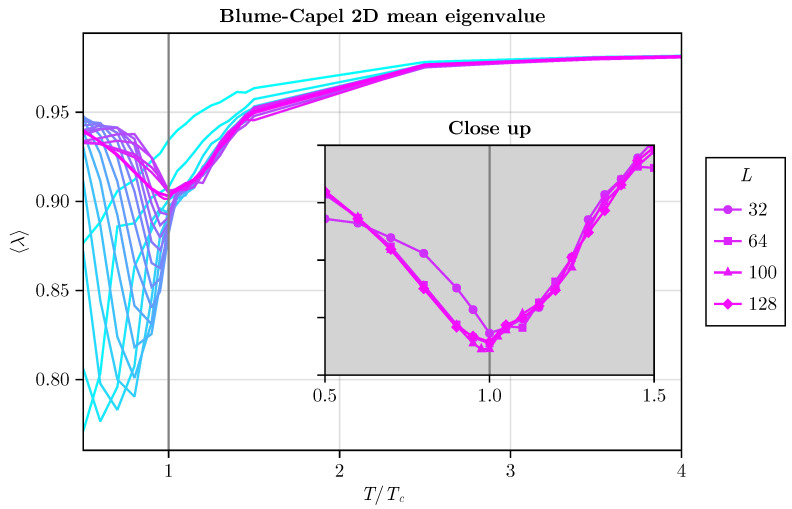
Random matrix theory, particularly using matrices akin to the Wishart ensemble, has proven successful in elucidating the thermodynamic characteristics of critical behavior in spin systems across varying interaction ranges. This paper explores the applicability of such methods in investigating critical phenomena and the crossover to tricritical points within the Blume-Capel model. Through an analysis of eigenvalue mean, dispersion, and extrema statistics, we demonstrate the efficacy of these spectral techniques in characterizing critical points in both two and three dimensions. Crucially, we propose a significant modification to this spectral approach, which emerges as a versatile tool for studying critical phenomena. Unlike traditional methods that eschew diagonalization, our method excels in handling short timescales and small system sizes, widening the scope of inquiry into critical behavior.

Keywords: Wishart matrix; crossover phenomena; phase transitions; random matrices.


Conflict of interest statement

The authors declare no conflict of interest.

Figures

Figure A1
Figure A1
Spectral variance as a function of various values of t=T/TC for D=0, including t=1, is presented. We provide fits using the Boltzmann, logistic, and a function exhibiting a unique type of inflection point at t=1.
Figure 1
Figure 1
The phase diagrams for the two- and three-dimensional BC models are depicted. The points utilized in our numerical experiments are extracted from Butera and Pernici [50], serving as foundational data for the investigations conducted in this study.
Figure 2
Figure 2
The density of states in the two-dimensional BC model with anisotropy (D=1). The gap between eigenvalues varies with the temperature of the simulated system. While the system approaches the MP law, an exact match is not achieved at high temperatures (T>TC) due to the presence of spin–spin correlations, preventing complete correspondence.
Figure 3
Figure 3
The density of states for anisotropy D=1 in the three-dimensional BC model. Similar behavior in the gap between two bulk eigenvalues is observed compared to the two-dimensional BC model (see Figure 2).
Figure 4
Figure 4
Average and variance of the two-dimensional BC model as a function of temperature are depicted. The inset plots show the derivative of the variance, indicating a divergence at T=TC.
Figure 5
Figure 5
The average and variance of the three-dimensional BC model as a function of temperature illustrate a similar behavior occurring in three dimensions. The inset plots depict the derivative of the variance, highlighting its divergence at T=TC. Interestingly, it is observed that the inflection point appears to be even more pronounced in three dimensions.
Figure 6
Figure 6
Second derivative of variance (ζ) for both the two-dimensional and three-dimensional BC models. The critical temperature precisely corresponds to the inflection point of the eigenvalue variance, indicated by ζ<0 for T<TC and ζ>0 for T>TC.
Figure 7
Figure 7
Average eigenvalue approaching the TCP in the two-dimensional BC model. We can observe that the shape of the curve is deformed as we approach the TCP on the critical line.
Figure 8
Figure 8
Eigenvalue variance as a function of temperature approaches the TCP in the 2D BC model. The method appears to reasonably respond even for points closer to the TCP. We can observe the inflection point up to just before the TCP, but we also notice a small deviation between the critical exact values and those determined by the method due to the crossover. At this precise TCP, there is a peak at the tricritical temperature that shifts from the previous points. Interestingly, at the TCP we do not observe the inflection point in two dimensions.
Figure 9
Figure 9
Average eigenvalue approaching the TCP in the 3D BC model, mirroring the analysis conducted for the 2D version shown in Figure 7.
Figure 10
Figure 10
Eigenvalue variance approaching the TCP in the 3D BC model. We can observe the inflection point until the TCP, but that slightly differs from the best estimates of the critical temperatures in this vicinity of the TCP.
Figure 11
Figure 11
Averaged maximum eigenvalue as a function of T/TC for different values of D in the two-dimensional BC model.
Figure 12
Figure 12
Averaged maximum eigenvalue as function of T/TC for different values of D in the three-dimensional BC model.
Figure 13
Figure 13
The average eigenvalue as a function of T/TC for different linear system sizes is depicted. We start with L=2,3,4,...,16, then proceed to larger sizes, including L=20, 25, 30, 32, 64, 100, and 128 for the two-dimensional BC model with D=0, chosen for simplicity. The inset plot illustrates that for L32, the minimum at T=TC coincides. With L64, there is excellent agreement.
Figure 14
Figure 14
Average eigenvalue plotted against T/TC for various linear system sizes. We consider L=2, 4, 8, 10, 16, and 22 in a three-dimensional BC model with D=0 for simplicity. The inset plot highlights that, for L16, the minimum occurs at precisely T=TC.

References

    1. Stanley H.E. Introduction to Phase Transitions and Critical Phenomena. Oxford Science Publications; Oxford, UK: 1987.
    1. Bouchaud J., Potters M. Theory of Financial Risk and Derivative Pricing. Cambridge University Press; Cambridge, UK: 2003.
    1. Castellano C., Fortunato S., Loreto V. Statistical physics of social dynamics. Rev. Mod. Phys. 2009;81:591–646. doi: 10.1103/RevModPhys.81.591. - DOI
    1. Szabo G., Fath G. Evolutionary games on graphs. Phys. Rep. 2007;446:97–216. doi: 10.1016/j.physrep.2007.04.004. - DOI
    1. Barabasi A.-L. Network Science. Cambridge University Press; Cambridge, UK: 2016.

LinkOut - more resources