. 2024 Apr 27;14(5):524.
doi: 10.3390/biom14050524.

Unraveling the Etiology of Dilated Cardiomyopathy through Differential miRNA-mRNA Interactome

Affiliations

Unraveling the Etiology of Dilated Cardiomyopathy through Differential miRNA-mRNA Interactome

Fernando Bonet et al. Biomolecules. .

Abstract

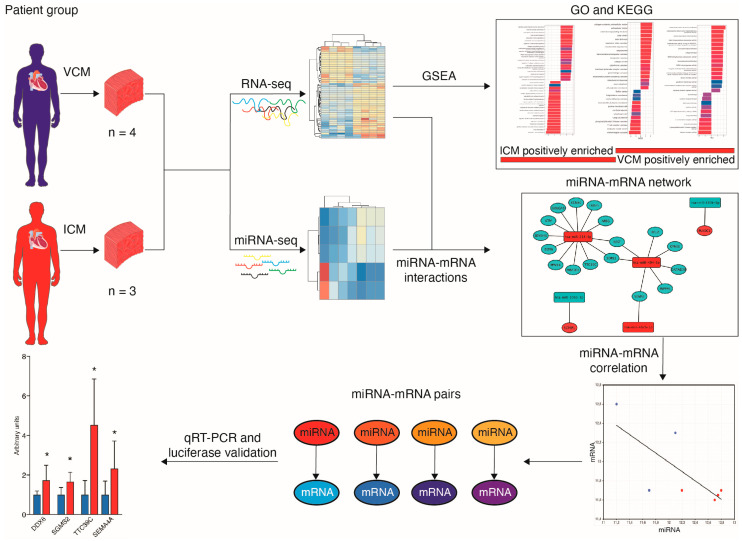
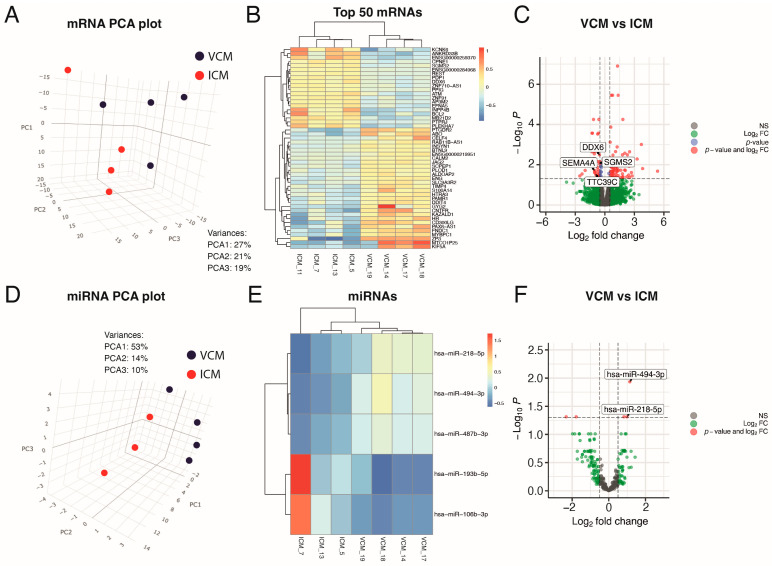
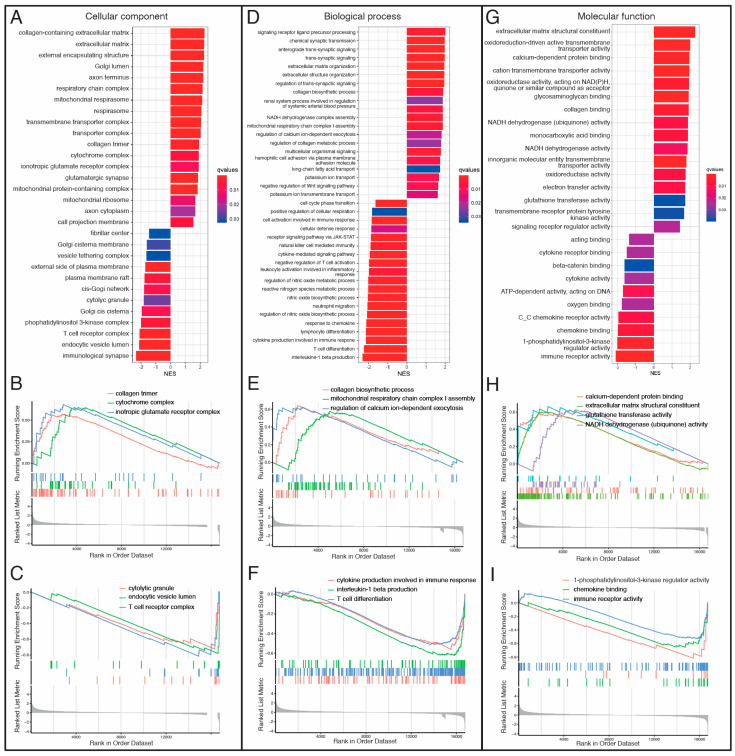
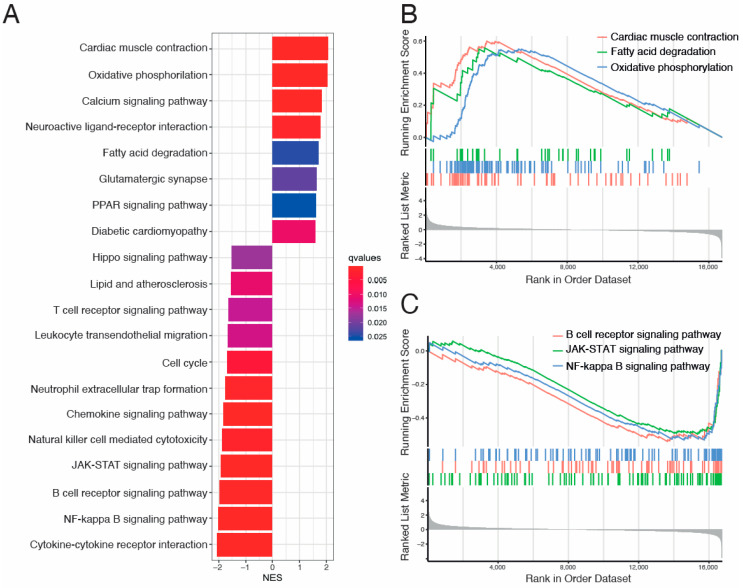
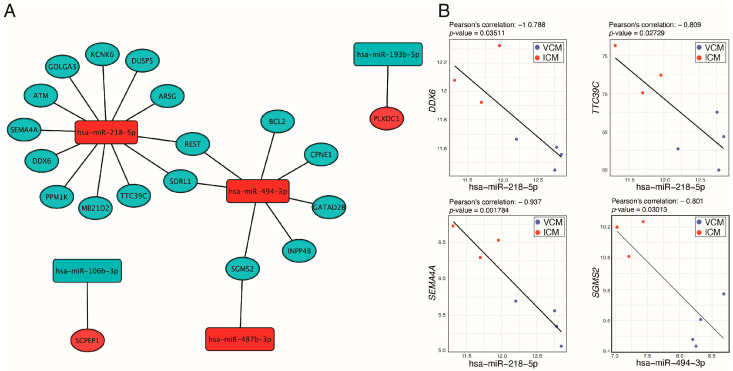
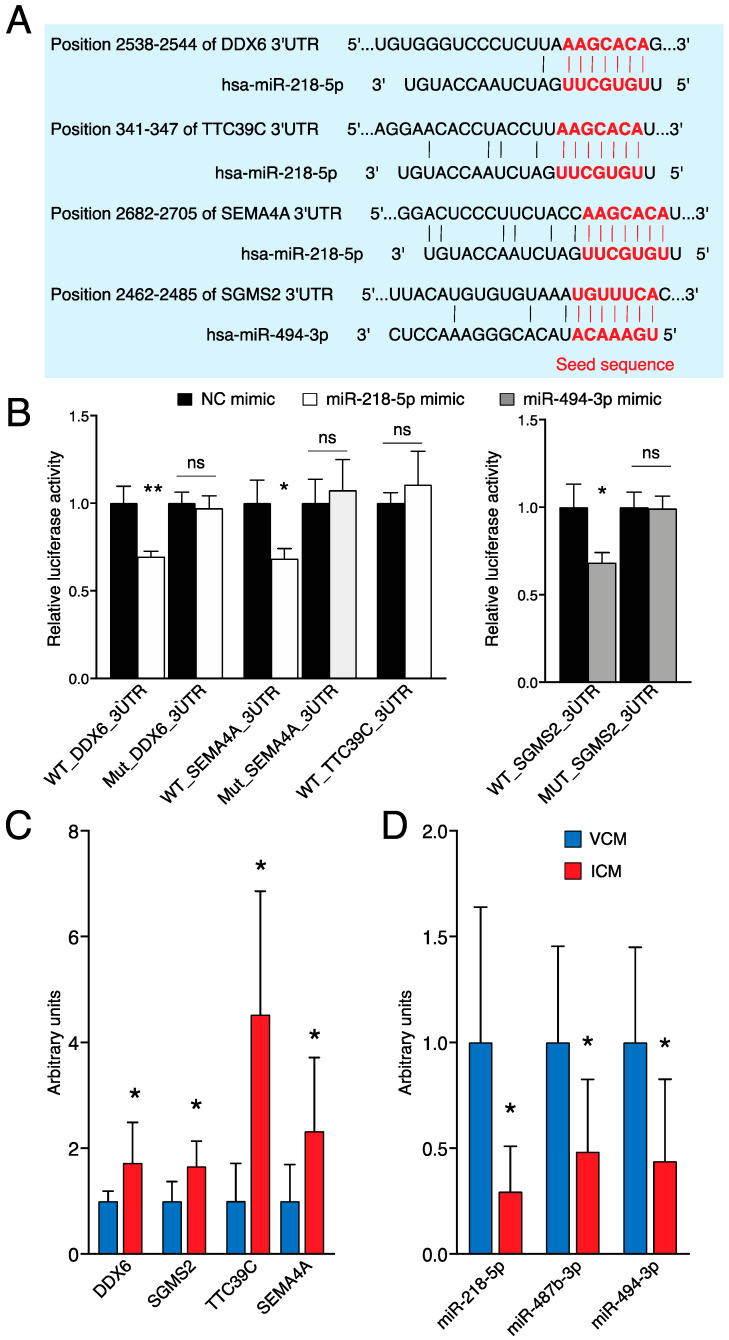
Dilated cardiomyopathy (DCM) encompasses various acquired or genetic diseases sharing a common phenotype. The understanding of pathogenetic mechanisms and the determination of the functional effects of each etiology may allow for tailoring different therapeutic strategies. MicroRNAs (miRNAs) have emerged as key regulators in cardiovascular diseases, including DCM. However, their specific roles in different DCM etiologies remain elusive. Here, we applied mRNA-seq and miRNA-seq to identify the gene and miRNA signature from myocardial biopsies from four patients with DCM caused by volume overload (VCM) and four with ischemic DCM (ICM). Gene Ontology (GO) and Kyoto Encyclopedia of Genes and Genomes (KEGG) enrichment analysis were used for differentially expressed genes (DEGs). The miRNA-mRNA interactions were identified by Pearson correlation analysis and miRNA target-prediction programs. mRNA-seq and miRNA-seq were validated by qRT-PCR and miRNA-mRNA interactions were validated by luciferase assays. We found 112 mRNAs and five miRNAs dysregulated in VCM vs. ICM. DEGs were positively enriched for pathways related to the extracellular matrix (ECM), mitochondrial respiration, cardiac muscle contraction, and fatty acid metabolism in VCM vs. ICM and negatively enriched for immune-response-related pathways, JAK-STAT, and NF-kappa B signaling. We identified four pairs of negatively correlated miRNA-mRNA: miR-218-5p-DDX6, miR-218-5p-TTC39C, miR-218-5p-SEMA4A, and miR-494-3p-SGMS2. Our study revealed novel miRNA-mRNA interaction networks and signaling pathways for VCM and ICM, providing novel insights into the development of these DCM etiologies.

Keywords: RNA sequencing; dilated cardiomyopathy; etiology; ischemic cardiomyopathy; microRNA; volume overload.


Conflict of interest statement

The authors declare no conflicts of interest. The funders had no role in the design of the study; in the collection, analyses, or interpretation of data; in the writing of the manuscript; or in the decision to publish the results.

Figures

Figure 1
Figure 1
A flowchart of the study design * p < 0.05.
Figure 2
Figure 2
Exploratory analysis of paired miRNA and mRNA expression in heart samples. (A) 3D principal components analysis plot, based on correlation matrix, for mRNA expression in VCM (n = 4) and ICM (n = 4) tissue samples. (B) Heatmap of the top-50 most differentially expressed mRNAs sorted by absolute FC (all of them having FDR < 0.05). (C) Volcano plot of the mRNAs, highlighting in gray those not statistically significant, with FDR > 0.05 and absolute FC > 1.42 (abslog2FC > 0.5), in blue those with FDR < 0.05 but absolute FC > 1.42 (abslog2FC > 0.5), in green those with absolute FC > 1.42 (abslog2FC > 0.5) but FDR > 0.05, and in red those with FDR < 0.05 and absolute FC > 1.42 (abslog2FC > 0.5). (D) 3D principal components analysis plot, based on correlation matrix, for miRNA expression in VCM (n = 4) and ICM (n = 3) tissue samples. (E) Heatmap of the only 5 differentially expressed miRNAs sorted by absolute FC (all of them having FDR < 0.05). (F) Volcano plot of the miRNAs highlighting in gray those not statistically significant with FDR > 0.05 and absolute FC > 1.42 (abslog2FC > 0.5), in green those with absolute FC > 1.42 (abslog2FC > 0.5) but FDR > 0.05 and in red those with FDR < 0.05 and absolute FC > 1.42 (abslog2FC > 0.5).
Figure 3
Figure 3
Gene Ontology (GO) Gene Set Enrichment Analysis (GSEA) between VCM and ICM groups. (A) Bar plot for cellular component (CC) analysis ranked by Normalized Enrichment Score (NES). (B) Gseaplot for “collagen trimer”, “cytochrome complex”, and “ionotropic glutamate receptor” upregulated GO terms showing the running score and preranked list of GSEA and its association of phenotype in CC analysis. (C) Gseaplot for “cytolytic granule”, “endocytic vesicle lumen”, and “T cell receptor complex” downregulated GO terms showing the running score and preranked list of GSEA and its association of phenotype in CC analysis. (D) Bar plot for biological process (BP) analysis ranked by Normalized Enrichment Score (NES). (E) Gseaplot for “collagen biosynthetic process”, “mitochondrial respiratory chain complex I assembly”, and “regulation of calcium ion-dependent exocytosis” upregulated GO terms showing the running score and preranked list of GSEA and its association of phenotype in BP analysis. (F) GSEA plot for “cytokine production involved in immune response”, “interleukin-1 beta production”, and “T cell differentiation” downregulated GO terms showing the running score and preranked list of GSEA and its association of phenotype in BP analysis. (G) Bar plot for molecular function (MF) analysis ranked by Normalized Enrichment Score (NES). (H) GSEA plot for “calcium-dependent protein binding”, “extracellular matrix structural constituent”, “glutathione transferase activity”, and “NADH dehydrogenase (ubiquinone) activity” upregulated GO terms showing the running score and preranked list of GSEA and its association of phenotype in MF analysis. (I) GSEA plot for “1-phosphatidylinositol-3-kinase regulator activity”, “chemokine binding”, and “immune receptor activity” downregulated GO terms showing the running score and preranked list of GSEA and its association of phenotype in MF analysis. NES: normalized enrichment scores.
Figure 4
Figure 4
Kyoto Encyclopedia of Genes and Genomes (KEGG) Gene Set Enrichment Analysis (GSEA) between VCM and ICM groups. (A) Bar plot for KEGG analysis ranked by Normalized Enrichment Score (NES). (B) GSEA plot for “Cardiac muscle contraction”, “Fatty acid degradation”, and “Oxidative phosphorylation” upregulated KEGG terms showing the running score and preranked list of GSEA and its association of phenotype. (C) GSEA plot for “B cell receptor signaling pathway”, “JAK-STAT signaling pathway”, and “NF-kappa B signaling pathway” downregulated KEGG terms showing the running score and preranked list of GSEA and its association of phenotype. NES: normalized enrichment scores.
Figure 5
Figure 5
miRNA–miRNA interaction analysis. (A) Network of selected miRNA–mRNA interactions. (B) Negatively correlated miRNA–mRNA pairs predicted simultaneously, at least, in three used databases in our pipeline. Red and blue nodes mean upregulated and downregulated in VCM vs. ICM, respectively.
Figure 6
Figure 6
miR-218-5p targets DDX6 and SEMA4A and miR-494-3p targets SGMS2. (A) Predicted miR-218-5p binding sites in the 3’UTR of DDX6, TTC39C, and SEMA4A, and predicted miR-494-3p binding sites in the 3’UTR of SGMS2. The red nucleotides are referenced to seed sequence and sequence complementary to seed sequence of miRNA and 3’UTR, respectively. (B) Dual-luciferase activity assay in 3T3 cells co-transfected with the pMIR-REPORT miRNA expression reporter vector containing the wild-type (WT) or mutant (Mut) DDX6, TTC39C, or SEMA4A 3’UTR fragment with miR-218-5p mimic, and the pMIR-REPORT miRNA expression reporter vector containing the wild-type (WT) or mutant (Mut) SGMS2 3’UTR fragment with miR-494-3p mimic for 18 h (n = 3). (C) Expression levels of DDX6, TTC39C, SEMA4A, and SGMS2 in VCM (n = 9) vs. ICM (n = 6) analyzed by qRT-PCR. (D) Expression levels of miR-218-5p, miR-487b-3p, and miR-494-3p in VCM (n = 9) vs. ICM (n = 6) analyzed by qRT-PCR. ** p < 0.01; * p < 0.05. ns: nonsignificant; NC: negative control.

Similar articles

Cited by

References

    1. Fatkin D. Guidelines for the Diagnosis and Management of Familial Dilated Cardiomyopathy. Heart Lung Circ. 2011;20:691–693. doi: 10.1016/j.hlc.2011.07.008. - DOI - PubMed
    1. Kittleson M.M., Ye S.Q., Irizarry R.A., Minhas K.M., Edness G., Conte J.V., Parmigiani G., Miller L.W., Chen Y., Hall J.L., et al. Identification of a Gene Expression Profile That Differentiates between Ischemic and Nonischemic Cardiomyopathy. Circulation. 2004;110:3444–3451. doi: 10.1161/01.CIR.0000148178.19465.11. - DOI - PubMed
    1. Merlo M., Gentile P., Artico J., Cannatà A., Paldino A., De Angelis G., Barbati G., Alonge M., Gigli M., Pinamonti B., et al. Arrhythmic Risk Stratification in Patients with Dilated Cardiomyopathy and Intermediate Left Ventricular Dysfunction. J. Cardiovasc. Med. 2019;20:343–350. doi: 10.2459/JCM.0000000000000792. - DOI - PubMed
    1. Merlo M., Cannatà A., Gobbo M., Stolfo D., Elliott P.M., Sinagra G. Evolving Concepts in Dilated Cardiomyopathy. Eur. J. Heart Fail. 2018;20:228–239. doi: 10.1002/ejhf.1103. - DOI - PubMed
    1. Liew C.-C., Dzau V.J. Molecular Genetics and Genomics of Heart Failure. Nat. Rev. Genet. 2004;5:811–825. doi: 10.1038/nrg1470. - DOI - PubMed