. 2024 Apr 29;14(5):532.
doi: 10.3390/biom14050532.

Metabolomics Analysis Identifies Differential Metabolites as Biomarkers for Acute Myocardial Infarction

Affiliations

Metabolomics Analysis Identifies Differential Metabolites as Biomarkers for Acute Myocardial Infarction

Jie Zhou et al. Biomolecules. .

Abstract

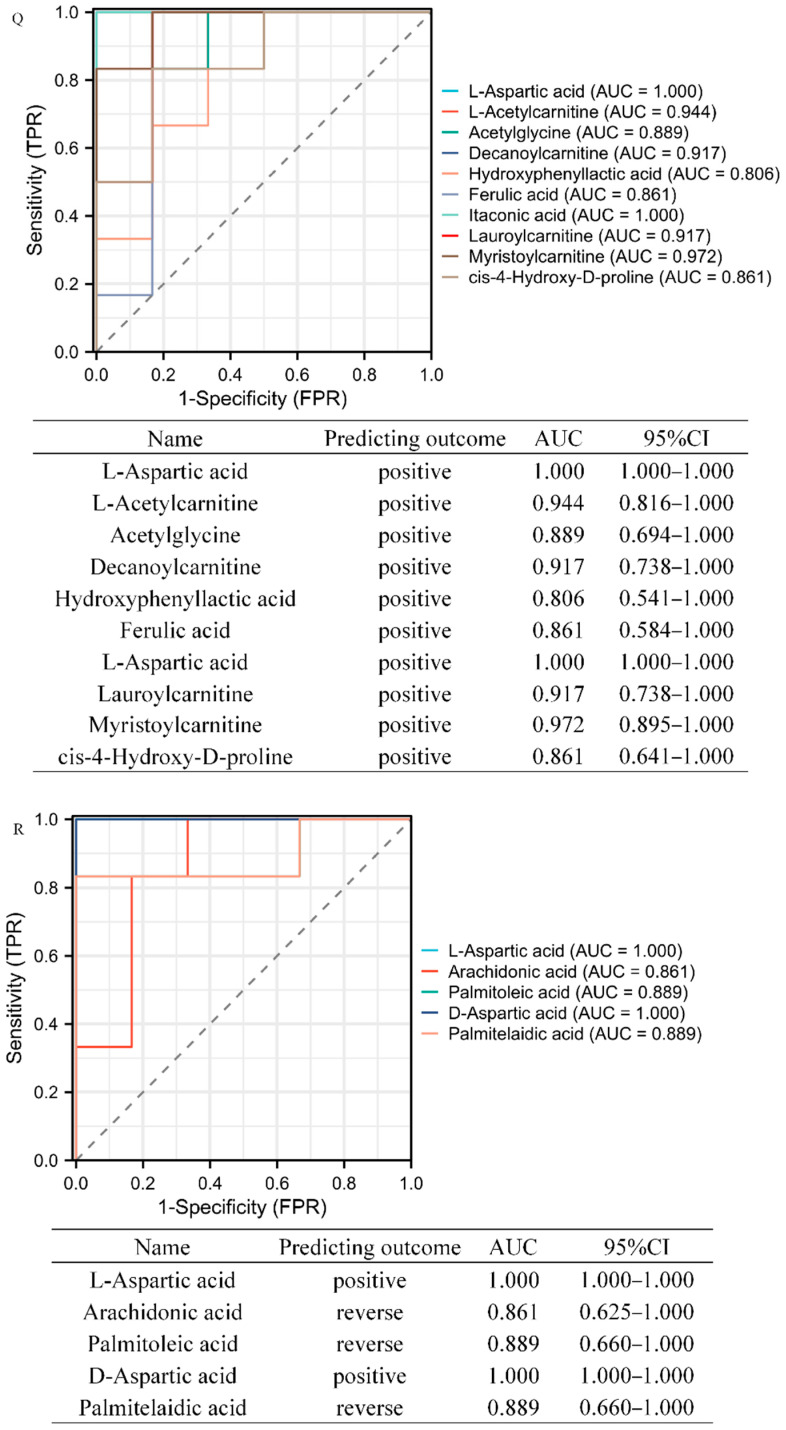
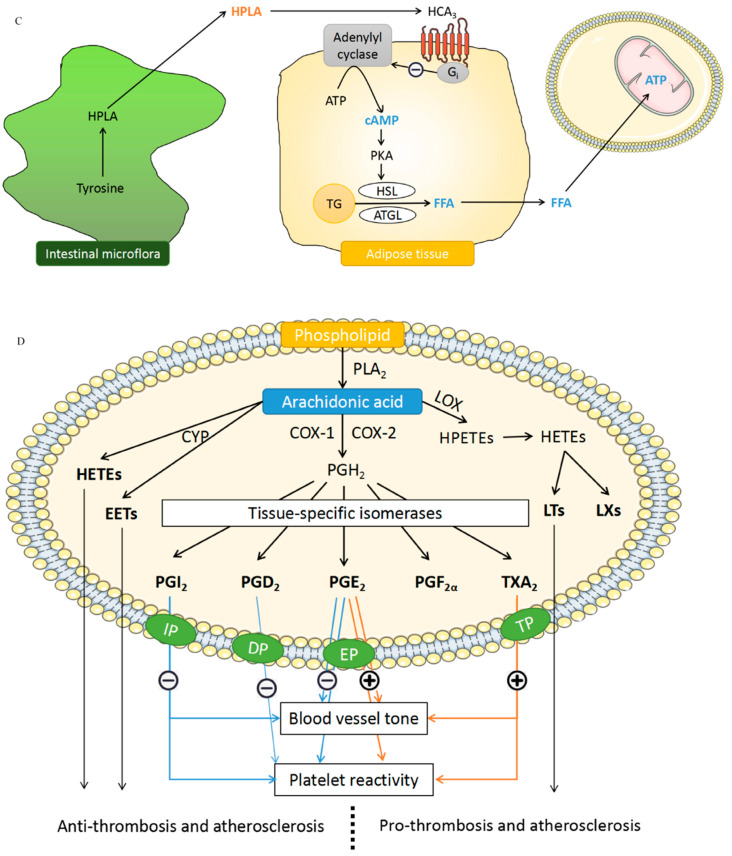
Myocardial infarction (MI), including ST-segment elevation MI (STEMI) and non-ST-segment elevation MI (NSTEMI), is still a leading cause of death worldwide. Metabolomics technology was used to explore differential metabolites (DMs) as potential biomarkers for early diagnosis of STEMI and NSTEMI. In the study, 2531 metabolites, including 1925 DMs, were discovered. In the selected 27 DMs, 14 were successfully verified in a new cohort, and the AUC values were all above 0.8. There were 10 in STEMI group, namely L-aspartic acid, L-acetylcarnitine, acetylglycine, decanoylcarnitine, hydroxyphenyllactic acid, ferulic acid, itaconic acid, lauroylcarnitine, myristoylcarnitine, and cis-4-hydroxy-D-proline, and 5 in NSTEMI group, namely L-aspartic acid, arachidonic acid, palmitoleic acid, D-aspartic acid, and palmitelaidic acid. These 14 DMs may be developed as biomarkers for the early diagnosis of MI with high sensitivity and specificity. These findings have particularly important clinical significance for NSTEMI patients because these patients have no typical ECG changes.

Keywords: NSTEMI; STEMI; acute coronary syndrome; biomarker; metabolomics.


Conflict of interest statement

The authors declare no conflict of interest.

Figures

Figure 1
Figure 1
Workflow for the metabolomics study. Firstly, plasma samples were collected, and non-targeted metabolomics was used to identify differential metabolites (DMs) in the STEMI, NSTEMI, UA, and CONTROL groups. After bioinformatics analysis and literature search, some of the DMs were selected and validated by targeted metabolomics in the STEMI, NSTEMI, and CONTROL. The validation results were shown by grouping comparison chart and ROC curve chart in other figures.
Figure 2
Figure 2
Cluster analysis and enrichment analysis of differential metabolites (DMs) in non-targeted metabolomics. (A) Metabolites classification bar chart. (B) Metabolic pathway classification bar chart. (C) Quantitative statistical chart of DMs. (D) UpSet diagram of DMs. (E) Volcanic map of DMs. (F) Cluster analysis heatmap of DMs. (G) Column diagram of metabolic pathway enrichment analysis. (The top 10 metabolic pathways with the smallest p value were drawn as column charts) (H) Bubble diagram of metabolic pathway enrichment analysis. (The X-axis Rich Factor is the number of DMs annotated in this pathway divided by all identified metabolites annotated in this pathway. The higher the value is, the higher the ratio of the DMs annotated in this pathway. The dot size represents the number of DMs annotated in this pathway).
Figure 2
Figure 2
Cluster analysis and enrichment analysis of differential metabolites (DMs) in non-targeted metabolomics. (A) Metabolites classification bar chart. (B) Metabolic pathway classification bar chart. (C) Quantitative statistical chart of DMs. (D) UpSet diagram of DMs. (E) Volcanic map of DMs. (F) Cluster analysis heatmap of DMs. (G) Column diagram of metabolic pathway enrichment analysis. (The top 10 metabolic pathways with the smallest p value were drawn as column charts) (H) Bubble diagram of metabolic pathway enrichment analysis. (The X-axis Rich Factor is the number of DMs annotated in this pathway divided by all identified metabolites annotated in this pathway. The higher the value is, the higher the ratio of the DMs annotated in this pathway. The dot size represents the number of DMs annotated in this pathway).
Figure 3
Figure 3
Cluster and enrichment analysis of differential metabolites verified by targeted metabolomics. (A) Metabolite classification bar chart. (B) Metabolic pathway classification bar chart. (C) Column chart of metabolic pathway enrichment analysis of “STEMI–CTRL”. (D) Bubble diagram of metabolic pathway enrichment analysis of “STEMI–CTRL”. (E) Column chart of metabolic pathway enrichment analysis of “NSTEMI–CTRL”. (F) Bubble diagram of metabolic pathway enrichment analysis of “NSTEMI–CTRL”. (G) Column chart of metabolic pathway enrichment analysis of “STEMI–NSTEMI”. (H) Bubble diagram of metabolic pathway enrichment analysis of “STEMI–NSTEMI”.
Figure 3
Figure 3
Cluster and enrichment analysis of differential metabolites verified by targeted metabolomics. (A) Metabolite classification bar chart. (B) Metabolic pathway classification bar chart. (C) Column chart of metabolic pathway enrichment analysis of “STEMI–CTRL”. (D) Bubble diagram of metabolic pathway enrichment analysis of “STEMI–CTRL”. (E) Column chart of metabolic pathway enrichment analysis of “NSTEMI–CTRL”. (F) Bubble diagram of metabolic pathway enrichment analysis of “NSTEMI–CTRL”. (G) Column chart of metabolic pathway enrichment analysis of “STEMI–NSTEMI”. (H) Bubble diagram of metabolic pathway enrichment analysis of “STEMI–NSTEMI”.
Figure 4
Figure 4
Wayne diagram, grouping comparison diagram and ROC analysis of the 15 differential metabolites (DMs). (A) Wayne diagram of DMs. (BK) Grouping comparison chart of DMs expression in “STEMI–CTRL” group. (LP) Grouping comparison chart of DMs expression in “NSTEMI–CTRL” group. (For (BP), the error lines represent the mean ± standard error (SEM), respectively.) (Q) ROC curve chart of “STEMI–CTRL”. (R) ROC curve chart of “NSTEMI–CTRL”. (For (Q,R), “positive” stands for DMs’ upward adjustment and “reverse” stands for DMs’ downward adjustment).
Figure 4
Figure 4
Wayne diagram, grouping comparison diagram and ROC analysis of the 15 differential metabolites (DMs). (A) Wayne diagram of DMs. (BK) Grouping comparison chart of DMs expression in “STEMI–CTRL” group. (LP) Grouping comparison chart of DMs expression in “NSTEMI–CTRL” group. (For (BP), the error lines represent the mean ± standard error (SEM), respectively.) (Q) ROC curve chart of “STEMI–CTRL”. (R) ROC curve chart of “NSTEMI–CTRL”. (For (Q,R), “positive” stands for DMs’ upward adjustment and “reverse” stands for DMs’ downward adjustment).
Figure 5
Figure 5
Diagram of the integrated metabolic pathways of the 14 differential metabolites in myocardial infarction discovered from this study. The metabolic pathway integration map contains 11 metabolic pathways of 13 differential metabolites (metabolic pathway of ferulic acid related biological system was not found in the database), including the following 10 modified KEGG maps: “hsa00470 D-Amino acid metabolism”, “hsa00020 Citrate cycle (TCA cycle)”, “hsa00061 Fatty acid biosynthesis”, “hsa00250 Alanine, aspartate, and glutamate metabolism”, “hsa00260 Glycine, serine, and threonine metabolism”, “hsa01100 Metabolic pathways”, “hsa01040 Biosynthesis of unsaturated fatty acids”, “hsa01212 Fatty acid metabolism”, “hsa00564 Glycerophospholipid metabolism”, “hsa00590 Arachidonic acid metabolism” and 1 pathway obtained from the literature review, “Microbial metabolism of tyrosine. (Dots represent metabolites, red is upregulated and blue is downregulated. The line represents the metabolic pathway, the straight line is quoted by KEGG, and the dotted line is quoted by literature review).
Figure 6
Figure 6
Schematic diagram of mechanism of action for the differential metabolites (DMs). (A) Schematic diagram of the influence mechanism of the DMs on intracellular fatty acid metabolism, β-oxidation, and TCA cycle. (C10: decanoylcarnitine; C12: lauroylcarnitine; C14: myristoylcarnitine; ACSL: long-chain isomer of acetyl-CoA synthetase; CPT1: carnitine palmitoyl transferase 1; CAT: carnitine acyltransferase.) (B) Direct influence of DMs on TCA cycle and schematic diagram of related mechanisms. (Sdh: succinate dehydrogenase.) (C) Schematic diagram of the mechanism of action of hydroxyphenylacetic acid. (HPLA: hydroxyphenyllactic acid; FFA: free fatty acids). (D) Schematic diagram of the mechanism of action of arachidonic acid. (COX: cyclooxygenase, CYP: cytochrome P450 enzyme, LOX: lipid oxygenase, HETEs: hydroxyeicosatetraenoic acid, LTs: leukotriene, LXs: lipoxin, EETs: epoxeicosatrienoic acid.) [Some of the pictures in this figure are from smart.servier.com] (accessed on 6 July 2023).
Figure 6
Figure 6
Schematic diagram of mechanism of action for the differential metabolites (DMs). (A) Schematic diagram of the influence mechanism of the DMs on intracellular fatty acid metabolism, β-oxidation, and TCA cycle. (C10: decanoylcarnitine; C12: lauroylcarnitine; C14: myristoylcarnitine; ACSL: long-chain isomer of acetyl-CoA synthetase; CPT1: carnitine palmitoyl transferase 1; CAT: carnitine acyltransferase.) (B) Direct influence of DMs on TCA cycle and schematic diagram of related mechanisms. (Sdh: succinate dehydrogenase.) (C) Schematic diagram of the mechanism of action of hydroxyphenylacetic acid. (HPLA: hydroxyphenyllactic acid; FFA: free fatty acids). (D) Schematic diagram of the mechanism of action of arachidonic acid. (COX: cyclooxygenase, CYP: cytochrome P450 enzyme, LOX: lipid oxygenase, HETEs: hydroxyeicosatetraenoic acid, LTs: leukotriene, LXs: lipoxin, EETs: epoxeicosatrienoic acid.) [Some of the pictures in this figure are from smart.servier.com] (accessed on 6 July 2023).

Similar articles

Cited by

References

    1. Bhatt D.L., Lopes R.D., Harrington R.A. Diagnosis and treatment of acute coronary syndromes: A review. JAMA. 2022;327:662–675. doi: 10.1001/jama.2022.0358. - DOI - PubMed
    1. American Heart Association Focus on Quality. [(accessed on 28 April 2023)]. Available online: http://www.heart.org/en/professional/quality-improvement.
    1. Boateng S., Sanborn T. Acute myocardial infarction. Disease-a-Month. 2013;59:83–96. doi: 10.1016/j.disamonth.2012.12.004. - DOI - PubMed
    1. Tsao C.W., Aday A.W., Almarzooq Z.I., Anderson C.A., Arora P., Avery C.L., Baker-Smith C.M., Beaton A.Z., Boehme A.K., Buxton A.E., et al. Heart disease and stroke statistics-2023 update: A report from the American Heart Association. Circulation. 2023;147:e93–e621. doi: 10.1161/CIR.0000000000001123. - DOI - PubMed
    1. Surendran A., Atefi N., Zhang H., Aliani M., Ravandi A. Defining acute coronary syndrome through metabolomics. Metabolites. 2021;11:685. doi: 10.3390/metabo11100685. - DOI - PMC - PubMed