. 2024 May 10;13(10):813.
doi: 10.3390/cells13100813.

Senotherapeutic Peptide 14 Suppresses Th1 and M1 Human T Cell and Monocyte Subsets In Vitro

Affiliations

Senotherapeutic Peptide 14 Suppresses Th1 and M1 Human T Cell and Monocyte Subsets In Vitro

Thuany Alencar-Silva et al. Cells. .

Abstract

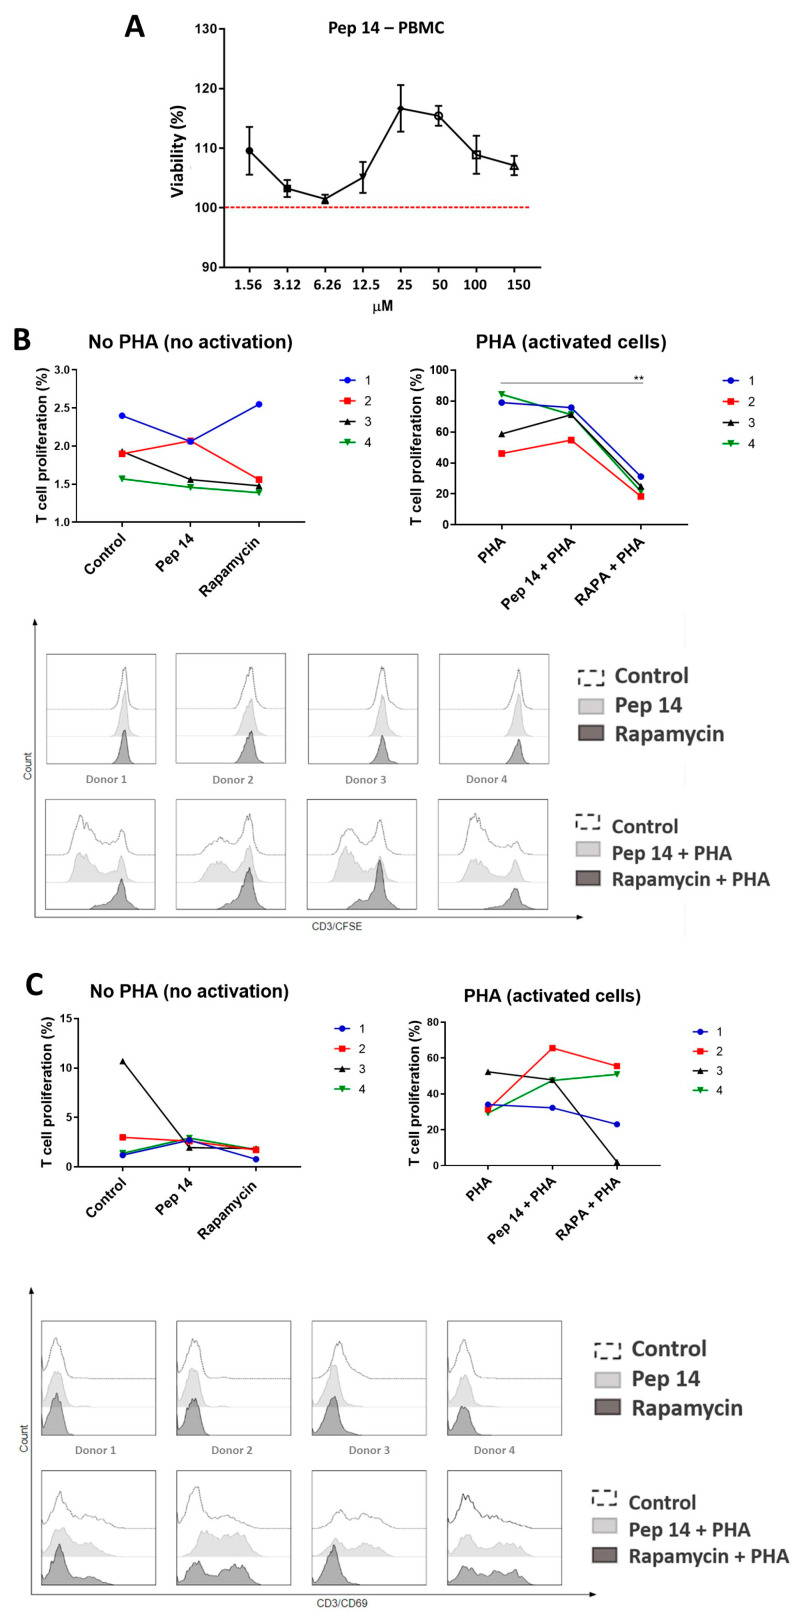
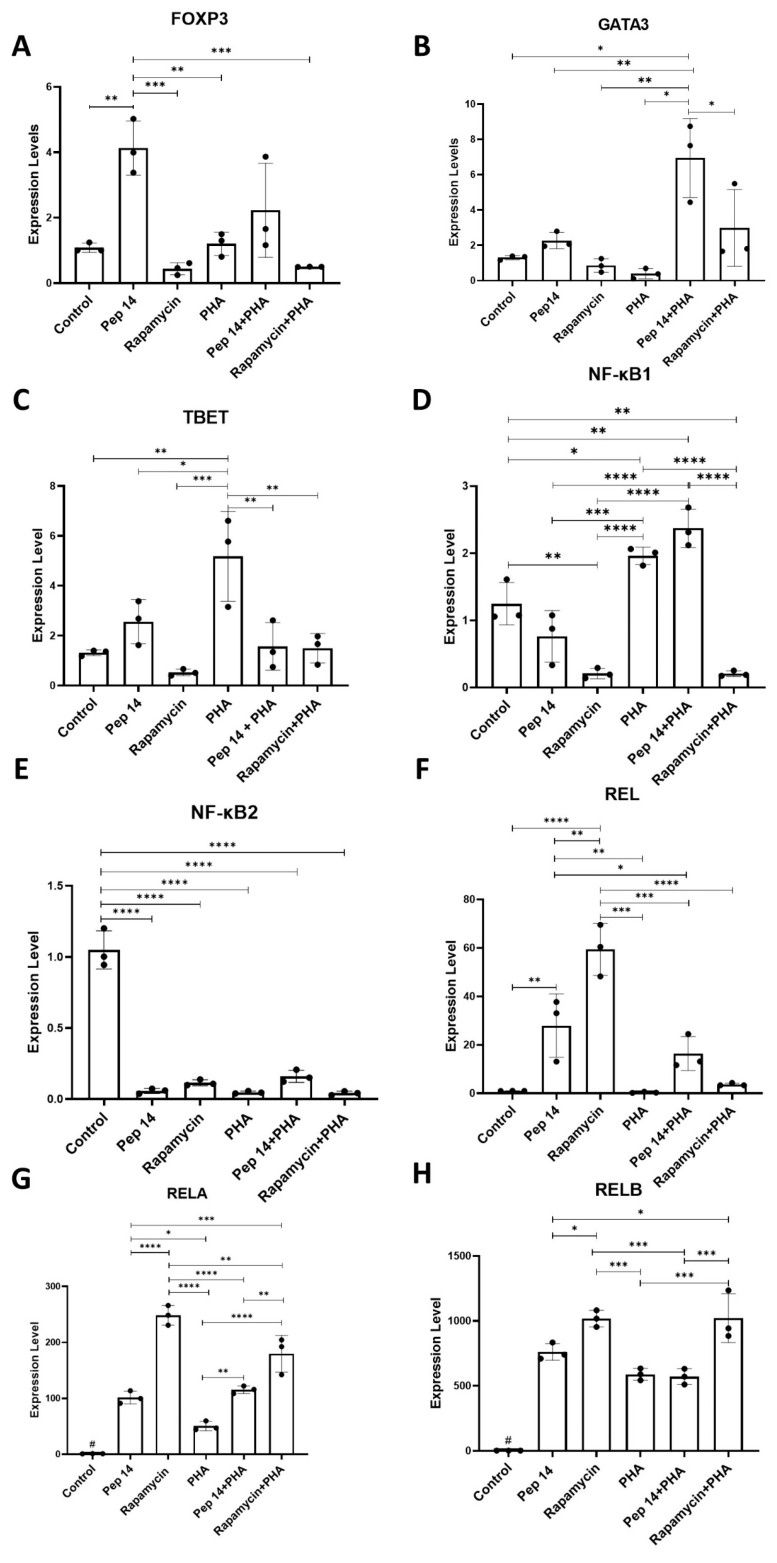
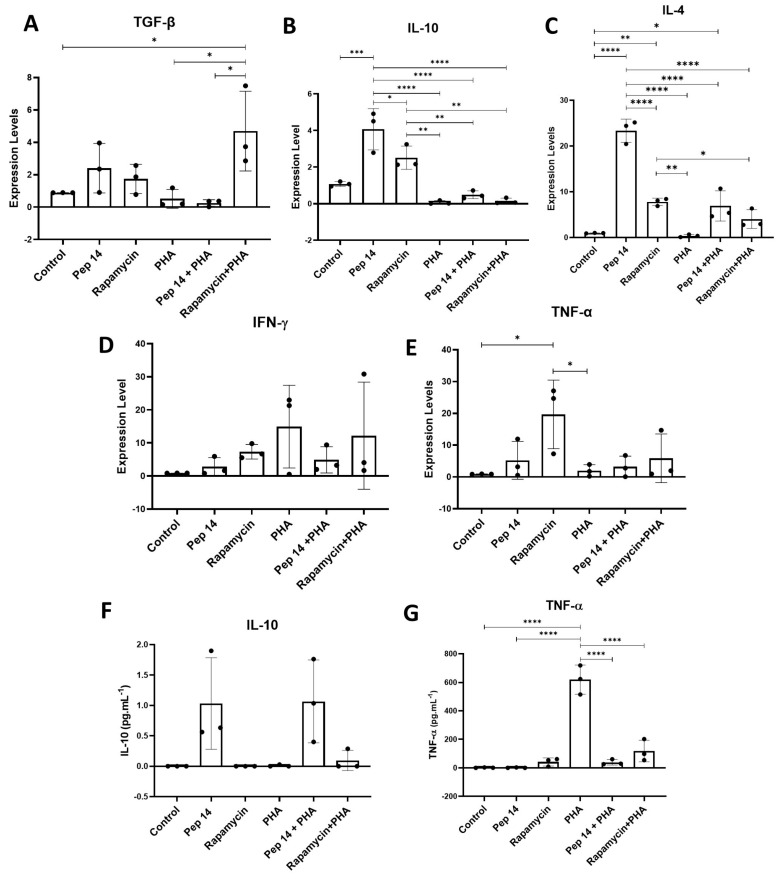
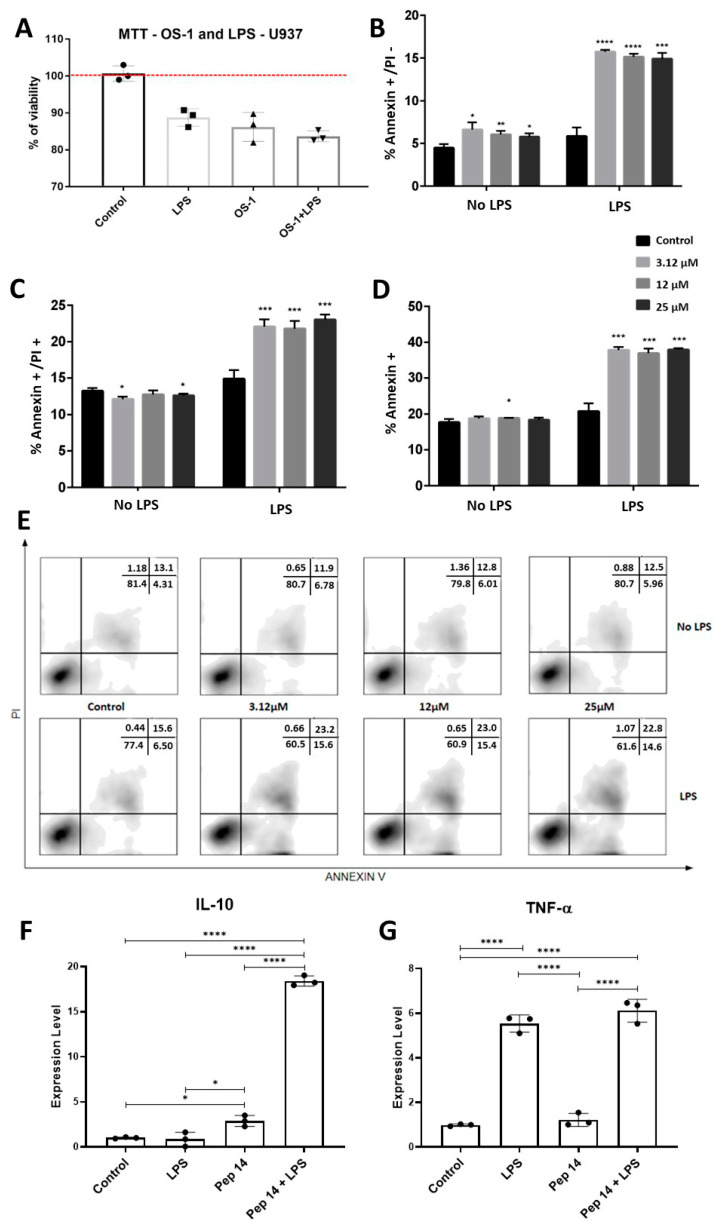
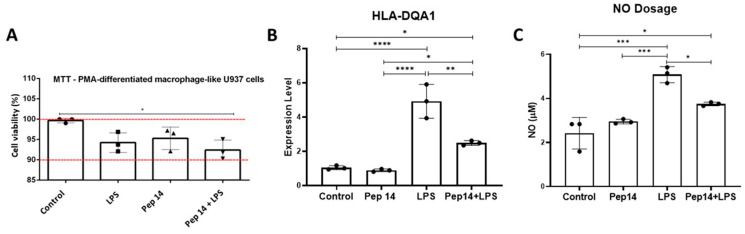
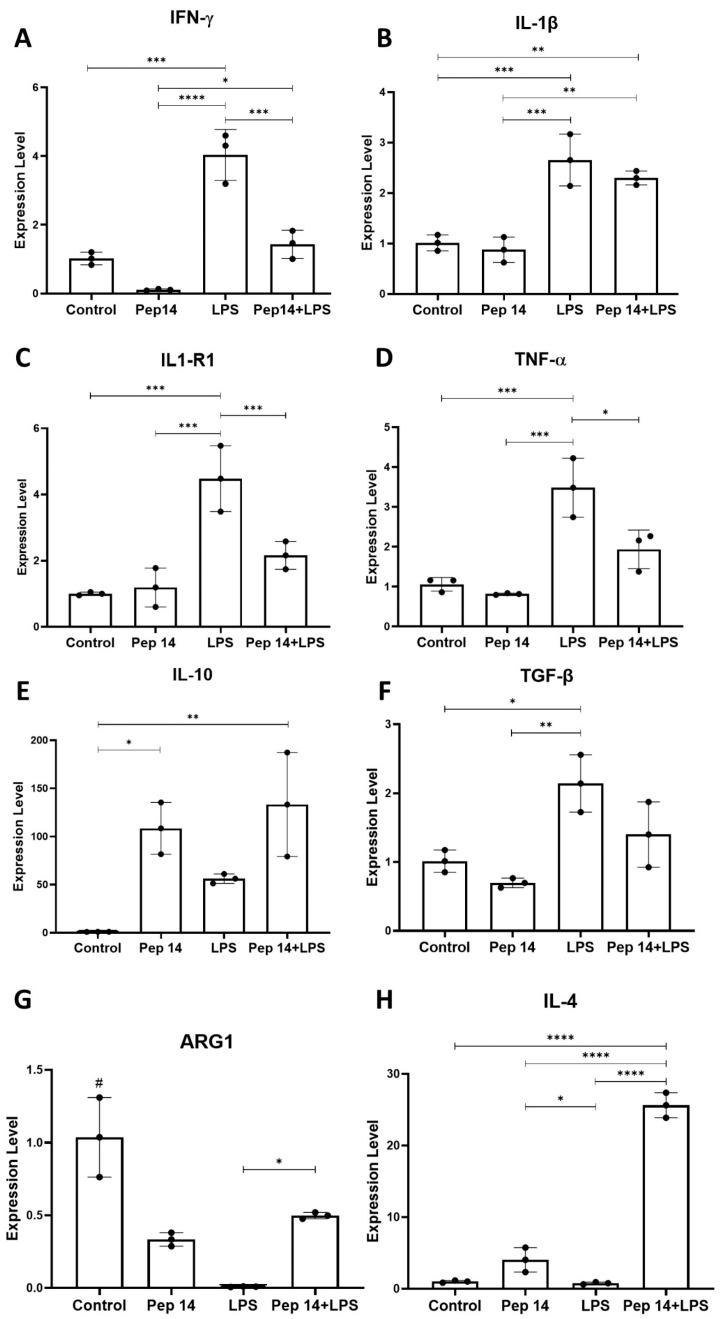
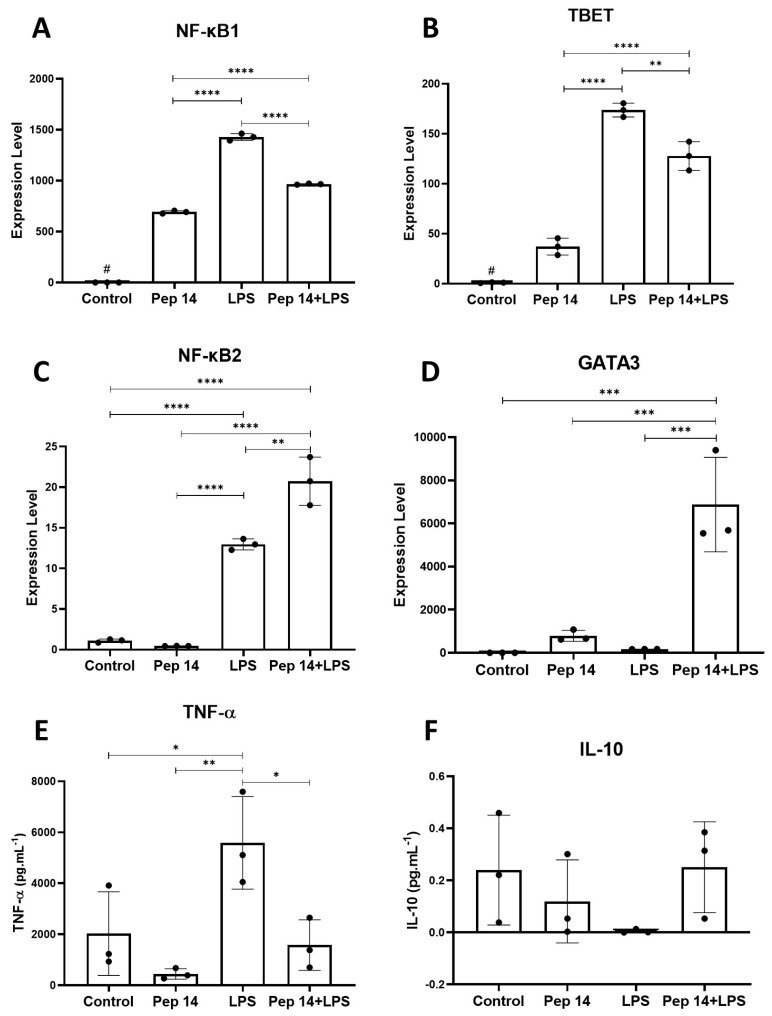
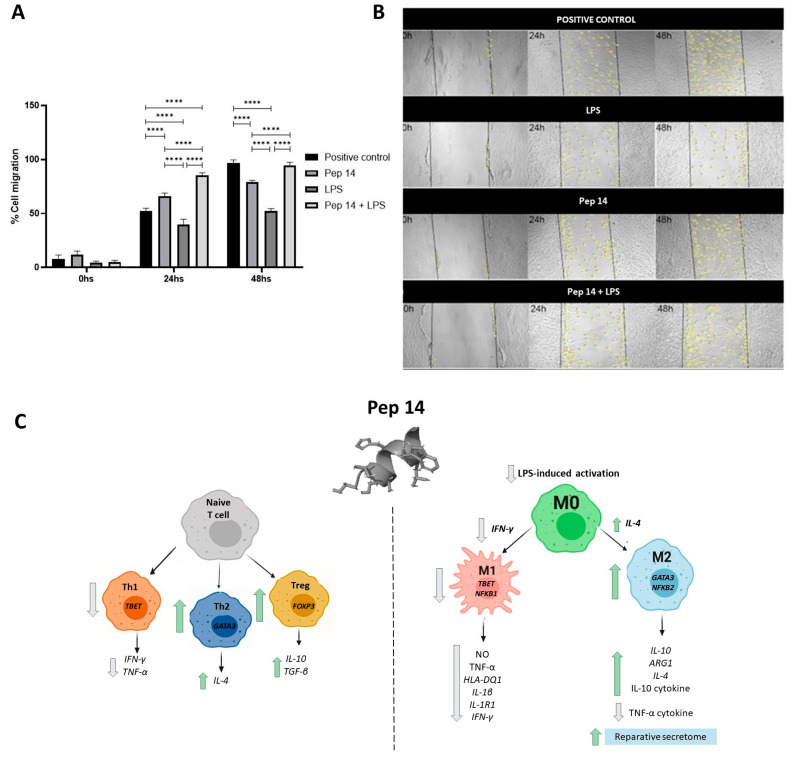
Inflammation contributes to the onset and exacerbation of numerous age-related diseases, often manifesting as a chronic condition during aging. Given that cellular senescence fosters local and systemic inflammation, senotherapeutic interventions could potentially aid in managing or even reducing inflammation. Here, we investigated the immunomodulatory effects of the senotherapeutic Peptide 14 (Pep 14) in human peripheral blood mononuclear cells (PBMCs), monocytes, and macrophages. We found that, despite failing to significantly influence T cell activation and proliferation, the peptide promoted a Th2/Treg gene expression and cytokine signature in PBMCs, characterized by increased expression of the transcription factors GATA3 and FOXP3, as well as the cytokines IL-4 and IL-10. These observations were partially confirmed through ELISA, in which we observed increased IL-10 release by resting and PHA-stimulated PBMCs. In monocytes from the U-937 cell line, Pep 14 induced apoptosis in lipopolysaccharide (LPS)-stimulated cells and upregulated IL-10 expression. Furthermore, Pep 14 prevented LPS-induced activation and promoted an M2-like polarization in U-937-derived macrophages, evidenced by decreased expression of M1 markers and increased expression of M2 markers. We also showed that the conditioned media from Pep 14-treated macrophages enhanced fibroblast migration, indicative of a functional M2 phenotype. Taken together, our findings suggest that Pep 14 modulates immune cell function towards an anti-inflammatory and regenerative phenotype, highlighting its potential as a therapeutic intervention to alleviate immunosenescence-associated dysregulation.

Keywords: aging; immunomodulation; inflammaging; multifunctional peptides.


Conflict of interest statement

Authors A.Z., M.B., and J.L.C. are collaborators and/or scientific advisors for OneSkin Technologies. All other authors declare that they have no conflicting interests.

Figures

Figure 1
Figure 1
Viability and proliferation of PBMCs treated with Pep 14. (A) The cellular viability of PBMCs treated with various concentrations of Pep 14 was determined using the MTT assay. Data are presented as a percentage of positive viability control (non-treated PBMCs). (B) Proliferation of resting (no PHA) and activated (PHA-treated) T cells obtained from 4 donors (1–4) and treated with 3.12 μM Pep 14 or (100 nM) rapamycin. Cells were stained with CFSE and treated with PHA and/or Pep 14 for 120 h. Data are presented as a percentage of proliferating T cells relative to total cells. (C) Activation of resting and activated T cells treated with 3.12 μM Pep 14. Cells were treated with PHA and/or Pep 14 for 24 h and then labeled with anti-CD3 and anti-CD69 antibodies. Data are presented as mean ± SD of the percentage of activated T cells relative to total cells. The experiments were performed using four biological samples numbered 1–4. Statistical tests were performed using analysis of variance, followed by post hoc Tukey tests. ** p < 0.01 compared to the control group.
Figure 2
Figure 2
Comparative analysis of gene expression levels involved in T cell differentiation, including specific markers for Th1, Th2, and Treg effector lymphocytes. The samples were subjected to real-time PCR (qPCR) analysis to quantify the expression of (A) FOXP3, (B) GATA3, (C) TBET, (D) NF-κB1, (E) NF-κB2, (F) REL, (G) RELA, and (H) RELB. All data were normalized to the control group. Statistical analysis was performed using ANOVA, followed by Tukey’s post hoc test for multiple comparisons. * p < 0.05, ** p < 0.01, *** p < 0.001, **** p < 0.0001. # p < 0.05 between control and experimental groups.
Figure 3
Figure 3
Comparative analysis of gene expression levels involved in T cell differentiation, including specific markers for Th1, Th2, and Treg effector lymphocytes. The expression levels of transcripts associated with Th1, Th2, and Treg effector lymphocytes were evaluated: (A) TGF-β, (B) IL-10, (C) IL-4, (D) IFN-γ, and (E) TNF-α. To validate the results obtained by qPCR, the expression levels of (F) IL-10 and (G) TNF-α proteins were quantified by enzyme-linked immunosorbent assay (ELISA). All data were normalized to the control group. Statistical analysis was performed using ANOVA, followed by Tukey’s post hoc test for multiple comparisons. * p < 0.05, ** p < 0.01, *** p < 0.001, **** p < 0.0001 between groups.
Figure 4
Figure 4
Evaluation of the toxicity of Peptide 14 (Pep 14) and its influence on cytokine production in U-937 cells. To elucidate the effects of Pep 14 on U-937 monocytes, we investigated its toxicity in resting and lipopolysaccharide (LPS)-stimulated cells using the MTT assay (A). Then, we determined whether our observations were attributable to an increase in cell death or a limitation in cell proliferation by employing annexin and propidium iodide (PI) analysis by flow cytometry. (B) Percentage of annexin V+/PI− cells. (C) Percentage of annexin V+/PI+ cells. (D) Percentage of total annexin V+ cells. (E) Representative dot plots of annexin V/PI staining. After cell viability was evaluated, we investigated the mRNA levels of IL-10 and TNF-α cytokines (F,G) produced by the treated monocytes using qRT-PCR. Statistical analysis was performed using ANOVA, followed by Tukey’s post hoc test for multiple comparisons. * p < 0.05, ** p < 0.01, *** p < 0.001, **** p < 0.0001 between groups.
Figure 5
Figure 5
Effects of peptides on U-937 macrophages. The cytotoxicity of Pep 14 and lipopolysaccharide (LPS) was determined using the MTT assay (A). Macrophage activation after treatment with Pep 14 and LPS was investigated by analyzing HLA-DQA1 mRNA expression (B) and nitric oxide (NO) production (C). Statistical analysis was performed using ANOVA, followed by Tukey’s post hoc test for multiple comparisons. * p < 0.05, ** p < 0.01, *** p < 0.001, **** p < 0.0001 between groups.
Figure 6
Figure 6
Effects of Pep 14 on macrophage polarization. We evaluated the mRNA expression of the M1 macrophage marker genes IFN-γ (A), IL-1β (B), IL-1R1 (C), and TNF-α (D) in U-937 macrophages. We also determined the mRNA expression levels of the M2 macrophage marker genes IL-10 (E), TGF-β (F), ARG1 (G), and IL-4 (H). Statistical analysis was performed using ANOVA, followed by Tukey’s post hoc test for multiple comparisons. * p < 0.05, ** p < 0.01, *** p < 0.001, **** p < 0.0001 between groups. # p < 0.05 between control and experimental groups.
Figure 7
Figure 7
Effects of Pep 14 on macrophage polarization. For a more comprehensive understanding of macrophage differentiation, the NF-κB1 (A), TBET (B), NF-κB2 (C), and GATA3 (D) gene transcripts were investigated. Next, to validate the data obtained by qRT-PCR, the concentrations of the pro- and anti-inflammatory cytokines TNF-α (E) and IL-10 (F) in the supernatant of U-937 macrophages were quantified by ELISA. Statistical analysis was performed using ANOVA, followed by Tukey’s post hoc test for multiple comparisons. * p < 0.05, ** p < 0.01, *** p < 0.001, **** p < 0.0001 between groups. # p < 0.05 between control and experimental groups.
Figure 8
Figure 8
Cell migration assay of fibroblasts treated with macrophage-conditioned medium. (A) Analysis of cell migration expressed as a percentage of the control. Statistical analysis was performed using ANOVA, followed by Tukey’s post hoc test for multiple comparisons. **** p < 0.0001. (B) Representative images of the migration assay. (C) Pep 14 exerts direct effects on immune cells, supporting Th2 and Treg subsets in T cells and limiting LPS-driven activation of macrophages, favoring an M2 phenotype. In both PBMCs and macrophages, Pep 14 consistently promoted IL-10 mRNA expression and cytokine release.

Similar articles

References

    1. Rodrigues L.P., Teixeira V.R., Alencar-Silva T., Simonassi-Paiva B., Pereira R.W., Pogue R., Carvalho J.L. Hallmarks of aging and immunosenescence: Connecting the dots. Cytokine Growth Factor Rev. 2021;59:9–21. doi: 10.1016/j.cytogfr.2021.01.006. - DOI - PubMed
    1. Pawelec G. Hallmarks of human “immunosenescence”: Adaptation or dysregulation? Immun. Ageing. 2012;9:15. doi: 10.1186/1742-4933-9-15. - DOI - PMC - PubMed
    1. Guimarães G.R., Almeida P.P., de Oliveira Santos L., Rodrigues L.P., de Carvalho J.L., Boroni M. Hallmarks of Aging in Macrophages: Consequences to Skin Inflammaging. Cells. 2021;10:1323. doi: 10.3390/cells10061323. - DOI - PMC - PubMed
    1. Wikby A., Nilsson B.-O., Forsey R., Thompson J., Strindhall J., Löfgren S., Ernerudh J., Pawelec G., Ferguson F., Johansson B. The immune risk phenotype is associated with IL-6 in the terminal decline stage: Findings from the Swedish NONA immune longitudinal study of very late life functioning. Mech. Ageing Dev. 2006;127:695–704. doi: 10.1016/j.mad.2006.04.003. - DOI - PubMed
    1. Schmitt V., Rink L., Uciechowski P. The Th17/Treg balance is disturbed during aging. Exp. Gerontol. 2013;48:1379–1386. doi: 10.1016/j.exger.2013.09.003. - DOI - PubMed

Publication types

LinkOut - more resources