

Glioblastoma Phagocytic Cell Death: Balancing the Opportunities for Therapeutic Manipulation
- PMID: 38786045
- PMCID: PMC11119757
- DOI: 10.3390/cells13100823
Glioblastoma Phagocytic Cell Death: Balancing the Opportunities for Therapeutic Manipulation
Abstract
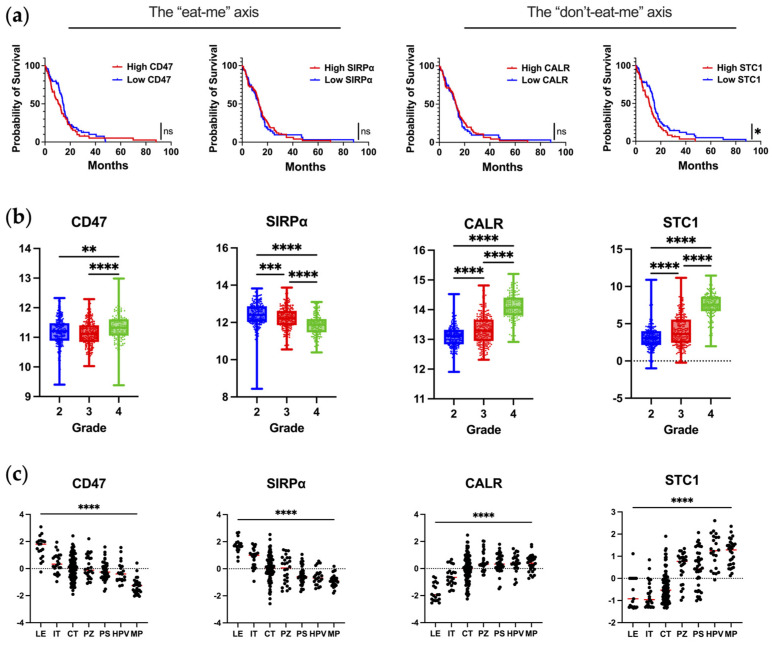
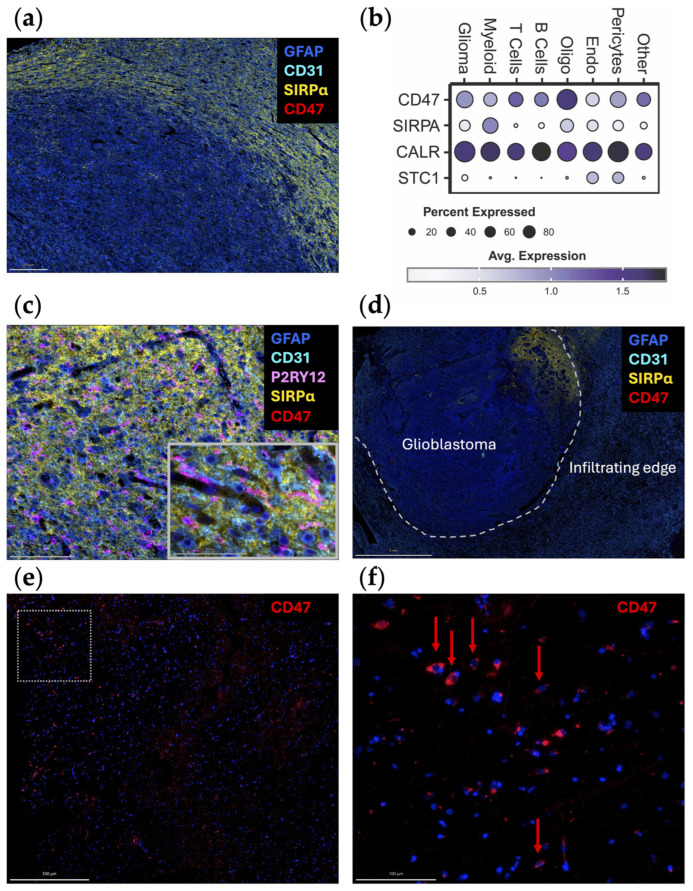
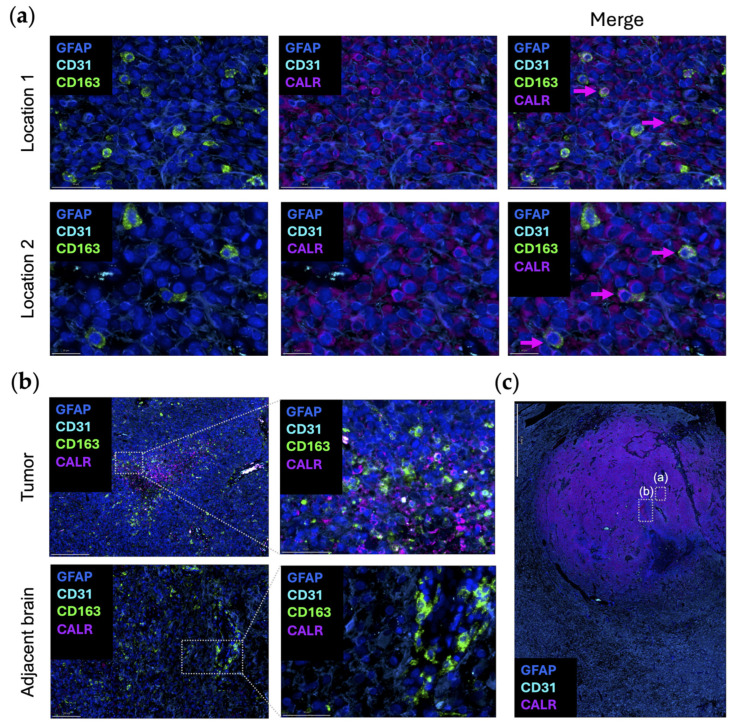
Macrophages and microglia are professional phagocytes that sense and migrate toward "eat-me" signals. The role of phagocytic cells is to maintain homeostasis by engulfing senescent or apoptotic cells, debris, and abnormally aggregated macromolecules. Usually, dying cells send out "find-me" signals, facilitating the recruitment of phagocytes. Healthy cells can also promote or inhibit the phagocytosis phenomenon of macrophages and microglia by tuning the balance between "eat-me" and "don't-eat-me" signals at different stages in their lifespan, while the "don't-eat-me" signals are often hijacked by tumor cells as a mechanism of immune evasion. Using a combination of bioinformatic analysis and spatial profiling, we delineate the balance of the "don't-eat-me" CD47/SIRPα and "eat-me" CALR/STC1 ligand-receptor interactions to guide therapeutic strategies that are being developed for glioblastoma sequestered in the central nervous system (CNS).
Keywords: gliomas; immune checkpoint blockade; myeloid cells.
Conflict of interest statement
A.B.H. serves on the advisory board of Caris Life Sciences and the WCG Oncology Advisory Board; receives royalty and milestone payments from DNAtrix for the licensing of the patent “Biomarkers and combination therapies using oncolytic virus and immunomodulation” (no. 11,065,285); is supported by research grants from Alnylam and AbbVie; and receives consulting fees from Novocure and Istari Oncology. She additionally has the granted patents titled “miRNA for treating cancer and for use with adoptive immunotherapies” (no. 9,675,633) and “Concurrent chemotherapy and immunotherapy” (no. 9,399,662), with patent pending, “Low-intensity ultrasound combination cancer therapies” (International Applications PCT/US2022/019435 and US 63/158,642). R.V.L. serves on the advisory boards for AstraZeneca, Bayer, Cardinal Health, Merck, Novartis, Novocure, and Servier; serves at speakers’ bureau for Merck and Novocure; receives research support (drug only) from BMS; and receives honoraria for editing from EBSCO, Elsevier, Medlink Neurology, and Oxford University Press.
Figures
Similar articles
-
Understanding the regulation of "Don't Eat-Me" signals by inflammatory signaling pathways in the tumor microenvironment for more effective therapy.J Cancer Res Clin Oncol. 2023 Jan;149(1):511-529. doi: 10.1007/s00432-022-04452-w. Epub 2022 Nov 7. J Cancer Res Clin Oncol. 2023. PMID: 36342520 Free PMC article. Review.
-
Chitinase 3-like-1 Inhibits Innate Antitumor and Tissue Remodeling Immune Responses by Regulating CD47-SIRPα- and CD24-Siglec10-Mediated Phagocytosis.J Immunol. 2024 Nov 1;213(9):1279-1291. doi: 10.4049/jimmunol.2400035. J Immunol. 2024. PMID: 39291933
-
Functional Differences Between SIRPα Splice Isoforms.Genes Cells. 2025 Sep;30(5):e70041. doi: 10.1111/gtc.70041. Genes Cells. 2025. PMID: 40763927 Free PMC article.
-
Novel immunotherapy for gastric cancer: targeting the CD47-SIRPα axis.Cancer Metastasis Rev. 2025 May 29;44(2):52. doi: 10.1007/s10555-025-10269-z. Cancer Metastasis Rev. 2025. PMID: 40437298 Review.
-
Enhancing macrophage phagocytosis of cancers by disrupting the SIRPα/CD47 signaling axis and targeting MUC1 antigen.FEBS J. 2025 Jul 14. doi: 10.1111/febs.70192. Online ahead of print. FEBS J. 2025. PMID: 40660085
Cited by
-
Phagocytosis Checkpoints in Glioblastoma: CD47 and Beyond.Curr Issues Mol Biol. 2024 Jul 23;46(8):7795-7811. doi: 10.3390/cimb46080462. Curr Issues Mol Biol. 2024. PMID: 39194679 Free PMC article. Review.
-
Is modulation of immune checkpoints on glioblastoma-infiltrating myeloid cells a viable therapeutic strategy?Neuro Oncol. 2025 Jan 12;27(1):33-49. doi: 10.1093/neuonc/noae193. Neuro Oncol. 2025. PMID: 39427326 Review.
-
Immunotherapy in Glioblastoma.Cancer Treat Res. 2025;129:103-118. doi: 10.1007/978-3-031-97242-3_6. Cancer Treat Res. 2025. PMID: 40847231 Review.
-
Mesenchymal stem cells derived exosomes: a new era in cardiac regeneration.Stem Cell Res Ther. 2025 Jan 23;16(1):16. doi: 10.1186/s13287-024-04123-2. Stem Cell Res Ther. 2025. PMID: 39849585 Free PMC article. Review.
References
-
- Louis D.N., Perry A., Wesseling P., Brat D.J., Cree I.A., Figarella-Branger D., Hawkins C., Ng H.K., Pfister S.M., Reifenberger G., et al. The 2021 WHO Classification of Tumors of the Central Nervous System: A summary. Neuro Oncol. 2021;23:1231–1251. doi: 10.1093/neuonc/noab106. - DOI - PMC - PubMed
-
- Hamid O., Robert C., Daud A., Hodi F.S., Hwu W.J., Kefford R., Wolchok J.D., Hersey P., Joseph R., Weber J.S., et al. Five-year survival outcomes for patients with advanced melanoma treated with pembrolizumab in KEYNOTE-001. Ann. Oncol. 2019;30:582–588. doi: 10.1093/annonc/mdz011. - DOI - PMC - PubMed
Publication types
MeSH terms
Substances
Grants and funding
LinkOut - more resources
Full Text Sources
Research Materials
Miscellaneous
