. 2024 May 15;13(10):841.
doi: 10.3390/cells13100841.

In Vitro Investigation of Therapy-Induced Senescence and Senescence Escape in Breast Cancer Cells Using Novel Flow Cytometry-Based Methods

Affiliations

In Vitro Investigation of Therapy-Induced Senescence and Senescence Escape in Breast Cancer Cells Using Novel Flow Cytometry-Based Methods

Fanni Tóth et al. Cells. .

Abstract

Although cellular senescence was originally defined as an irreversible form of cell cycle arrest, in therapy-induced senescence models, the emergence of proliferative senescence-escaped cancer cells has been reported by several groups, challenging the definition of senescence. Indeed, senescence-escaped cancer cells may contribute to resistance to cancer treatment. Here, to study senescence escape and isolate senescence-escaped cells, we developed novel flow cytometry-based methods using the proliferation marker Ki-67 and CellTrace CFSE live-staining. We investigated the role of a novel senescence marker (DPP4/CD26) and a senolytic drug (azithromycin) on the senescence-escaping ability of MCF-7 and MDA-MB-231 breast cancer cells. Our results show that the expression of DPP4/CD26 is significantly increased in both senescent MCF-7 and MDA-MB-231 cells. While not essential for senescence induction, DPP4/CD26 contributed to promoting senescence escape in MCF-7 cells but not in MDA-MB-231 cells. Our results also confirmed the potential senolytic effect of azithromycin in senescent cancer cells. Importantly, the combination of azithromycin and a DPP4 inhibitor (sitagliptin) demonstrated a synergistic effect in senescent MCF-7 cells and reduced the number of senescence-escaped cells. Although further research is needed, our results and novel methods could contribute to the investigation of the mechanisms of senescence escape and the identification of potential therapeutic targets. Indeed, DPP4/CD26 could be a promising marker and a novel target to potentially decrease senescence escape in cancer.

Keywords: breast cancer; flow cytometry; senescence escape; therapy-induced senescence.


Conflict of interest statement

MPL and FS hold a minority interest in Lunella Biotech, Inc.

Figures

Figure 1
Figure 1
Senescence induction in MCF-7 and MDA-MB-231 cells using bromodeoxyuridine (BrdU), gemcitabine (GEM) and palbociclib (PALBO). (A) Representative images of control and senescent MCF-7 and MDA-MB-231 cells. Cells were fixed and stained with X-gal and imaged using EVOS at 20× magnification; scale bars indicate 100 µm. The blue colour indicates SA-β-galactosidase activity. (B) Cell proliferation of control and senescent MCF-7 and MDA-MB-231 cells was measured using SRB assay at different time points; the values were normalised to the baseline values measured 24 h after cell seeding and represented as fold change. Graph represents the mean values of two independent experiments ± SEM. (C) The secretion of IL-6 and IL-8 was measured using the ELISA assay. The cells were seeded in 6-well plates and cultured for 4 days before collecting the culture medium containing the secreted cytokines. The graphs represent the amount of IL-6 and IL-8 quantified by known concentrations of standards and normalised by cell numbers. (D) The expression of γH2AX is represented as the percentage of positively stained cells compared to the total population. The gates for γH2AX-positive cells were adjusted by using unstained cells. Bar graphs represent the mean of three independent experiments ± SEM. Statistical significance (in relation to control): ns p > 0.05; * p ≤ 0.05; *** p ≤ 0.001; **** p ≤ 0.0001.
Figure 2
Figure 2
Cell cycle analysis of BrdU- GEM- and PALBO-induced senescent MCF7 and MDA-MB-231 cells using Ki-67 and PI staining. (A) Representative figures of control MCF-7 cells showing the gating strategy used to analyse cell cycle. Cells were manually categorised to cell cycle stages based on their DNA content detected using PI staining, and the gates for Ki-67-positive cells were adjusted by using AB ctrl cells (stained only with secondary antibodies). (B) Representative figure of the cell cycle analysis of control, BrdU-, GEM- and PALBO-induced senescent MCF-7 cells using Ki-67 and PI staining. (C) The bottom graph represents the distribution of cell cycle categories in control, BrdU-, GEM- and PALBO-induced senescent MCF-7 and MDA-MB-231 cells based on the mean values of three independent experiments. * The category of G2-arrested cells was based on the research of Miller et al. (2018) [58].
Figure 3
Figure 3
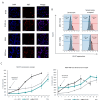
Actively proliferating senescence-escaped cells can be detected using Ki-67 staining. (A) Representative images demonstrating the increase in Ki-67 expression in BrdU- and GEM-induced senescence-escaped MCF-7 cells compared to the senescent cells. The cells were stained via immunostaining and imaged using EVOS at 20× magnification; scale bars indicate 100 µm. (B) Representative figures evaluating senescence escape in BrdU- and GEM-induced senescent MCF-7 cells based on Ki-67 expression measured using flow cytometry. The cells were categorised as Ki-67-negative (blue) and Ki-67-positive (red) populations. (C) Graphs show the evaluation of senescence escape in BrdU-, GEM- and PALBO-induced senescent MCF-7 and MDA-MB-231 cells based on Ki-67 expression measured using flow cytometry at different time points. Arrows indicate the removal of treatment, representing day 0. The graphs represent the mean values of three independent experiments ± SEM.
Figure 4
Figure 4
DPP4 expression is increased in BrdU-, GEM- and PALBO-induced senescent MCF-7 and MDA-MB-231 cells, but the silencing of DPP4 did not affect senescence induction. (A) The expression of DPP4/CD26 was measured using flow cytometry, represented as mean fluorescence intensity (MFI) of CD26-PE staining. The values were normalised to the MFI of non-senescent (control) MCF-7 and MDA-MB-231 cells. (B) The expression of DPP4 was silenced in both cell lines via lentiviral vector-mediated gene silencing, and the cells were labelled as DPP4 siRNA. Cells transduced with scrambled vector were used as experimental controls, labelled ctrl siRNA. DPP4 expression is represented as mean fluorescence intensity (MFI) of CD26-PE staining measured using flow cytometry, and the values were normalised to the MFI of non-senescent ctrl siRNA cells and represented as fold change. Bar graphs represent the mean values of three independent experiments ± SEM. Statistical significance: * p ≤ 0.05; ** p ≤ 0.01; *** p ≤ 0.001; **** p ≤ 0.0001. (C) Representative images of BrdU-, GEM- and PALBO-induced senescent ctrl siRNA and DPP4 siRNA cells. The cells were fixed and stained with X-gal and imaged using EVOS with 20× magnification; scale bars indicate 100 µm. The blue colour indicates SA-β-galactosidase activity.
Figure 5
Figure 5
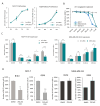
Effect of DPP4 silencing/inhibition on the senescence-escaping ability of MCF-7 and MDA-MB-231 cells. (A) Cell proliferation was measured using the SRB assay at different time points, and the values were normalised to the baseline values measured 24 h after cell seeding and represented as fold change. Graph represents the mean of three independent experiments ± SEM. (B) The cell viability of MCF-10A, MCF-7 and MDA-MB-231 cells was measured using the SRB assay after 72 h treatment of sitagliptin. Experiments were repeated three times with six technical replicates; error bars represent ± SEM. (C) Evaluation of senescence escape in ctrl siRNA and DPP4 siRNA cells based on Ki-67 expression measured via flow cytometry. (D) After senescence induction via BrdU and GEM treatments, MCF-7 and MDA-MB-231 cells were incubated for 10 days with sitagliptin treatment. The senescence-escaping abilities of the cells were assessed by the combination of Ki-67 expression and cell concentration represented as the number of Ki-67-positive cells. Values were normalised to DMSO-treated cells. Bar graphs represent the mean values of three independent experiments ± SEM. Statistical significance: ns p > 0.05; * p ≤ 0.05; ** p ≤ 0.01; *** p ≤ 0.001.
Figure 6
Figure 6
Azithromycin disrupts autophagy and has senolytic activity in senescent MCF-7 and MDA-MB-231 cells. (A) The cell viability of control, BrdU-, GEM- and PALBO-induced senescent MCF-7 and MDA-MB-231 cells was measured using the SRB assay after 72 h azithromycin treatment. Experiments were repeated three times with six technical replicates; error bars represent ± SEM. Statistical significance (in relation to control): * p ≤ 0.05; ** p ≤ 0.01; *** p ≤ 0.001; **** p ≤ 0.0001. (B) Representative images of LC3B and p62/SQSTM1 immunostaining of control, BrdU-, GEM- and PALBO-induced senescent MCF-7 cells after 48 h of 100 µM azithromycin and 50 µM chloroquine treatment. By using the same imaging settings for each condition, in untreated MCF-7 cells (DMSO), the signal intensity was below the detection threshold. The cells were imaged using EVOS at 20× magnification; scale bars indicate 100 µm.
Figure 7
Figure 7
Senescence escape in azithromycin-treated senescent MCF-7 cells can be decreased via DPP4 inhibition (sitagliptin treatment). (A) The cell numbers of control, BrdU-, GEM- and PALBO-induced senescent MCF-7 and MDA-MB-231 cells were measured using the SRB assay after 3 days and 5 days of treatment with 100 µM azithromycin. Experiments were repeated three times with six technical replicates. (B) Control and senescent MCF-7 cells were treated with DMSO or 100 µM AZI for 72 h. Afterwards, the control cells were incubated 3 days without AZI, and senescent cells were incubated 10 days without AZI. The senescence-escaping ability of the cells was assessed via Ki-67 staining. Due to the reduced number of senescent cells after AZI treatment, the relative expression of Ki-67 has been used, referred to as Ki-67-positive cells (%). (C) Schematic figure representing the workflow of combination treatment using azithromycin and sitagliptin (D) The senescence-escaping abilities of the cells were assessed in terms of Ki-67 expression and cell concentration represented as the number of Ki-67-positive cells. Bar graphs represent the mean of three independent experiments ± SEM. Statistical significance (in relation to control): ns p > 0.05; * p ≤ 0.05; ** p ≤ 0.01; *** p ≤ 0.001; **** p ≤ 0.0001.
Figure 8
Figure 8
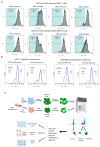
Senescence-escaped MCF-7 and MDA-MB-231 cells could be isolated using CFSE staining based on the loss of fluorescent signal due to cell proliferation. (A) Representative figures of the gating strategies for the isolation of senescence-escaped cells via flow cytometry using CFSE staining. The gates were adjusted manually to the basis of the histogram generated by the CFSE signal of BrdU- and GEM-induced senescent cells and cells with low expression of CFSE (CFSE low) were considered senescence-escaped cells. Figures were generated using FlowJo. (B) Representative figures of the results of population comparisons via FlowJo. The senescent cells were co-stained with CFSE and Ki-67, and the population of cells with low CFSE staining (CFSE low) were compared with the population of Ki-67-expressing cells (Ki-67 pos). The percentages represented next to the graphs indicate the correlation of the two populations. (C) The figure represents the workflow for the isolation of senescence-escaped cells by FACS. The figure was generated using BioRender.
Figure 9
Figure 9
Investigating the effect of senescence escape in cancer progression using functional assays—stem cell activity, migration capacity and proliferative capacity. (A) The graphs represent the mammosphere formation efficiency (MFE) of control, senescent and senescence-escaped cells after cell sorting, normalised to the MFE of the control MCF-7 and MDA-MB-231 cells. (B) Cell migration was assessed using a transwell assay. Representative images of the migration are shown in Supplementary Figure S7A. The cells were stained with crystal violet and imaged using EVOS. To evaluate cell migration, the number of cells was counted with ImageJ using 4 images from each sample. (C) Proliferative capacity was assessed using the colony formation assay. Representative images of colony formation are shown in Supplementary Figure S7B. Cells were stained with crystal violet, and the number of colonies with more than 50 cells were counted using ImageJ. Experiments were repeated with three technical replicates; bar graphs represent the mean of three independent experiments ± SEM. Statistical significance (in relation to control): ns p > 0.05; * p ≤ 0.05; ** p ≤ 0.01; *** p ≤ 0.001; **** p ≤ 0.0001.

Similar articles

Cited by

References

    1. Campisi J., d’Adda di Fagagna F. Cellular Senescence: When Bad Things Happen to Good Cells. Nat. Rev. Mol. Cell Biol. 2007;8:729–740. doi: 10.1038/nrm2233. - DOI - PubMed
    1. Campisi J. Aging, Cellular Senescence, and Cancer. Annu. Rev. Physiol. 2013;75:685–705. doi: 10.1146/annurev-physiol-030212-183653. - DOI - PMC - PubMed
    1. Calcinotto A., Kohli J., Zagato E., Pellegrini L., Demaria M., Alimonti A. Cellular Senescence: Aging, Cancer, and Injury. Physiol. Rev. 2019;99:1047–1078. doi: 10.1152/physrev.00020.2018. - DOI - PubMed
    1. Chambers C.R., Ritchie S., Pereira B.A., Timpson P. Overcoming the Senescence-Associated Secretory Phenotype (Sasp): A Complex Mechanism of Resistance in the Treatment of Cancer. Mol. Oncol. 2021;15:3242–3255. doi: 10.1002/1878-0261.13042. - DOI - PMC - PubMed
    1. Ewald J.A., Desotelle J.A., Wilding G., Jarrard D.F. Therapy-Induced Senescence in Cancer. J. Natl. Cancer Inst. 2010;102:1536–1546. doi: 10.1093/jnci/djq364. - DOI - PMC - PubMed

Publication types