. 2024 May 17;13(10):862.
doi: 10.3390/cells13100862.

Antibody-Drug Conjugate Made of Zoledronic Acid and the Anti-CD30 Brentuximab-Vedotin Exert Anti-Lymphoma and Immunostimulating Effects

Affiliations

Antibody-Drug Conjugate Made of Zoledronic Acid and the Anti-CD30 Brentuximab-Vedotin Exert Anti-Lymphoma and Immunostimulating Effects

Feliciana Morelli et al. Cells. .

Abstract

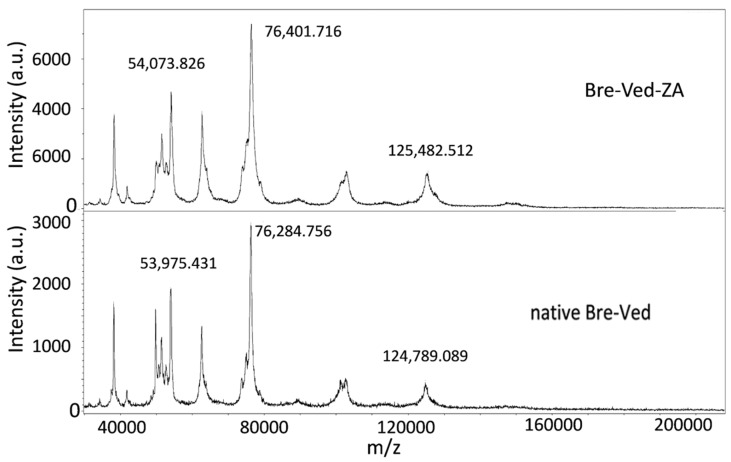
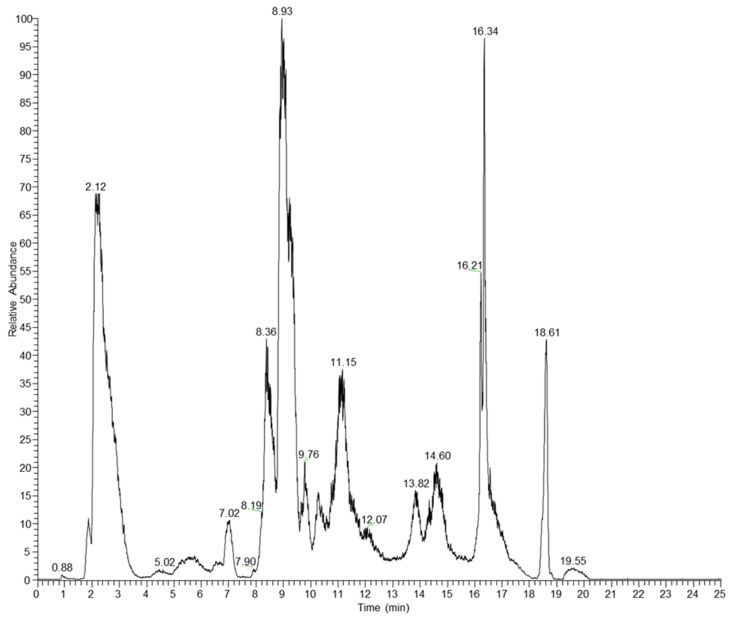
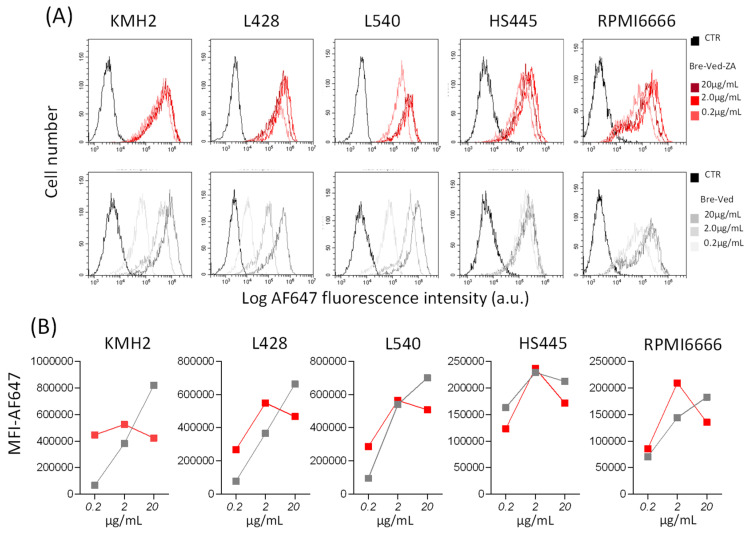
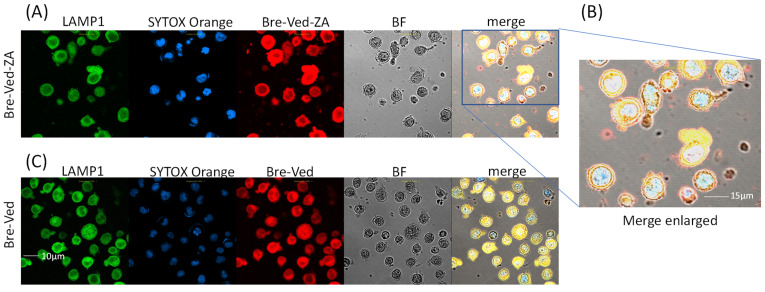
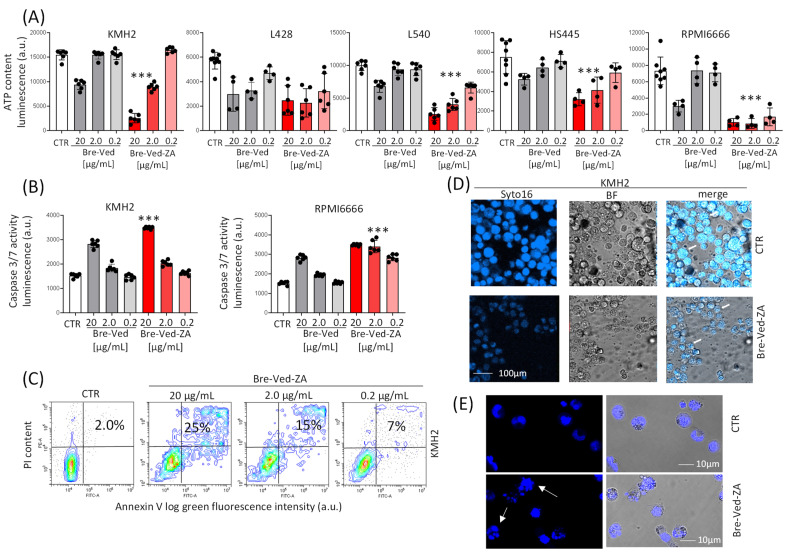
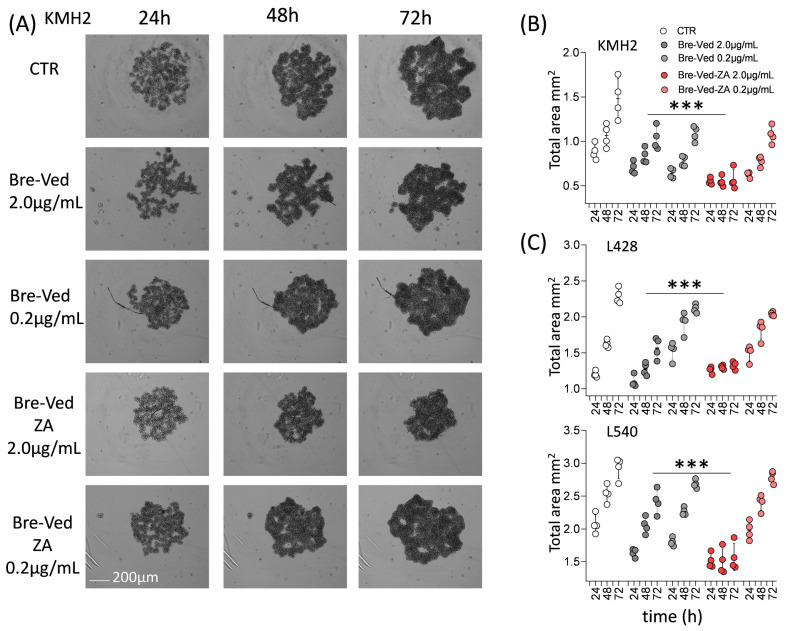
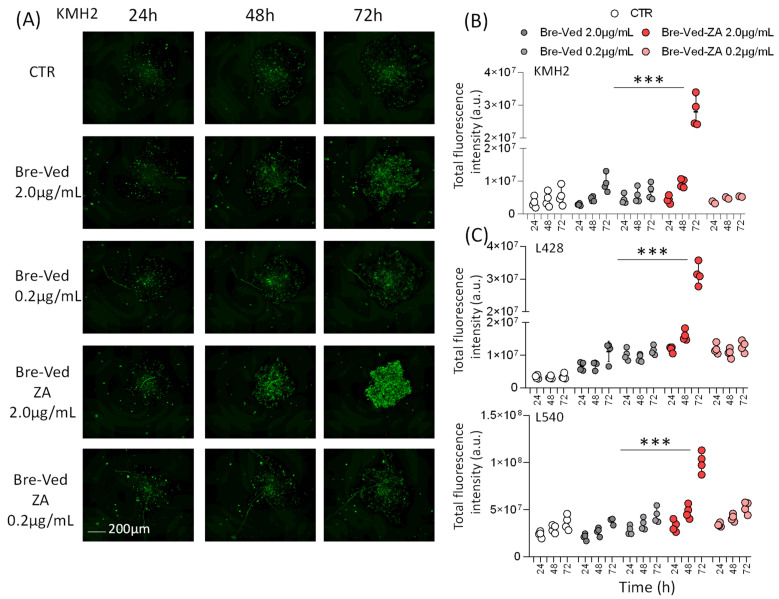
Relevant advances have been made in the management of relapsed/refractory (r/r) Hodgkin Lymphomas (HL) with the use of the anti-CD30 antibody-drug conjugate (ADC) brentuximab-vedotin (Bre-Ved). Unfortunately, most patients eventually progress despite the excellent response rates and tolerability. In this report, we describe an ADC composed of the aminobisphosphonate zoledronic acid (ZA) conjugated to Bre-Ved by binding the free amino groups of this antibody with the phosphoric group of ZA. Liquid chromatography-mass spectrometry, inductively coupled plasma-mass spectrometry, and matrix-assisted laser desorption ionization-mass spectrometry analyses confirmed the covalent linkage between the antibody and ZA. The novel ADC has been tested for its reactivity with the HL/CD30+ lymphoblastoid cell lines (KMH2, L428, L540, HS445, and RPMI6666), showing a better titration than native Bre-Ved. Once the HL-cells are entered, the ADC co-localizes with the lysosomal LAMP1 in the intracellular vesicles. Also, this ADC exerted a stronger anti-proliferative and pro-apoptotic (about one log fold) effect on HL-cell proliferation compared to the native antibody Bre-Ved. Eventually, Bre-Ved-ZA ADC, in contrast with the native antibody, can trigger the proliferation and activation of cytolytic activity of effector-memory Vδ2 T-lymphocytes against HL-cell lines. These findings may support the potential use of this ADC in the management of r/r HL.

Keywords: ADC; CD30; Hodgkin lymphoma(s); Vδ2 T-cells; brentuximab; zoledronic acid.


Conflict of interest statement

The authors declare no conflicts of interest.

Figures

Figure 1
Figure 1
MALDI–MS of Bre–Ved–ZA and Bre–Ved. The plots represent the different molecular weights of the two ADCs. Upper panel: Bre–Ved conjugated with zoledronate; lower panel: native Bre–Ved. The different MWs of the corresponding peaks of the two ADCs indicate the presence of different new molecular species in the preparation of Bre–Ved–ZA due to the covalently linked ZA to the native ADC. The MW of one of these peaks is highlighted to show better the difference between Bre–Ved–ZA and the native Bre–Ved ADC.
Figure 2
Figure 2
Totally reduced Bre–Ved–ZA LiqC–MS Chromatogram (TIC).
Figure 3
Figure 3
Bre–Ved–ZA ADC reactivity. (A) Bre–Ved–ZA titration. Upper panels: the HL-cell lines KMH2, L428, L540, HS445, and RPMI6666 were incubated with 20–0.2 µg/mL/106 cells of Bre–Ved–ZA ADC (upper histograms, red lines) or Bre–Ved (lower histograms, gray lines), followed by the AlexaFluor647-labeled α-hIg antiserum and FACS analysis. Results expressed as Log far red fluorescence intensity (a.u.) vs. the number of cells. (B) HL/CD30+ lymphoblastoid cell lines were incubated with 20–2.0–0.2 µg/mL/106 cells of Bre–Ved–ZA ADC (red) or Bre–Ved (gray) as in (B). Results expressed as mean fluorescence intensity (MFI-AF647, a.u.).
Figure 4
Figure 4
Colocalization of Bre–Ved–ZA and LAMP1 lysosomal marker. The KMH2 cell line was stained with Bre–Ved–ZA ADC (AlexaFluor647, red) (A), enlarged in (B), or Bre–Ved (C) both at 2.0 µg/mL, as indicated, followed by anti-LAMP1 mAb (2.0 µg/mL, AlexaFluor488, green) and SytoX Orange (200 nM, blue) as described in the Methods and Materials section. Samples observed by confocal Laser Scanning Microscopy (400× magnification). To avoid cross-contribution of the various fluorochromes, images have been acquired using the appropriate laser-excitation wavelength with each detector opened at a time. The FluoView 4.3b computer software was used for analysis. Results shown in pseudocolors and merged images are depicted in each panel. Blue: nuclei in pseudocolor. Bar: 10 µm (A,C), 15 µm (B). Results are representative of three independent experiments from three replicated wells.
Figure 5
Figure 5
HL-cell-line proliferation and apoptosis upon Bre–Ved–ZA or Bre–Ved treatment. (A) ATP content, determined using the CellTiter-Glo® Luminescent Cell Viability Kit, in KMH2, L428, L540, HS445, or RPMI6666 exposed to serial dilution of Bre–Ved or Bre–Ved–ZA (20, 2.0, 0.2 μg/mL) and incubated at 37 °C for 5 days. Luminescence was detected with the VICTORX5 reader and expressed as luminescence arbitrary units (a.u). (B) Caspase activation in KMH2 and RPMI6666 cell lines evaluated at 72 h with the luciferase-based Caspase Glo 3/7 3D Assay, expressed as luminescence units (RLU)/5 × 104 cells. Results are the mean ± SD of three independent experiments from 4 replicated wells. *** p < 0.001 of Bre–Ved–Za vs. Bre–Ved. (C) KMH2 cultured for 72 h with 20 or 2.0 or 0.2 μg/mL Bre–Ved–ZA were labeled with FITC-annexin-V (AV) and propidium iodide (PI) and subjected to FACS analysis. CTR: staining in untreated cells. Apoptotic cells are identified as AV+PI+. (D) Confocal microscopy of KMH2 cells treated for 72 h with 2 μg/mL Bre–Ved–ZA upon nuclear staining with Syto16 (left images). Central images: bright field; right images: merged dark and bright fields. Magnification: 20× objective. Bar: 10 µm. (E) Confocal microscopy as in (D) at higher magnification (40× objective). Bar: 10 µm. Results are representative of three independent experiments. CTR: KMH2 cultured in medium without antibody. The white arrows in (D,E) indicate the apoptotic nuclei.
Figure 6
Figure 6
Reduction of HL-cell growth in the presence of Bre–Ved–ZA compared to Bre–Ved. (A) Images of KMH2 cell cultures, without or with 2 µg/mL of Bre–Ved–ZA or Bre–Ved, taken at 24, 48, and 72 h with the CELLCYTE XTM imaging recorder are shown. Magnification 50×; one well/each time point is shown. Bar: 100 µm. (B) Cell area calculated by image analysis (CELLCYTE Studio software) on images of proliferating KMH2 cell cultures, without or with Bre–Ved–ZA or Bre–Ved (2.0 µg/mL or 0.2 µg/mL) taken at 24, 48, 72 h, expressed as mm2. (C) Cell area, calculated as in (A), of L428 or L540 clusters at 24, 48, and 72 h expressed in mm2. Results are the mean ± SD of three independent experiments from 4 replicated wells. *** p < 0.001 of Bre–Ved–ZA vs. Bre–Ved at 2.0 µg/mL).
Figure 7
Figure 7
HL-cell death induced by Bre–Ved–ZA ADC compared to Bre–Ved. (A) Images of KMH2 cells stained with C.LIVE Tox green fluorescent probe (20 nM) and cultured without or with 2 µg/mL or 0.2 µg/mL Bre–Ved–ZA or Bre–Ved, analyzed at 24, 48, and 72 h with the CELLCYTE XTM imaging recorder. Magnification 50×; one representative well/time point is shown. Bar: 100 µm. (B) Fluorescence intensity measured with the CELLCYTE Studio software on images of KMH2 cell cultures, without or with Bre–Ved–ZA or Bre–Ved (2 µg/mL or 0.2 µg/mL) taken at 24, 48, and 72 h, and expressed in arbitrary units (a.u.). (C) Fluorescence intensity measured as in A on L428 and L540 cell lines cultured with or without Bre–Ved–ZA or Bre–Ved for the indicated time points (a.u.). Results are the mean ± SD of three independent experiments from 4 replicated wells. *** p > 0.001 of Bre–Ved–ZA vs. Bre–Ved at 2.0 µg/mL.
Figure 8
Figure 8
Bre–Ved–ZA ADC induces Vδ2 T-cell proliferation. (A) Titration of Bre–Ved–ZA (20, 2.0, 0.2, 0.02 μg/mL) on long-term KMH2 proliferation, determined using the LUNA-IITM automated Cell counter. Cell proliferation in each experimental condition is plotted as a fold increase of the initial input at each time point (days 14 and 21). (B) Vδ2 T-cells evaluated by polychromatic immunofluorescence, using the anti-TCR Vδ2 and the anti-CD3 mAbs, at the indicated day (7, 14, and 21) of culture with 2.0 µg/mL Bre–Ved–ZA (upper plots) or Bre–Ved (lower plots). Results expressed as log far red fluorescence intensity vs. log red fluorescence intensity (arbitrary units, a.u.). (C) percentage of Vδ2 T-cells after 21 days of culture of purified T-lymphocytes plus Mo and KMH2, or L428 or L540 as indicated, without or with 2.0 µg/mL Bre–Ved or Bre–Ved–ZA or 1 µM ZA. Results are the mean ± SD from 5 lymphocyte donors. (D) images of cultures of T-lymphocytes alone (day 0) or with Mo (day 0) or KMH2 only (days 0 and 7) or T+Mo+KMH2 (105 T-cells: 104 KMH2 cells and 104 Mo), taken using the Cell Cyte X imaging recorder on day 7, 14 or 21 of culture incubated at the onset of the assay with 2.0 µg/mL Bre–Ved–ZA. (E) Cell samples stained with the FITC-anti-Vδ2, the PE-anti-CD45RA, and the APC-anti-CD27 mAb, analyzed by flow cytometry. Upper panels: staining with anti-Vδ2 mAb on T-cells at day 0 (left) and expression of CD45RA and CD27 on Vδ2-gated T-lymphocytes (right); Lower panels: cells stained with anti-isotype-specific mouse antiserum CTR-PE and CTR-647 (left) or expression of CD45RA and CD27 on ungated T-lymphocytes (right) at time 0. (F) Vδ2-gated T-cell population after 21 days of culture (left histograms) with Bre–Ved–ZA (upper panels) or Bre–Ved (lower panels) stained with anti-CD45RA and anti-CD27 mAb (right plots). (G) Cells obtained from cultures of T+Mo+KMH2 HL-cells incubated at the onset of culture with Bre–Ved–ZA (red squares) or Bre–Ved (gray triangles) antibodies or IL-2 alone (circles) tested in a cytotoxic assay against KMH2 ((G), left) or L428 HL ((G), right) target cells at the indicated E:T ratios and analyzed by flow cytometry upon identification of died target cells as CD2 negative and C.LIVE Tox green+ with Cytoflex software. Results are expressed as a percentage of C.LIVE Tox green+CD2- KMH2 (left) or L428 (right) target cells. A representative example of results obtained from three independent experiments with lymphocyte donors is shown. *** = p < 0.001.

Similar articles

Cited by

References

    1. Fridman W.H., Pages F., Sautes-Fridman C., Galon J. The immune contexture in human tumours: Impact on clinical outcome. Nat. Rev. Cancer. 2012;12:298–306. doi: 10.1038/nrc3245. - DOI - PubMed
    1. Church S.E., Galon J. Tumor Microenvironment and immunotherapy: The whole picture is better than a glimpse. Immunity. 2015;43:631–633. doi: 10.1016/j.immuni.2015.10.004. - DOI - PubMed
    1. Bonneville M., O’Brien R.L., Born W.K. γδ T cell effector functions: A blend of innate programming and acquired plasticity. Nat. Rev. Immunol. 2010;10:467–478. doi: 10.1038/nri2781. - DOI - PubMed
    1. Wang C.Q., Lim P.Y., Tan A.H. Gamma/delta T cells as cellular vehicles for anti-tumor immunity. Front. Immunol. 2024;14:1282758. doi: 10.3389/fimmu.2023.1282758. - DOI - PMC - PubMed
    1. Bhat J., Kabelitz D. γδ T cells and epigenetic drugs: A useful merger in cancer immunotherapy? Oncoimmunology. 2015;4:e1006088. doi: 10.1080/2162402X.2015.1006088. - DOI - PMC - PubMed

Publication types

MeSH terms

LinkOut - more resources