. 2024 May 17;13(10):867.
doi: 10.3390/cells13100867.

Uncovering miRNA-mRNA Regulatory Networks Related to Olaparib Resistance and Resensitization of BRCA2MUT Ovarian Cancer PEO1-OR Cells with the ATR/CHK1 Pathway Inhibitors

Affiliations

Uncovering miRNA-mRNA Regulatory Networks Related to Olaparib Resistance and Resensitization of BRCA2MUT Ovarian Cancer PEO1-OR Cells with the ATR/CHK1 Pathway Inhibitors

Łukasz Biegała et al. Cells. .

Abstract

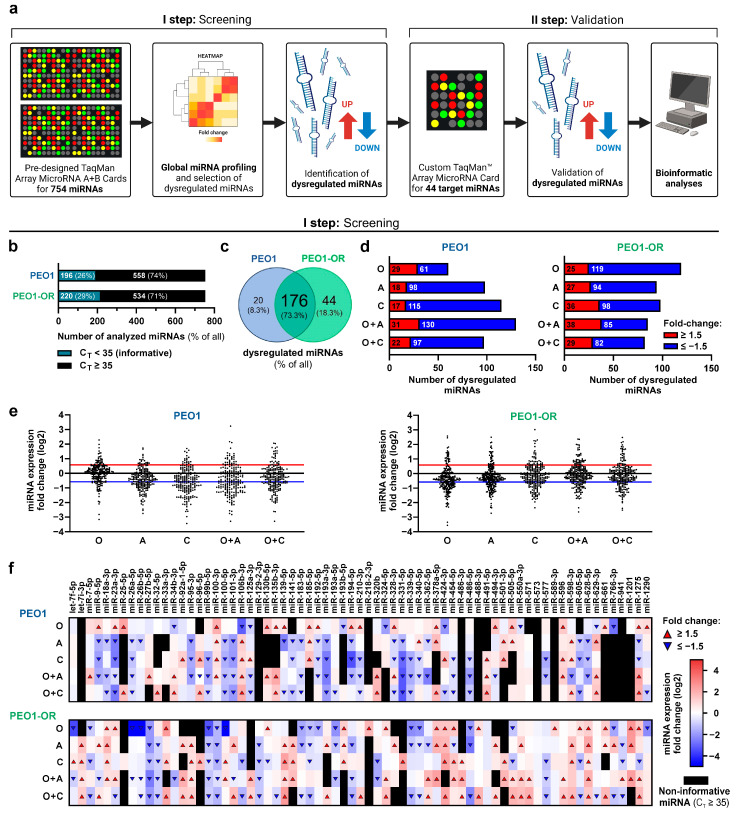
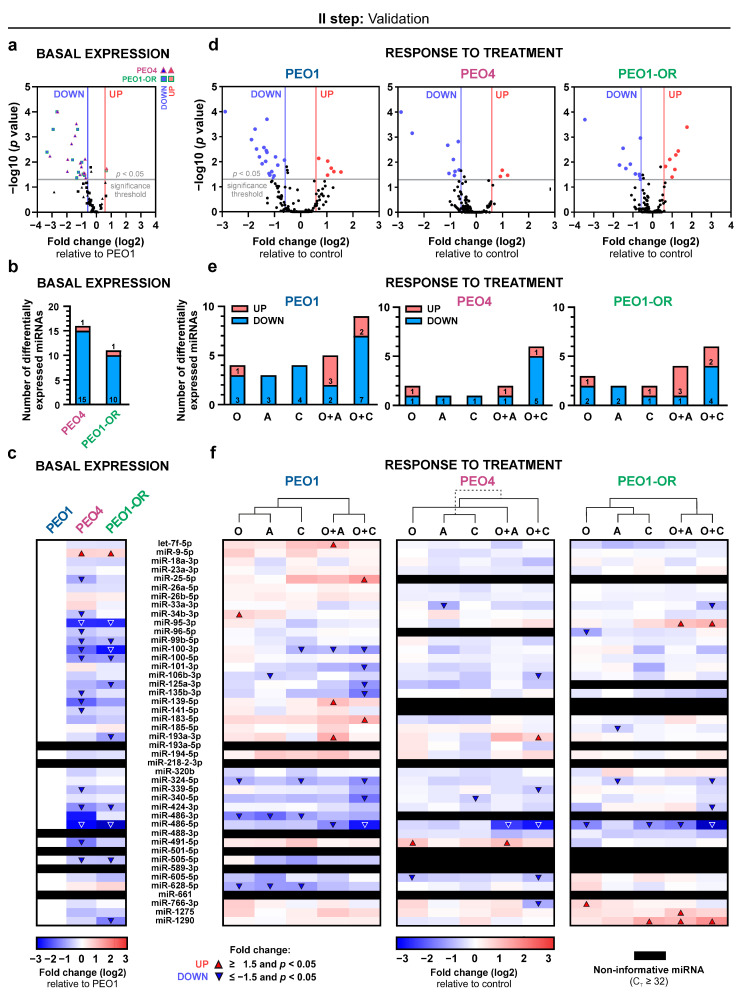
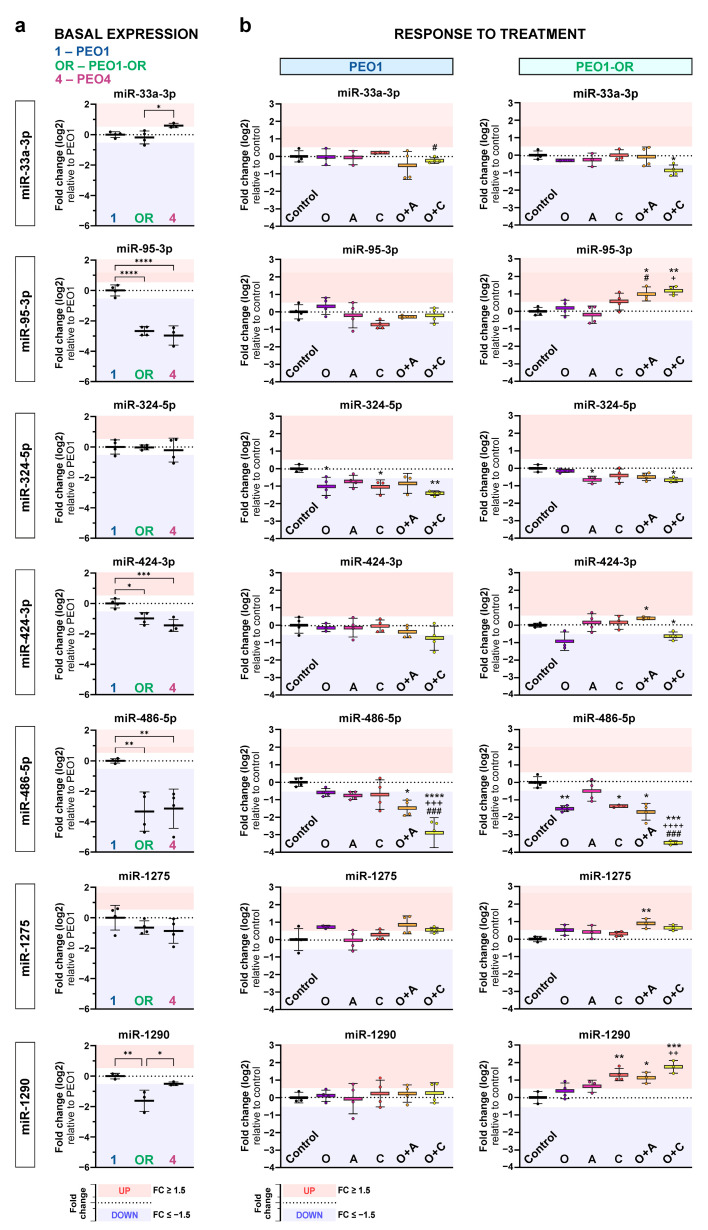
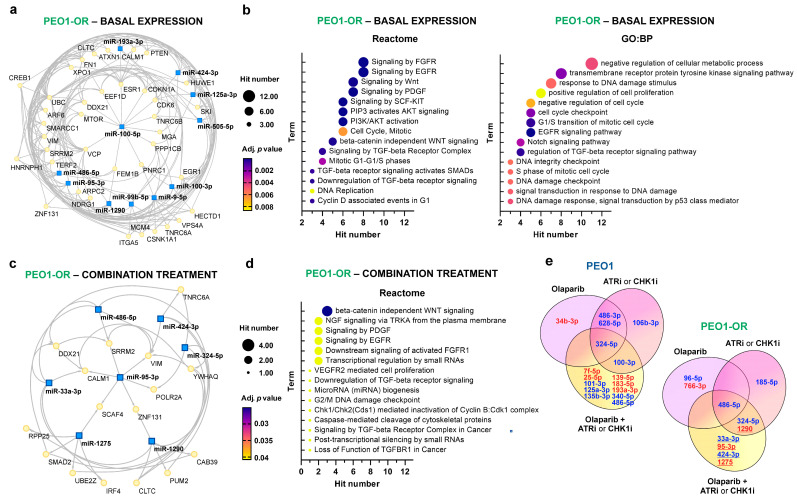
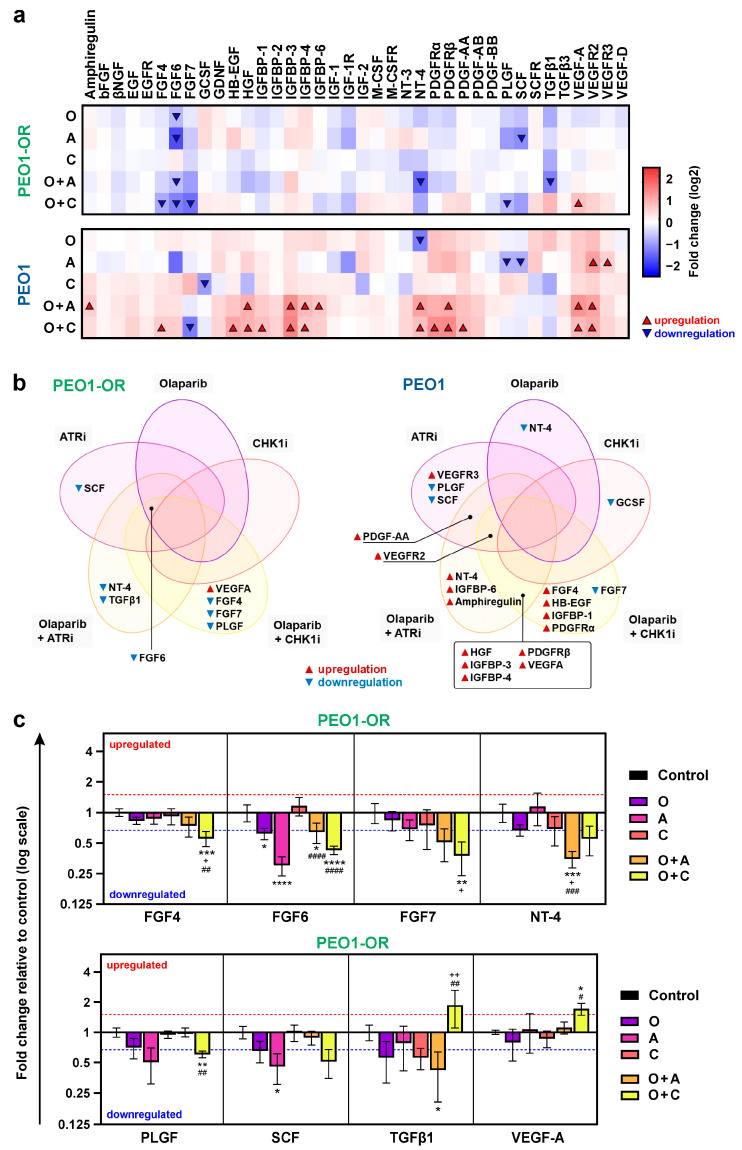
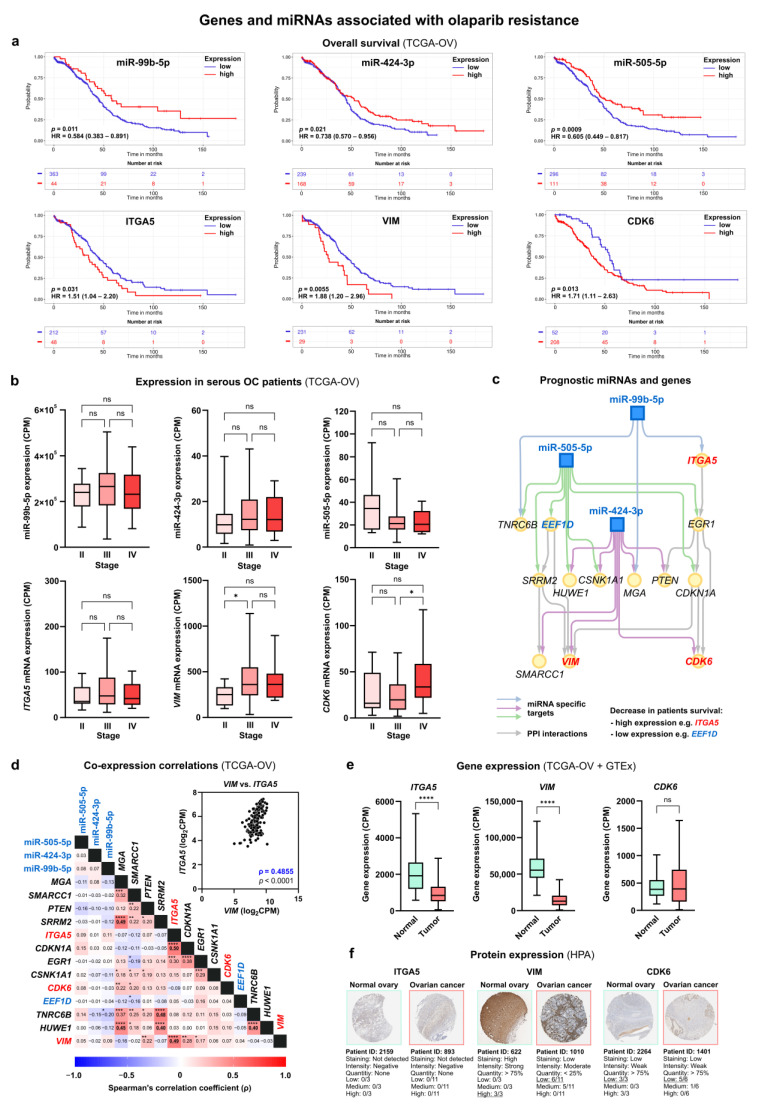
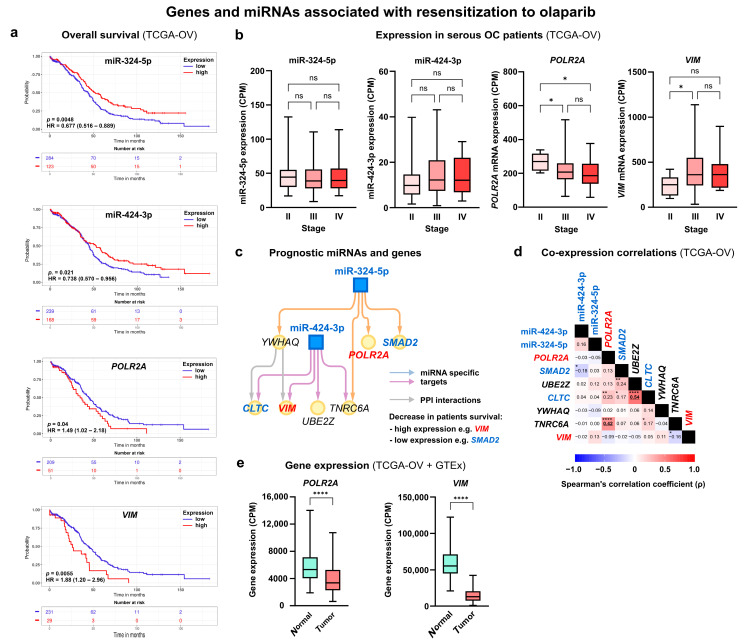
Resistance to olaparib is the major obstacle in targeted therapy for ovarian cancer (OC) with poly(ADP-ribose) polymerase inhibitors (PARPis), prompting studies on novel combination therapies to enhance olaparib efficacy. Despite identifying various mechanisms, understanding how OC cells acquire PARPi resistance remains incomplete. This study investigated microRNA (miRNA) expression in olaparib-sensitive (PEO1, PEO4) and previously established olaparib-resistant OC cell lines (PEO1-OR) using high-throughput RT-qPCR and bioinformatic analyses. The role of miRNAs was explored regarding acquired resistance and resensitization with the ATR/CHK1 pathway inhibitors. Differentially expressed miRNAs were used to construct miRNA-mRNA regulatory networks and perform functional enrichment analyses for target genes with miRNet 2.0. TCGA-OV dataset was analyzed to explore the prognostic value of selected miRNAs and target genes in clinical samples. We identified potential processes associated with olaparib resistance, including cell proliferation, migration, cell cycle, and growth factor signaling. Resensitized PEO1-OR cells were enriched in growth factor signaling via PDGF, EGFR, FGFR1, VEGFR2, and TGFβR, regulation of the cell cycle via the G2/M checkpoint, and caspase-mediated apoptosis. Antibody microarray analysis confirmed dysregulated growth factor expression. The addition of the ATR/CHK1 pathway inhibitors to olaparib downregulated FGF4, FGF6, NT-4, PLGF, and TGFβ1 exclusively in PEO1-OR cells. Survival and differential expression analyses for serous OC patients revealed prognostic miRNAs likely associated with olaparib resistance (miR-99b-5p, miR-424-3p, and miR-505-5p) and resensitization to olaparib (miR-324-5p and miR-424-3p). Essential miRNA-mRNA interactions were reconstructed based on prognostic miRNAs and target genes. In conclusion, our data highlight distinct miRNA profiles in olaparib-sensitive and olaparib-resistant cells, offering molecular insights into overcoming resistance with the ATR/CHK1 inhibitors in OC. Moreover, some miRNAs might serve as potential predictive signature molecules of resistance and therapeutic response.

Keywords: ATR/CHK1 pathway; TCGA data; bioinformatics; combination therapy; growth factors; miRNA profiling; olaparib; ovarian cancer; resistance.


Conflict of interest statement

The authors declare no conflicts of interest.

Figures

Figure 1
Figure 1
Two-step miRNA profiling strategy to screen and validate differentially expressed (DE) miRNAs in OC cell lines and miRNA screening results. (a) Workflow of the identification of DE miRNAs with pre-designed (I step) and custom (II step) TaqMan™ Array MicroRNA Cards covering 754 and 44 target miRNAs, respectively. (b) The number of informative miRNAs (CT value < 35) detected in untreated PEO1 and PEO1-OR cells with pre-designed TaqMan™ Array MicroRNA Cards used for relative quantification of miRNA expression. (c) Venn diagram representing informative miRNAs (CT value < 35) overlapping or unique for PEO1 and PEO1-OR cell lines detected with pre-designed TaqMan™ MicroRNA Array Cards. (d) The number of upregulated and downregulated miRNAs in PEO1 and PEO1-OR cells in response to olaparib (O) alone or combined with ATRi (A) or CHK1i (C) based on screening analysis. (e) Scatter dot plots representing a distribution of miRNA expression (logarithmized fold changes relative to untreated cells) in response to tested inhibitors in PEO1 and PEO1-OR cells. Dots above the red line and below the blue line indicate upregulated and downregulated miRNAs (absolute log2 of fold change ≥ 0.585), respectively. (f) Heatmap showing expression levels of 69 dysregulated miRNAs in PEO1 and PEO1-OR cells incubated with tested inhibitors. Red and blue triangles indicate upregulated and downregulated miRNA, respectively. Black rectangles indicate non-informative miRNAs in specific samples (CT ≥ 35).
Figure 2
Figure 2
Overview of the miRNA basal expression in the absence of inhibitors and changes in miRNA levels in response to tested inhibitors in OC cell lines. (a,d) Volcano plots for miRNA expression: (a) basal expression in OC cells relative to PEO1 cells; (d) changes in expression in response to tested inhibitors or their combinations relative to untreated controls. DE miRNAs were identified according to the following criteria: absolute fold changes of expression ≥1.5 and p < 0.05 based on ordinary one-way ANOVA followed by multiple comparison tests. Significantly down- and upregulated miRNAs are highlighted with blue and red dots, respectively. Non-informative miRNAs with raw CT values ≥ 32 in control cells are marked as black rectangles. (b,e) Bar charts representing the amount of significantly differentially expressed miRNAs: (b) basal expression relative to PEO1 cells; (e) changes in expression in response to tested inhibitors or their combinations relative to untreated controls. (c,f) Heatmaps for miRNA expression: (c) basal expression in OC cells relative to PEO1 cells; (f) expression changes in response to tested inhibitors or their combinations relative to untreated controls. Heatmaps were generated by a log transformation of the fold change data. Significantly (p < 0.05) down- and upregulated miRNAs (absolute fold change ≥ 1.5) are highlighted with blue and red triangles, respectively. Hierarchical clustering via heatmap was generated to visualize the clustering based on miRNA expression profiles associated with tested inhibitors.
Figure 3
Figure 3
Differential expression analysis for miRNAs dysregulated in PEO1-OR cell line at basal levels (in the absence of inhibitors) and after treatments with tested combinations. (a) Basal miRNA expression in untreated PEO1-OR cells compared to PEO1 cells. (b) miRNA expression in PEO1-OR cells treated with olaparib (O), ATRi (A), CHK1i (C), or their combinations for 2 days. Levels of miRNA were determined via real-time qPCR and expressed as means of logarithmic fold change ± SD (n = 3–4). Statistical significance was assessed with ordinary one-way ANOVA followed by multiple comparison tests: * p < 0.05, ** p < 0.01, *** p < 0.001, **** p < 0.0001 (treatment vs. control); + p < 0.05, ++ p < 0.01, +++ p < 0.001, ++++ p < 0.0001 (O vs. combination with A or C); # p < 0.05, ### p < 0.001 (A or C vs. respective combinations with O). The red and blue areas indicate FC values for upregulated and downregulated miRNAs (absolute log2 of fold change ≥ 0.585), respectively.
Figure 4
Figure 4
Network-based functional enrichment analyses of significantly differentially expressed (DE) miRNAs and their target genes in the PEO1-OR cell line. (a,c) The minimal miRNA–mRNA interaction networks in (a) untreated PEO1-OR cells and (c) PEO1-OR cells incubated with olaparib combinations. The blue square nodes represent miRNAs, and the yellow circular nodes represent target genes. (b,d) Enrichment terms visualized with bubble plots based on overrepresentation analysis for DE miRNA target genes in untreated PEO1-OR cells (b) and PEO1-OR cells incubated with olaparib combinations (d). The most significantly enriched functional annotations were selected following analysis with Reactome pathways and GO:BP databases. Terms were ranked by adjusted p value and number of target genes (hit). (e) Venn diagrams illustrating DE miRNAs in treated PEO1 and PEO1-OR cells. Significantly up- and downregulated miRNAs are highlighted with red and blue, respectively. Dysregulated miRNAs after combination treatments unique for PEO1-OR cells compared to PEO1 cells are underlined.
Figure 5
Figure 5
Hub genes associated with olaparib resistance and resensitization to olaparib with combination treatments in the PEO1-OR cell line. The top 10 hub genes were ranked (x-axis) based on the score (y-axis) calculated with the MCC algorithm using the cytoHubba plug-in in Cytoscape. Unique and shared genes are colored as described. Targeting miRNAs from the subnetwork are listed above bars for each hub gene from the PEO1-OR cell line and are highlighted with red (upregulated) or blue (downregulated) according to the results of relative quantity analysis.
Figure 6
Figure 6
Olaparib combined with ATRi or CHK1i dysregulates the expression of growth factors (GFs) in OC cell lines. (a) Heatmaps for the expression of 41 GFs and their receptors in PEO1 and PEO1-OR cell lines. (b) Venn diagram for dysregulated GFs in PEO1 and PEO1-OR cell lines. (c) Results of semi-quantitative analysis with antibody microarrays for significantly dysregulated GFs in PEO1-OR cells (absolute fold change ≥ 1.5 and p < 0.05). Cells were incubated with inhibitors (O, A, C) or their combinations (O + A, O + C) for 2 days. Data are expressed as mean fold change ± SD (n = 4) on a logarithmized scale relative to untreated control cells. Statistical significance was assessed using ordinary one-way ANOVA followed by multiple comparison tests: * p < 0.05, ** p < 0.01, *** p < 0.001, **** p < 0.0001 (treatment vs. control); + p < 0.05, ++ p < 0.01 (O vs. combination with A or C); # p < 0.05, ## p < 0.01, ### p < 0.001, #### p < 0.0001 (A or C vs. respective combinations with O).
Figure 7
Figure 7
Differentially expressed miRNAs and target genes linked to olaparib resistance associated with survival in OC patients. (a) Interaction subnetwork between miRNAs associated with poor survival in serous OC cancer patients and target genes. The subnetwork originates from the minimal network for PEO1-OR cells under normal conditions linked to olaparib resistance. Nodes with two or more connections (colored arrows) were analyzed to highlight critical relationships. Expression levels of miRNAs and genes in OC patients significantly associated with survival are highlighted with blue (low expression) and red (high expression). (b) Stage-wise differential expression of miRNAs and genes associated with decreased survival in serous OC patients (TCGA-OV). Box plots show normalized CPM values extending from the 25th to 75th percentiles, lines dividing boxes represent medians, and the whiskers show the highest and lowest values after outlier removal within groups (FDR = 1%). Statistical significance was calculated using the Kruskal–Wallis test followed by Dunn’s multiple comparison test: * p < 0.05. (c) Kaplan–Meier (KM) plots display the relationship between miRNAs or genes and clinical endpoints in HGSOC patients (OS—overall survival, PFI—progression-free interval). Plots were generated with the ToPP web-based tool for HGSOC patients split into low- and high-expression groups using the best-performing threshold as a cut-off. Statistical significance between these two groups was calculated using the log-rank test: * p < 0.05. (d) Correlation matrix of miRNA and gene expression in serous OC patients (TCGA-OV). Correlations were computed using a two-tailed Spearman’s correlation test. Spearman’s rank correlation coefficient (ρ): 0–0.19 (no correlation), 0.20–0.39 (weak correlation), 0.40–0.59 (moderate correlation). Moderate correlations are highlighted with bold and underlined. Statistical significance: * p < 0.05, ** p < 0.01, *** p < 0.001, **** p < 0.0001. (e) Differential expression of genes associated with decreased survival in serous OC patients (TCGA-OV) between normal ovaries (GTEx) and OC (TCGA-OV). The analysis was performed using the RNA-seq data from the TNMplot web-based tool. Box plots show CPM values extending from the 25th to 75th percentiles, lines dividing boxes represent medians, and whiskers show the highest and lowest values after outlier removal within groups (FDR = 1%). Statistical significance was calculated using a two-tailed Mann–Whitney test: **** p < 0.0001. (f) Verification of protein expression for selected genes in normal ovaries and serous OC using the HPA database. Images show representative immunohistochemical staining for ITGA5 (HPA002642), VIM (CAB000080), and CDK6 (CAB004363).
Figure 8
Figure 8
Differentially expressed miRNAs and target genes linked to resensitization to olaparib associated with survival in OC patients. (a) Interaction subnetwork between miRNAs associated with poor survival in serous OC cancer patients and target genes. The subnetwork originates from the minimal network for PEO1-OR cells treated with olaparib combined with ATR/CHK1 inhibitors linked to resensitization to olaparib. Expression levels of miRNAs and genes in OC patients significantly associated with survival are highlighted with blue (low expression) and red (high expression). (b) Stage-wise differential expression of miRNAs and genes associated with decreased survival in serous OC patients (TCGA-OV). Box plots show normalized CPM values extending from the 25th to 75th percentiles, lines dividing boxes represent medians, and the whiskers show the highest and lowest values after outlier removal within groups (FDR = 1%). Statistical significance was calculated using the Kruskal–Wallis test followed by Dunn’s multiple comparison test: * p < 0.05. (c) Kaplan–Meier (KM) plots showing the relationship between miRNAs or genes and clinical endpoints in HGSOC patients (OS—overall survival, PFI—progression-free interval). Plots were generated with the ToPP web-based tool for HGSOC patients split into low- and high-expression groups using the best-performing threshold as a cut-off. Statistical significance between these two groups was calculated using the log-rank test: * p < 0.05. (d) Correlation matrix of miRNA and gene expression in serous OC patients (TCGA-OV). Correlations were computed for every pair of datasets using a two-tailed Spearman’s correlation test. Spearman’s rank correlation coefficient (ρ): 0–0.19 (no correlation), 0.20–0.39 (weak correlation), 0.40–0.59 (moderate correlation). Moderate correlations are highlighted with bold and underlined. Statistical significance: * p < 0.05, ** p < 0.01, **** p < 0.0001. (e) Differential expression of genes associated with decreased survival in serous OC patients (TCGA-OV) between normal ovaries (GTEx) and OC (TCGA-OV). The analysis was performed using the RNA-seq data from the TNMplot web-based tool integrating the data for normal and cancerous tissues. Box plots show CPM values extending from the 25th to 75th percentiles, the line dividing the box represents the median, and the whiskers show the highest and lowest values after outlier removal within groups (FDR = 1%). Statistical significance was calculated using a two-tailed Mann–Whitney test: **** p < 0.0001.

Similar articles

Cited by

References

    1. DiSilvestro P., Colombo N., Scambia G., Kim B.G., Oaknin A., Friedlander M., Lisyanskaya A., Floquet A., Leary A., Sonke G.S., et al. Efficacy of Maintenance Olaparib for Patients with Newly Diagnosed Advanced Ovarian Cancer with a BRCA Mutation: Subgroup Analysis Findings from the SOLO1 Trial. J. Clin. Oncol. 2020;38:3528–3537. doi: 10.1200/JCO.20.00799. - DOI - PMC - PubMed
    1. Lisio M.A., Fu L., Goyeneche A., Gao Z.H., Telleria C. High-Grade Serous Ovarian Cancer: Basic Sciences, Clinical and Therapeutic Standpoints. Int. J. Mol. Sci. 2019;20:952. doi: 10.3390/ijms20040952. - DOI - PMC - PubMed
    1. Chen Q., Li X., Zhang Z., Wu T. Systematic Review of Olaparib in the Treatment of Recurrent Platinum Sensitive Ovarian Cancer. Front. Oncol. 2022;12:858826. doi: 10.3389/fonc.2022.858826. - DOI - PMC - PubMed
    1. Wang N., Yang Y., Jin D., Zhang Z., Shen K., Yang J., Chen H., Zhao X., Yang L., Lu H. PARP inhibitor resistance in breast and gynecological cancer: Resistance mechanisms and combination therapy strategies. Front. Pharmacol. 2022;13:967633. doi: 10.3389/fphar.2022.967633. - DOI - PMC - PubMed
    1. Nicum S., McGregor N., Austin R., Collins L., Dutton S., McNeish I., Glasspool R., Hall M., Roux R., Michael A., et al. Results of a randomised Phase II trial of olaparib, chemotherapy or olaparib and cediranib in patients with platinum-resistant ovarian cancer. Br. J. Cancer. 2024;130:941–950. doi: 10.1038/s41416-023-02567-6. - DOI - PMC - PubMed

Publication types

MeSH terms