

Cranial Computer Tomography with Photon Counting and Energy-Integrated Detectors: Objective Comparison in the Same Patients
- PMID: 38786317
- PMCID: PMC11119038
- DOI: 10.3390/diagnostics14101019
Cranial Computer Tomography with Photon Counting and Energy-Integrated Detectors: Objective Comparison in the Same Patients
Abstract
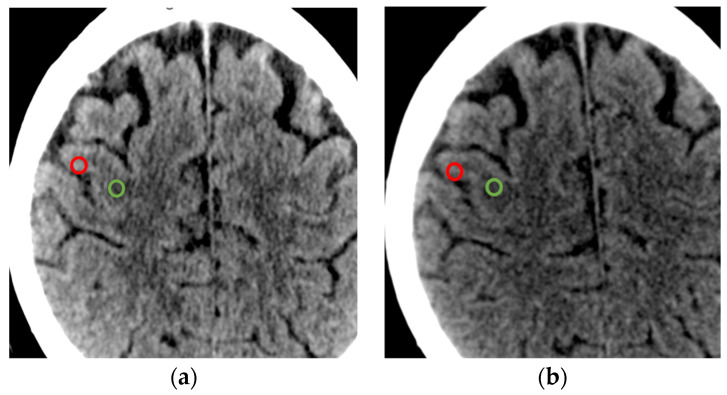
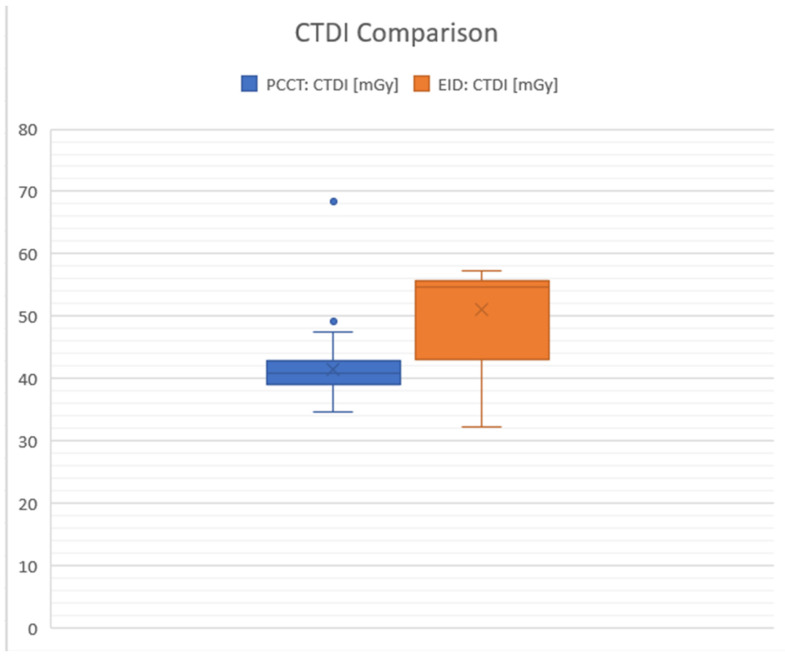
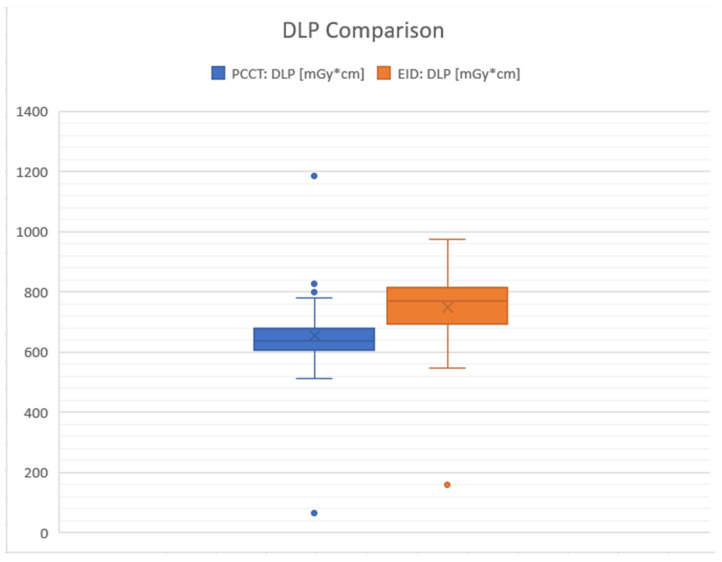
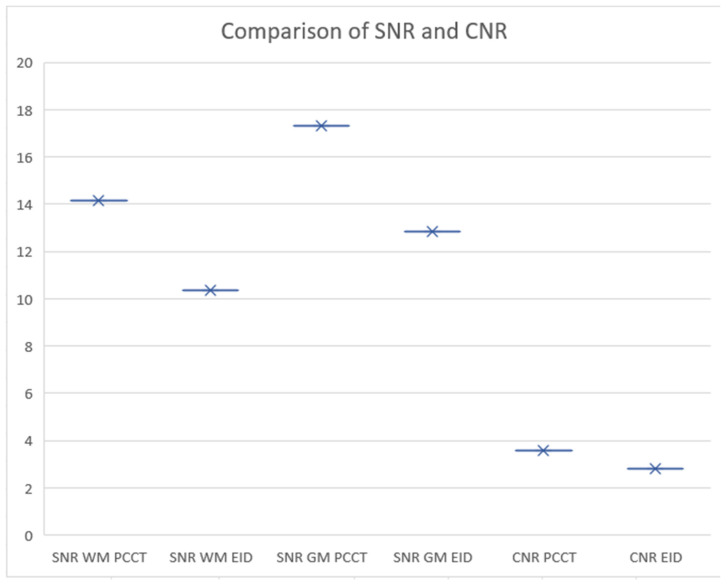
This study provides an objective comparison of cranial computed tomography (CT) imaging quality and radiation dose between photon counting detectors (PCCTs) and energy-integrated detectors (EIDs). We retrospectively analyzed 158 CT scans from 76 patients, employing both detector types on the same individuals to ensure a consistent comparison. Our analysis focused on the Computed Tomography Dose Index and the Dose-Length Product together with the contrast-to-noise ratio and the signal-to-noise ratio for brain gray and white matter. We utilized standardized imaging protocols and consistent patient positioning to minimize variables. PCCT showed a potential for higher image quality and lower radiation doses, as highlighted by this study, thus achieving diagnostic clarity with reduced radiation exposure, underlining its significance in patient care, particularly for patients requiring multiple scans. The results demonstrated that while both systems were effective, PCCT offered enhanced imaging and patient safety in neuroradiological evaluations.
Keywords: computer tomography; neurocranium; photon counting; radiation dose.
Conflict of interest statement
The authors declare no conflicts of interest.
Figures
Similar articles
-
Thin slice photon-counting CT coronary angiography compared to conventional CT: Objective image quality and clinical radiation dose assessment.Med Phys. 2024 Apr;51(4):2924-2932. doi: 10.1002/mp.16992. Epub 2024 Feb 15. Med Phys. 2024. PMID: 38358113
-
Comprehensive evaluations of a prototype full field-of-view photon counting CT system through phantom studies.Phys Med Biol. 2023 Aug 14;68(17). doi: 10.1088/1361-6560/acebb3. Phys Med Biol. 2023. PMID: 37506710
-
Initial experience on abdominal photon-counting computed tomography in clinical routine: general image quality and dose exposure.Eur Radiol. 2023 Apr;33(4):2461-2468. doi: 10.1007/s00330-022-09278-1. Epub 2022 Dec 8. Eur Radiol. 2023. PMID: 36477938 Free PMC article.
-
Photon-Counting Computed Tomography - Basic Principles, Potenzial Benefits, and Initial Clinical Experience.Rofo. 2023 Aug;195(8):691-698. doi: 10.1055/a-2018-3396. Epub 2023 Mar 2. Rofo. 2023. PMID: 36863367 Review. English.
-
Photon-Counting Computed Tomography (PCCT): Technical Background and Cardio-Vascular Applications.Diagnostics (Basel). 2023 Feb 9;13(4):645. doi: 10.3390/diagnostics13040645. Diagnostics (Basel). 2023. PMID: 36832139 Free PMC article. Review.
Cited by
-
Establishing a Foundation for the In Vivo Visualization of Intravascular Blood with Photon-Counting Technology in Spectral Imaging in Cranial CT.Diagnostics (Basel). 2024 Jul 19;14(14):1561. doi: 10.3390/diagnostics14141561. Diagnostics (Basel). 2024. PMID: 39061698 Free PMC article.
References
-
- Rava R.A., Seymour S.E., LaQue M.E., Peterson B.A., Snyder K.V., Mokin M., Waqas M., Hoi Y., Davies J.M., Levy E.I., et al. Assessment of an Artificial Intelligence Algorithm for Detection of Intracranial Hemorrhage. World Neurosurg. 2021;150:e209–e217. doi: 10.1016/j.wneu.2021.02.134. - DOI - PubMed
LinkOut - more resources
Full Text Sources
